Circulating miR-106b-3p, miR-101-3p and miR-1246 as diagnostic biomarkers of hepatocellular carcinoma
- PMID: 29632649
- PMCID: PMC5880609
- DOI: 10.18632/oncotarget.24601
Circulating miR-106b-3p, miR-101-3p and miR-1246 as diagnostic biomarkers of hepatocellular carcinoma
Abstract
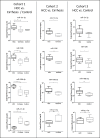
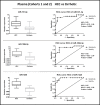
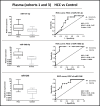
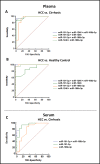
Hepatocellular carcinoma (HCC) is the most common liver cancer and second leading cause of cancer related death worldwide. Most HCCs occur in a damaged cirrhotic background and it may be difficult to discriminate between regenerative nodules and early HCCs. No dependable molecular biomarker exists for the early detection of HCC. MicroRNAs (miRNAs) have attracted attention as potential blood-based biomarkers. To identify circulating miRNAs with diagnostic potential in HCC, we performed preliminary RNAseq studies on plasma samples from a small set of HCC patients, cirrhotic patients and healthy controls. Then, out of the identified miRNAs, we investigated miR-101-3p, miR-106b-3p, miR-1246 and miR-411-5p in plasma of independent HCC patients' cohorts. The use of droplet digital PCR (ddPCR) confirmed the aberrant levels of these miRNAs. The diagnostic performances of each miRNA and their combinations were measured using Receiver Operating Characteristic (ROC) curve analyses: a classifier consisting of miR-101-3p, miR-1246 and miR-106b-3p produced the best diagnostic precision in plasma of HCC vs. cirrhotic patients (AUC = 0.99). A similar performance was found when the levels of miRNAs of HCC patients were compared to healthy controls (AUC = 1.00). We extended the analyses of the same miRNAs to serum samples. In serum of HCC vs. cirrhotic patients, the combination of miR-101-3p and miR-106b-3p exhibited the best diagnostic accuracy with an AUC = 0.96. Thus, circulating miR-101-3p, miR-106b-3p and miR-1246, either individually or in combination, exhibit a considerable potential value as diagnostic biomarkers of HCC.
Keywords: circulating microRNA; cirrhosis; diagnostic biomarkers; hepatocellular carcinoma.
Conflict of interest statement
CONFLICTS OF INTEREST All the authors declare no conflicts of interest to be disclosed with respect to this manuscript.
Figures


References
-
- Ferlay J, Soerjomataram I, Dikshit R, Eser S, Mathers C, Rebelo M, Parkin DM, Forman D, Bray F. Cancer incidence and mortality worldwide: sources, methods and major patterns in GLOBOCAN 2012. Int J Cancer. 2015;136:E359–386. - PubMed
-
- Bugianesi E. Non-alcoholic steatohepatitis and cancer. Clin Liver Dis. 2007;11:191–207. x-xi. - PubMed
-
- Siegel RL, Miller KD, Jemal A. Cancer statistics, 2015. CA Cancer J Clin. 2015;65:5–29. - PubMed
-
- American Cancer Society I Surveillance Research cancer facts and figures. 2015.
Grants and funding
LinkOut - more resources
Full Text Sources
Other Literature Sources

