. 2018 Jan 16;7(4):e1412909.
doi: 10.1080/2162402X.2017.1412909. eCollection 2018.

Glioblastoma stem cell-derived exosomes induce M2 macrophages and PD-L1 expression on human monocytes

Affiliations

Glioblastoma stem cell-derived exosomes induce M2 macrophages and PD-L1 expression on human monocytes

Konrad Gabrusiewicz et al. Oncoimmunology. .

Abstract

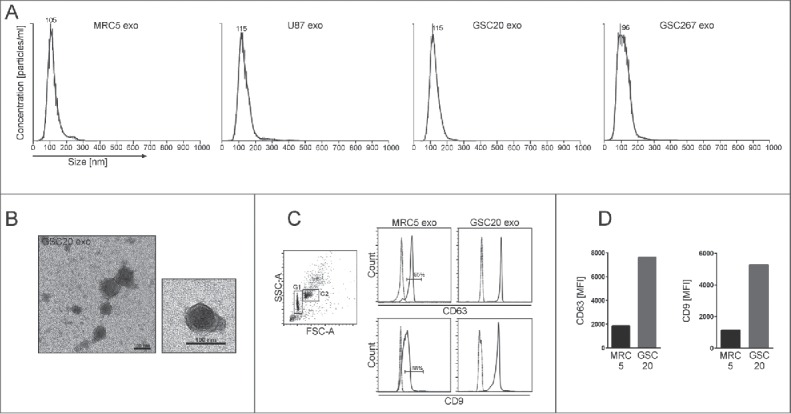
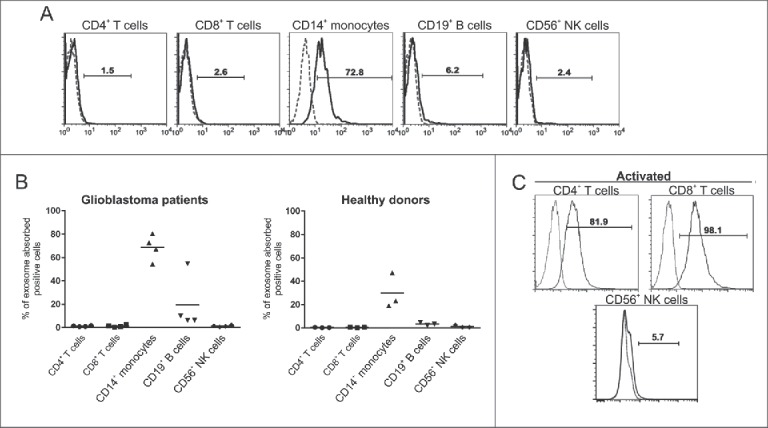
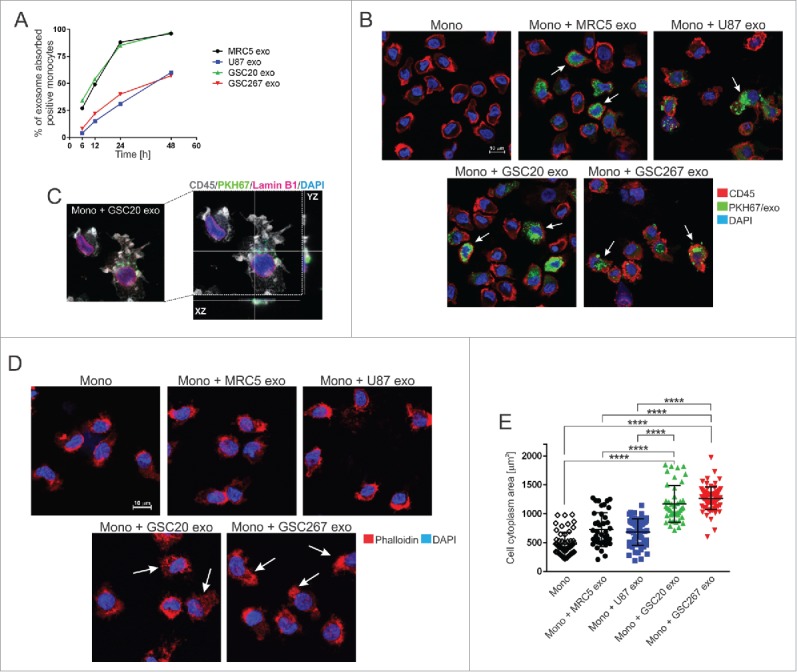
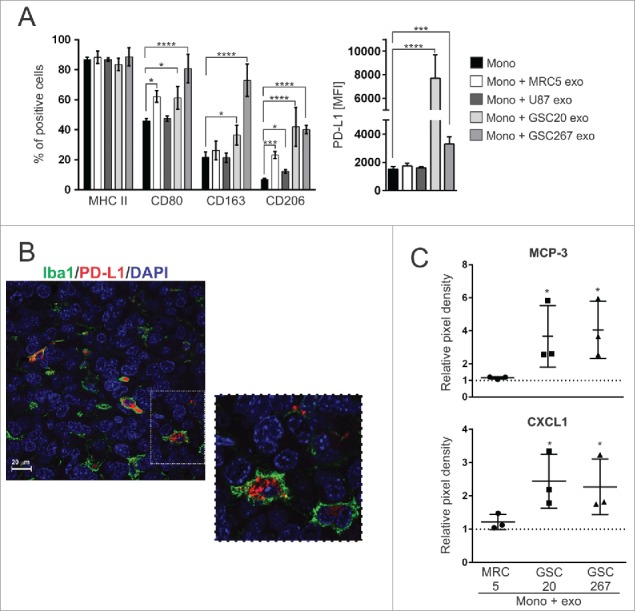
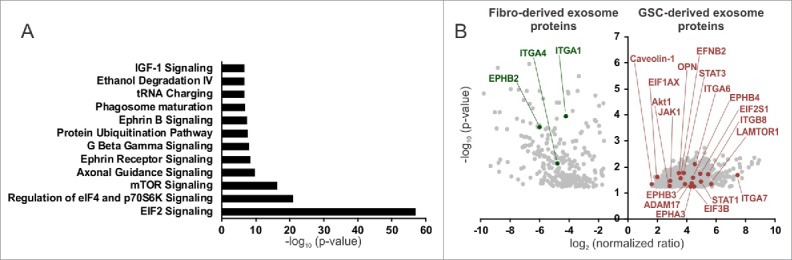
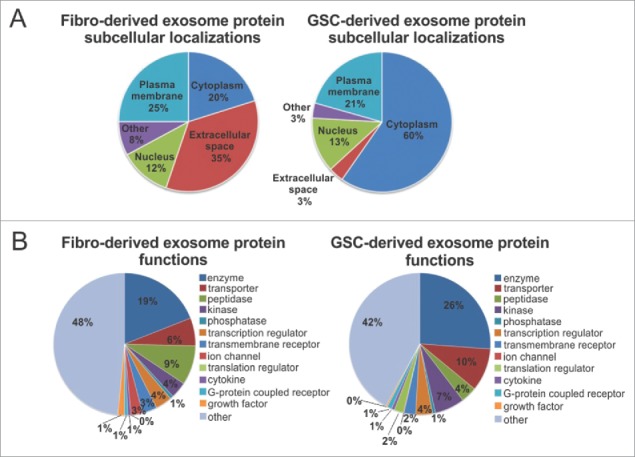
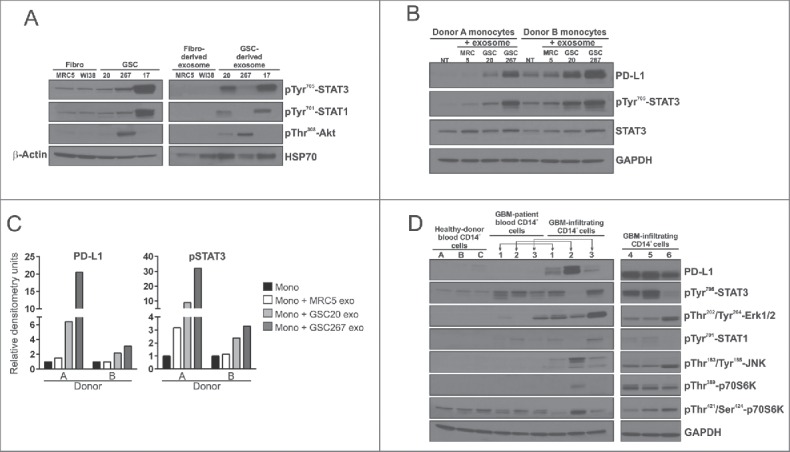
Exosomes can mediate a dynamic method of communication between malignancies, including those sequestered in the central nervous system and the immune system. We sought to determine whether exosomes from glioblastoma (GBM)-derived stem cells (GSCs) can induce immunosuppression. We report that GSC-derived exosomes (GDEs) have a predilection for monocytes, the precursor to macrophages. The GDEs traverse the monocyte cytoplasm, cause a reorganization of the actin cytoskeleton, and skew monocytes toward the immune suppresive M2 phenotype, including programmed death-ligand 1 (PD-L1) expression. Mass spectrometry analysis demonstrated that the GDEs contain a variety of components, including members of the signal transducer and activator of transcription 3 (STAT3) pathway that functionally mediate this immune suppressive switch. Western blot analysis revealed that upregulation of PD-L1 in GSC exosome-treated monocytes and GBM-patient-infiltrating CD14+ cells predominantly correlates with increased phosphorylation of STAT3, and in some cases, with phosphorylated p70S6 kinase and Erk1/2. Cumulatively, these data indicate that GDEs are secreted GBM-released factors that are potent modulators of the GBM-associated immunosuppressive microenvironment.

Keywords: PD-L1; STAT3; cancer stem cells; exosome; glioblastoma; immune cells.


Figures

Figure 1.
Figure 1.
Characterization of exosomes. (A) Representative histograms of exosomes derived from MRC5, U87, GSC20, and GSC267 cells. Axis X = size distribution [nm]. Axis Y = concentration [particles/ml]. (B) Representative transmission electron microscope images of exosomes isolated from GSC20. Scale bar = 100 nm. (C) and (D) Flow cytometric analysis of GSC20 and MRC5 exosomes bound to Dynabeads. (C) Left dot plot FSC-A/SSC-A shows the singlet and bead/exosome complex [G1] and the aggregated bead/exosome complex [G2]. Right histograms were gated on G1. MRC5 and GSC20 exosomes were bound to CD63-coated Dynabeads and stained with isotype controls (dashed line) or CD63-FITC, CD9-Brilliant Violet 510 (solid line), and analyzed by flow cytometry. (D) The mean fluorescence intensity [MFI] of CD63 and CD9 expression in MRC5 and GSC20 exosomes.
Figure 2.
Figure 2.
Intracellular uptake of exosomes by immune populations is variable. (A) Representative flow cytometry histograms demonstrating uptake of glioblastoma stem cell (GSC)20-derived exosomes labeled with PHK67 and incubated with peripheral blood mononuclear cells from GBM patients for 6 h. Cells were labeled with the indicated surface antibodies (solid line) or isotype controls (dashed line). Exosome uptake within the designated cellular population was characterized by flow cytometry. (B) Summarized data of uptake of labeled GSC20-derived exosomes by immune cell populations from GBM patients (left) and healthy donors (right). Each symbol represents the data from one patient or donor. The horizontal lines represent the average percentage for each of the 5 cell types. (C) T cells were activated with anti-CD3/anti-CD28 antibodies, and NK cells were activated by PMA and ionomycin, and then cells were incubated with PHK67-labeled GSC20 exosomes for 6 h. Then cells were labeled with the indicated surface antibodies (solid line) or isotype controls (dashed line). Exosome uptake within the CD4+ or CD8+ T-cell population and CD56+ NK cells was analyzed by flow cytometry. These data were replicated twice with two different donors with similar results.
Figure 3.
Figure 3.
Exosome internalization by human monocytes. (A) The kinetics of exosome uptake by monocytes. Monocytes were exposed to PKH67-labeled MRC5 (black line), U87 (blue line), GSC20 (green line), and GSC267 (red line) exosomes for 6, 12, 24, and 48 h. After cell membrane permeabilization, cells were acquired on flow cytometer. (B) Representative confocal microscope images of monocytes treated with PKH67-labeled exosomes (green). At 48 h post treatment with exosomes, monocytes were stained with anti-CD45 antibody, followed by a secondary Alexa Fluor-555 antibody (red) and counterstained with DAPI (blue). White arrows indicate cells with internalized exosomes. Scale bar = 10 µm. (C) Representative high-resolution confocal microscope image of monocytes exposed to PKH67-labeled GSC20 exosomes (green). At 48 h post treatment with exosomes, monocytes were stained with anti-CD45 (grey) and anti-Lamin B1 antibody (pink) followed by fluorescent secondary antibodies. DAPI nuclear staining is blue. Right image: confocal projection from z-stack images of GSC20 exosome-internalized monocytes. (D) Representative confocal microscope images of monocytes exposed for 48 h to exosomes, stained with Alexa Fluor 555 Phalloidin (red) and DAPI (blue). White arrows indicate cells with actin reorganization. Scale bar = 10 mm. (E) Cytoplasmic area of monocytes treated with exosomes is shown. Monocytes only (diamond), monocytes + MRC5 exosomes (black circle), monocytes + U87 exosomes (blue square), monocytes + GSC20 exosomes (green triangle), monocytes + GSC267 exosomes (red triangle). Three randomly chosen fields were captured using an Andor Revolution WD Spinning Disk confocal microscope and analyzed using the Bit Plane Imaris software. The data are presented as the mean ± SD. A linear regression model was used to calculate P values. ****P < 0.0001.
Figure 4.
Figure 4.
GSC-derived exosomes polarize monocytes into an M2-like phenotype. (A) Expression of M1 and M2 markers (left) and mean fluorescence intensity [MFI] of PD-L1 (right) in monocytes treated with different exosomes are shown. The data were derived from three independent experiments and are presented as the mean ± SD. A linear mixed-effects model was used to calculate P values. *P < 0.05; ***P < 0.001; ****P < 0.0001. (B) Representative confocal fluorescence microscopy image of Iba1 (green) and PD-L1 (red) staining in GBM tissue from patients. DAPI (blue) was used for nuclear staining. Scale bar = 20 µm. (C) Relative pixel density of MCP-3 and CXCL1 production by monocytes treated with exosomes. Forty-eight hours after monocyte exposure to exosomes, conditioned medium was harvested, and the Proteome Profiler Human XL Cytokine Array Kit was used to determine the cytokine production. Fold increase in protein production was calculated beyond background using densitometry as measured using the Image Studio Lite software. The data are presented as the mean ± SD. A linear mixed-effects model was used to calculate P values. The dashed line represents untreated monocytes. *P < 0.05 is presented on the graph for both MCP-3 and CXCL1 (mono + GSC20 exo vs. mono; mono + GSC267 exo vs. mono). *P < 0.05 for MCP-3 (mono + GSC267 exo vs. mono + MRC5 exo). P = 0.0518 for MCP-3 (mono + GSC20 exo vs. mono + MRC5 exo).
Figure 5.
Figure 5.
Proteomic analysis of GSC- and fibroblast-derived exosomes. (A) Pathway annotation of the GSC-derived exosome (GSC20, 17, 267) proteins vs. fibroblast-derived exosome (MRC5, WI38) proteins (fold change > 4, P < 0.05). The –log (P value) for each pathway is listed. (B) A volcano plot of protein enrichment in samples from fibroblast- (MRC5, WI38) and GSC-derived exosomes (GSC20, 17, 267). Only the statistically significant results (P < 0.05) are shown.
Figure 6.
Figure 6.
Subcellular localization and function of GSC- and fibroblast-derived exosomes. (A) and (B) Fibroblast-derived exosome proteins and GSC-derived exosome proteins are grouped based on (A) their localizations and (B) cellular functions as indicated by Gene Ontology (GO) analysis and a literature search.
Figure 7.
Figure 7.
PD-L1 pathway analysis in monocytes treated with exosomes and in CD14+ cells from blood and tumor tissue of GBM patients. (A) Western blot analysis of p-STAT3, p-STAT1, p-Akt, β-Actin, Hsp70 in fibroblasts, GSCs, fibroblast- and GSC-derived exosomes. (B) Western blot analysis of PD-L1, p-STAT3, STAT3, GAPDH in monocytes from two donors treated with fibroblast- and GSC-derived exosomes. (C) Densitometric analysis of PD-L1 and p-STAT3 protein expression in monocytes from two donors treated with exosomes. (D) Western blot analysis of PD-L1, p-STAT3, p-STAT1, p-Erk1/2, pJNK, pp70S6K, and GADPH in CD14+ cells from healthy donor blood (n = 3), in CD14+ cells in blood from GBM patients (n = 3), and in GBM-infiltrating CD14+ cells (n = 6).

References

    1. Simons M, Raposo G. Exosomes–vesicular carriers for intercellular communication. Curr Opin Cell Biol. 2009;21(4):575–581. doi:10.1016/j.ceb.2009.03.007 - DOI - PubMed
    1. Mulcahy LA, Pink RC, Carter DR. Routes and mechanisms of extracellular vesicle uptake. J Extracell Vesicles. 2014;3:1–14. doi:10.3402/jev.v3.24641. - DOI - PMC - PubMed
    1. Tian T, Zhu YL, Hu FH, Wang YY, Huang NP, Xiao ZD. Dynamics of exosome internalization and trafficking. J Cell Physiol. 2013;228(7):1487–1495. doi:10.1002/jcp.24304 - DOI - PubMed
    1. Svensson KJ, Christianson HC, Wittrup A, Bourseau-Guilmain E, Lindqvist E, Svensson LM, Morgelin M, Belting M. Exosome uptake depends on ERK1/2-heat shock protein 27 signaling and lipid raft-mediated endocytosis negatively regulated by caveolin-1. J Biol Chem. 2013;288(24):17713–17724. doi:10.1074/jbc.M112.445403 - DOI - PMC - PubMed
    1. Manda SV, Kataria Y, Tatireddy BR, Ramakrishnan B, Ratnam BG, Lath R, Ranjan A, Ray A. Exosomes as a biomarker platform for detecting epidermal growth factor receptor-positive high-grade gliomas. J Neurosurg. 2017:1–11. doi:10.3171/2016.11.JNS161187 - DOI - PubMed

Publication types