. 2018;17(7):903-916.
doi: 10.1080/15384101.2018.1460023. Epub 2018 May 21.

Metabolic reprogramming enables hepatocarcinoma cells to efficiently adapt and survive to a nutrient-restricted microenvironment

Affiliations

Metabolic reprogramming enables hepatocarcinoma cells to efficiently adapt and survive to a nutrient-restricted microenvironment

Shamir Cassim et al. Cell Cycle. 2018.

Abstract

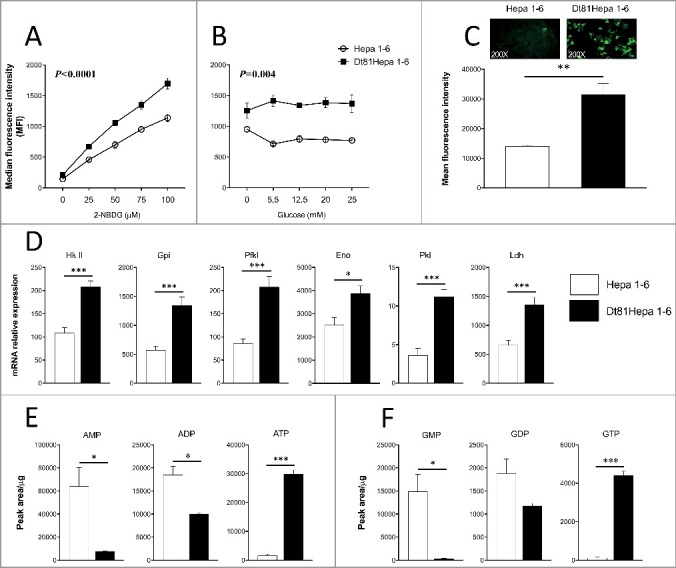
Hepatocellular carcinoma (HCC) is a metabolically heterogeneous cancer and the use of glucose by HCC cells could impact their tumorigenicity. Dt81Hepa1-6 cells display enhanced tumorigenicity compared to parental Hepa1-6 cells. This increased tumorigenicity could be explained by a metabolic adaptation to more restrictive microenvironments. When cultured at high glucose concentrations, Dt81Hepa1-6 displayed an increased ability to uptake glucose (P<0.001), increased expression of 9 glycolytic genes, greater GTP and ATP (P<0.001), increased expression of 7 fatty acid synthesis-related genes (P<0.01) and higher levels of Acetyl-CoA, Citrate and Malonyl-CoA (P<0.05). Under glucose-restricted conditions, Dt81Hepa1-6 used their stored fatty acids with increased expression of fatty acid oxidation-related genes (P<0.01), decreased triglyceride content (P<0.05) and higher levels of GTP and ATP (P<0.01) leading to improved proliferation (P<0.05). Inhibition of lactate dehydrogenase and aerobic glycolysis with sodium oxamate led to decreased expression of glycolytic genes, reduced lactate, GTP and ATP levels (P<0.01), increased cell doubling time (P<0.001) and reduced fatty acid synthesis. When combined with cisplatin, this inhibition led to lower cell viability and proliferation (P<0.05). This metabolic-induced tumorigenicity was also reflected in human Huh7 cells by a higher glucose uptake and proliferative capacity compared to HepG2 cells (P<0.05). In HCC patients, increased tumoral expression of Glut-1, Hexokinase II and Lactate dehydrogenase correlated with poor survival (P = 2.47E-5, P = 0.016 and P = 6.58E-5). In conclusion, HCC tumorigenicity can stem from a metabolic plasticity allowing them to thrive in a broader range of glucose concentrations. In HCC, combining glycolytic inhibitors with conventional chemotherapy could lead to improved treatment efficacy.

Keywords: Liver; glucose; hepatocellular carcinoma; metabolism; microenvironment.


Figures

Figure 1.
Figure 1.
Dt81Hepa1-6 cells show an improved ability to uptake and use glucose through aerobic glycolysis. Evaluation of glucose uptake was performed using a fluorescent analog of glucose: 2-NBDG. Median fluorescence intensity analysis of glucose uptake with (A) increasing doses of 2-NBDG [0-100 μM] in glucose-free DMEM and: (B) fixed dose of 2-NBDG [50 μM] in 0 to 25 mM glucose DMEM. (C) Representative microphotographs of 2-NBDG-labeled Hepa1-6 and Dt81Hepa1-6 cells [50 μM of 2-NBDG]. (D) mRNA relative gene expression of Hexokinase II (Hk II), Glucose-6-phosphate isomerase (Gpi), Phosphofructokinase liver (Pfkl), Enolase (Eno), Pyruvate kinase liver (Pkl) and Lactate dehydrogenase (Ldh) by Hepa1-6 and Dt81Hepa1-6 cells after a 48 hours incubation in 25 mM glucose DMEM. (E-F) Quantification of total intracellular AMP, ADP, ATP and GMP, GDP, GTP in Dt81Hepa1-6 and Hepa1-6 cells after a 48 hours incubation in 25 mM glucose DMEM. Values are ±SEM of 3 independent experiments. (*P<0.05, **P<0.01, ***P<0.001).
Figure 2.
Figure 2.
Dt81Hepa1-6 cells showed a greater ability to synthesize fatty acids in presence of glucose. Hepa1-6 and Dt81Hepa1-6 cells were cultured in 25 mM glucose DMEM for 48 hours. (A) mRNA relative gene expression of Citrate synthase (CS), Citrate carrier (CiC), ATP citrate lyase (Acly), Acetyl-CoA carboxylase (Acc), Fatty acid synthase (Fasn), Glycerol phosphate acyltransferase (Gpat) and Acylglycerol phosphate acyltransferase (Agpat). (B) Evaluation of total intracellular Acetyl-CoA, Citrate and Malonyl-CoA. Values are ±SEM of at least 3 independent experiments. (*P<0.05, **P<0.01, ***P<0.001).
Figure 3.
Figure 3.
In glucose-restricted condition, Dt81Hepa1-6 cells can oxidize their stored fatty acids. Hepa1-6 and Dt81Hepa1-6 cells were cultured in 0, 5.5 and 25 mM glucose DMEM for 48 hours. (A-C) mRNA relative gene expression of Acyl-CoA dehydrogenase long-chain (AcadL), Acyl-CoA dehydrogenase medium-chain (AcadM) and Peroxisome proliferator-activated receptor gamma coactivator 1-alpha (Pgc-1α). (D) Quantification of triglyceride content. Values are ±SEM of at least 8 independent experiments. (*P<0.05, **P<0.01, ***P<0.001).
Figure 4.
Figure 4.
Fatty acid oxidation in low glucose concentrations improves the viability and ability of Dt81Hepa1-6 cells to proliferate. (A) Cell doubling time of Hepa1-6 and Dt81Hepa1-6 cells cultured in 0, 5.5 and 25 mM glucose DMEM for 72 hours. (B) Quantification of total intracellular GTP and ATP in Hepa1-6 and Dt81Hepa1-6 cells after a 48 hours incubation in glucose-free DMEM. (C) Proliferation/viability of Dt81Hepa1-6 cells in glucose-free DMEM following in vitro exposure to Etomoxir (Eto) [40 μM] for 72 hours compared to untreated Dt81Hepa1-6 cells. Values are ±SEM of at least 3 independent experiments. (*P<0.05, **P<0.01, ***P<0.001).
Figure 5.
Figure 5.
Targeting the Warburg effect prevents aerobic glycolysis and fatty acid biosynthesis in Dt81Hepa1-6 cells. Dt81Hepa1-6 cells were cultured in 25 mM glucose DMEM after a 48 hours incubation. (A) mRNA relative gene expression of Hexokinase II (Hk II), Glucose-6-phosphate isomerase (Gpi), Phosphofructokinase liver (Pfkl), Enolase (Eno), Pyruvate kinase liver (Pkl) and Lactate dehydrogenase (Ldh) in Dt81Hepa1-6 and Oxa-treated Dt81Hepa1-6 cells [100 mM] after a 48 hours incubation. (B) Quantification of total intracellular Lactate, GTP and ATP in Dt81Hepa1-6 and Oxa-treated Dt81Hepa1-6 cells [100 mM]. (C) mRNA relative gene expression of Citrate synthase (CS), Citrate carrier (CiC), ATP citrate lyase (Acly), Acetyl-CoA carboxylase (Acc) and Fatty acid synthase (Fasn) in Dt81Hepa1-6 and sodium oxamate (Oxa)-treated Dt81Hepa1-6 cells [100 mM]. (D) Quantification of total intracellular Malonyl-CoA and (E) assessment of triglyceride (TG) content, in Dt81Hepa1-6 and Oxa-treated Dt81Hepa1-6 cells [100 mM]. Values are ±SEM of at least 3 independent experiments. (*P<0.05, **P<0.01, ***P<0.001).
Figure 6.
Figure 6.
Inhibition of aerobic glycolysis reduces the viability and proliferation of Dt81Hepa1-6 cells and potentiates cisplatin chemotherapy. Dt81Hepa1-6 cells were cultured in 25 mM glucose DMEM. (A) Cell doubling time of Dt81Hepa1-6 and sodium oxamate (Oxa)-treated Dt81Hepa1-6 cells [100 mM]. (B) Assessment of mitochondrial membrane potential of Dt81Hepa1-6 and Oxa-treated Dt81Hepa1-6 cells [100 mM] using MitoTracker® Red CMXRos [200 nM]. (C) Quantification of reactive oxygen species (ROS) in Dt81Hepa1-6 and Oxa-treated Dt81Hepa1-6 cells [100 mM] using MitoTracker® Red CM-H2XRos [1 μM]. (D) Proliferation/viability of Dt81Hepa1-6 cells following in vitro exposures to sodium oxamate (Oxa) [100 mM], cisplatin (Cp) [25 mg/mL] and both sodium oxamate and cisplatin (Oxa+Cp) for 48 hours. Values are ±SEM of at least 3 independent experiments. (*P<0.05, ***P<0.001).
Figure 7.
Figure 7.
Functional characterization of human HCC Huh7 and HepG2 cells. Evaluation of glucose uptake was performed using 2-NBDG. (A) Median fluorescence intensity analysis of glucose uptake in Huh7 and HepG2 cells with increasing doses of 2-NBDG [0-100 μM] in glucose-free DMEM. (B) Cell doubling time of Huh7 and HepG2 cells cultured in 25 mM glucose DMEM for 72 hours. Values are ±SEM of at least 4 independent experiments. (*P<0.05).
Figure 8.
Figure 8.
Prognostic value of Glut-1, Hk II and Ldh expressions by Hepatocellular Carcinoma (HCC) patients for survival. (A-C) Kaplan-Meier (KM) plots of overall survival probability (plotted on Y-axis) of HCC cancer patients is shown (TCGA data). Patients have been stratified into high (red lines) or low (green lines) expression-based ‘risk-groups’ by their mean of median transcript-expressions of Glut-1, Hk II and Ldh, respectively. The patient follow-up is indicated in days on the X-axis. Respective Log-rank test p-values and Hazard Ratio (HR) are shown. The numbers of patients for each group are indicated below the respective KM plots.

References

    1. Kroemer G, Pouyssegur J. Tumor cell metabolism: cancer's Achilles' heel. Cancer Cell. 2008;13(6):472–482. doi:10.1016/j.ccr.2008.05.005. PMID:18538731. - DOI - PubMed
    1. DeBerardinis RJ, Lum JJ, Hatzivassiliou G, et al. . The biology of cancer: metabolic reprogramming fuels cell growth and proliferation. Cell Metab. 2008;7(1):11–20. doi:10.1016/j.cmet.2007.10.002. PMID:18177721. - DOI - PubMed
    1. Warburg O. On the origin of cancer cells. Science. 1956;123(3191):309–314. doi:10.1126/science.123.3191.309. PMID:13298683. - DOI - PubMed
    1. Vander Heiden MG, Cantley LC, Thompson CB. Understanding the Warburg effect: the metabolic requirements of cell proliferation. Science. 2009;324(5930):1029–1033. doi:10.1126/science.1160809. PMID:19460998; PMCID: PMCPMC2849637. - DOI - PMC - PubMed
    1. Robey IF, Stephen RM, Brown KS, et al. . Regulation of the Warburg effect in early-passage breast cancer cells. Neoplasia. 2008;10(8):745–756. doi:10.1593/neo.07724. PMID:18670636; PMCID: PMCPMC2481565. - DOI - PMC - PubMed

Publication types

MeSH terms