. 2018 Jul;18(7):897-914.
doi: 10.1089/ast.2017.1700. Epub 2018 Mar 20.

Earth Without Life: A Systems Model of a Global Abiotic Nitrogen Cycle

Affiliations

Earth Without Life: A Systems Model of a Global Abiotic Nitrogen Cycle

Matthieu Laneuville et al. Astrobiology. 2018 Jul.

Abstract

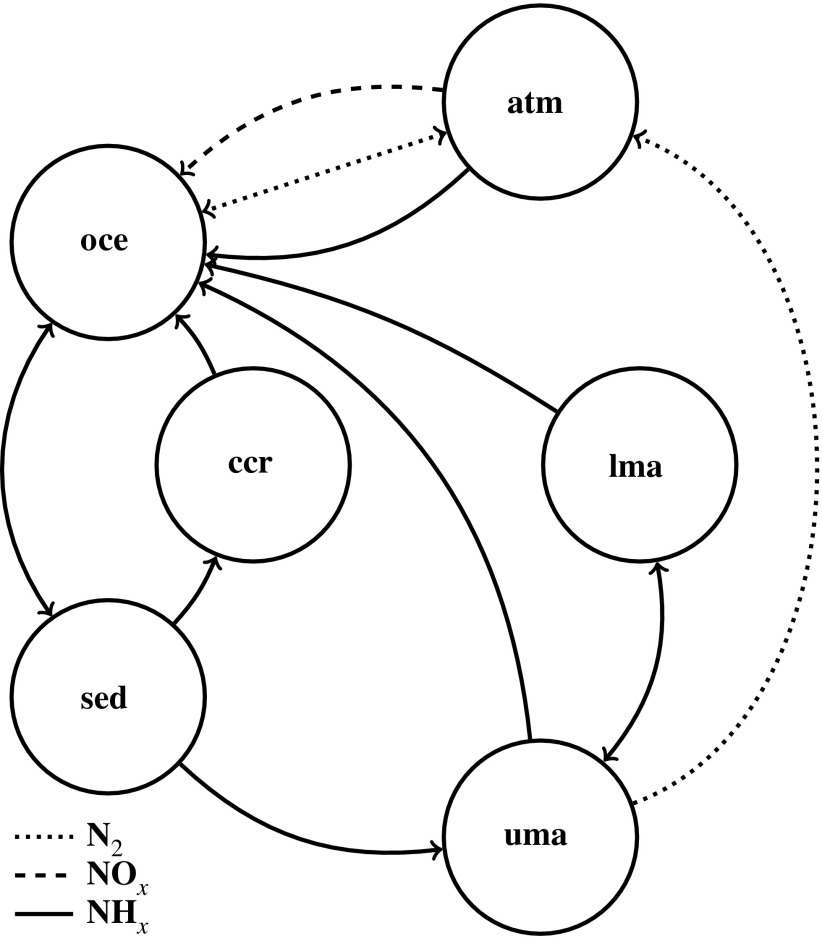
Nitrogen is the major component of Earth's atmosphere and plays important roles in biochemistry. Biological systems have evolved a variety of mechanisms for fixing and recycling environmental nitrogen sources, which links them tightly with terrestrial nitrogen reservoirs. However, prior to the emergence of biology, all nitrogen cycling was abiological, and this cycling may have set the stage for the origin of life. It is of interest to understand how nitrogen cycling would proceed on terrestrial planets with comparable geodynamic activity to Earth, but on which life does not arise. We constructed a kinetic mass-flux model of nitrogen cycling in its various major chemical forms (e.g., N2, reduced (NHx) and oxidized (NOx) species) between major planetary reservoirs (the atmosphere, oceans, crust, and mantle) and included inputs from space. The total amount of nitrogen species that can be accommodated in each reservoir, and the ways in which fluxes and reservoir sizes may have changed over time in the absence of biology, are explored. Given a partition of volcanism between arc and hotspot types similar to the modern ones, our global nitrogen cycling model predicts a significant increase in oceanic nitrogen content over time, mostly as NHx, while atmospheric N2 content could be lower than today. The transport timescales between reservoirs are fast compared to the evolution of the environment; thus atmospheric composition is tightly linked to surface and interior processes. Key Words: Nitrogen cycle-Abiotic-Planetology-Astrobiology. Astrobiology 18, 897-914.


Figures

<b>FIG. 1.</b>
FIG. 1.
Model topology used in this study. Circles represent nitrogen reservoirs and correspond, clockwise, to atmosphere (atm), lower (lma) and upper (uma) mantle, marine sediments (sed), continental crust (ccr), and oceans (oce). Arrows represent fluxes between reservoirs, with arrow style indicating the nitrogen speciation of that flux.
<b>FIG. 2.</b>
FIG. 2.
Model time dependence of the fluxes. (a) Net nitrogen addition to the Earth system from extraterrestrial sources. (b) Atmospheric N2 fixation by impacts. This flux is scaled to 1 PAL N2. (c) Ocean volume fraction circulated through hydrothermal vents per 10 Ma. (d) Mantle fraction circulated per 10 Ma. This constrains the rate at which the upper and lower mantle equilibrate. The last two functions act as a prefactor to the overall mass flux calculation.
<b>FIG. 3.</b>
FIG. 3.
Nitrogen content as a function of time in the main reservoirs for a high abiotic atmospheric fixation rate. (a) Atmospheric N2, (b) upper and lower mantle (NHx), dissolved oceanic NOx (c) and NHx (d). Dashed lines represent present-day values. For oceanic NHx this value is 3 × 10−4 mM and therefore does not appear on the figure. The randomly seeded range of initial conditions all collapse on the same evolutionary trend during the first ∼500 Ma (see also Fig. 5).
<b>FIG. 4.</b>
FIG. 4.
Nitrogen content as a function of time in the main reservoirs for a low abiotic fixation rate. (a) Atmospheric N2, (b) upper and lower mantle (NHx), dissolved oceanic NOx (c) and NHx (d). Dashed lines represent present-day values. For oceanic NHx this value is 3 × 10−4 mM and therefore does not appear on the figure. The randomly seeded range of initial conditions take several billion years to collapse on the same evolutionary trend (see also Fig. 5).
<b>FIG. 5.</b>
FIG. 5.
Example of evolutionary curves in the atmospheric N2 (x axis)/upper mantle NHx (y axis) plane for the model presented in Fig. 3. Circles denote initial conditions and the star the common final state. Every simulation joins the common evolutionary track in less than 500 Ma.
<b>FIG. 6.</b>
FIG. 6.
Atmospheric nitrogen content after 4.5 Ga as a function of (a) mantle mixing rate and (b) ocean hydrothermal circulation rate for different values of αm in the high abiotic atmospheric fixation rate case. The parameter αm controls the partitioning between different volcanic degassing styles; see the text for more details.
<b>FIG. 7.</b>
FIG. 7.
(a) Atmospheric nitrogen content and (b) volcanic degassing rate as a function of mantle redox state αm after 4.5 Ga for the high abiotic atmospheric fixation rate case. The redox state controls the relative contribution of arc-like (high values, degassed as N2 to the atmosphere) to MORB-like (low values, degassed as NHx, which rains out instantaneously to the oceans) volcanic degassing. The vertical dashed line represents the value estimated for present-day Earth.
<b>FIG. 8.</b>
FIG. 8.
Atmospheric nitrogen content after 4.5 Ga as a function of erosion rate for different values of (a) continental accretion efficiency ε and (b) oceanic crust subduction timescale (parameter D from Table 3).
<b>FIG. B1.</b>
FIG. B1.
Nitrogen content as a function of time in the main model reservoirs for different average oceanic crust subduction rates. (a) Atmospheric N2, (b) lower mantle (NHx), oceanic NOx (c) and NHx (d). Dashed lines represent present-day values. For oceanic NOx and NHx these values are 10−2 and 3 × 10−4 mM, respectively, and therefore do not appear on the figures.
<b>FIG. B2.</b>
FIG. B2.
Nitrogen content as a function of time in the main model reservoirs for different ocean volume evolution scenarios (values are given in percent change since formation). (a) Atmospheric N2, (b) lower mantle (NHx), oceanic NOx (c) and NHx (d). Dashed lines represent present-day values. For oceanic NOx and NHx, these values are 10−2 and 3 × 10−4 mM, respectively, and therefore do not appear on the figures.
<b>FIG. B3.</b>
FIG. B3.
Nitrogen content as a function of time in the main model reservoirs. (a) Atmospheric N2, (b) lower mantle (NHx), oceanic NOx (c) and NHx (d). Dashed lines represent present-day values. For upper mantle and oceanic NHx, these values are 3.5 ppm and 3 × 10−4 mM, respectively, and therefore do not appear on the figures.
<b>FIG. B4.</b>
FIG. B4.
Nitrogen content as a function of time in the main model reservoirs. (a) Atmospheric N2, (b) lower mantle (NHx), oceanic NOx (c) and NHx (d). Dashed lines represent present-day values. For upper mantle and oceanic NHx, these values are 3.5 ppm and 3 × 10−4 mM, respectively, and therefore do not appear on the figures.

References

    1. Airapetian V., Glocer A., Gronoff G., Hébrard E., and Danchi W. (2016) Prebiotic chemistry and atmospheric warming of early Earth by an active young Sun. Nat Geosci 9:452–455
    1. Arculus R. and Delano J.W. (1980) Implications for the primitive atmosphere of the oxidation state of the Earth's upper mantle. Nature 288:72–74
    1. Barron E.J., Hay W.W., and Thompson S. (1989) The hydrologic cycle: a major variable during Earth history. Palaeogeogr Palaeoclimatol Palaeoecol 75:157–174
    1. Belousova E., Kostitsyn Y., Griffin W.L., Begg G.C., O'Reilly S.Y., and Pearson N.J. (2010) The growth of the continental crust: constraints from zircon Hf-isotope data. Lithos 119:457–466
    1. Bland W. and Rolls D. (1998) Weathering: An Introduction to the Scientific Principles, Arnold, London

Publication types

LinkOut - more resources