

Cox-nnet: An artificial neural network method for prognosis prediction of high-throughput omics data
- PMID: 29634719
- PMCID: PMC5909924
- DOI: 10.1371/journal.pcbi.1006076
Cox-nnet: An artificial neural network method for prognosis prediction of high-throughput omics data
Abstract
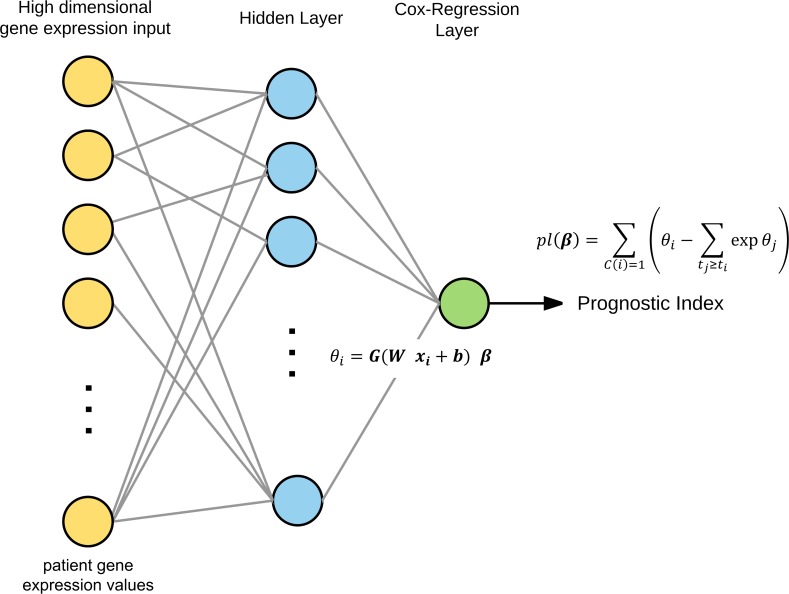
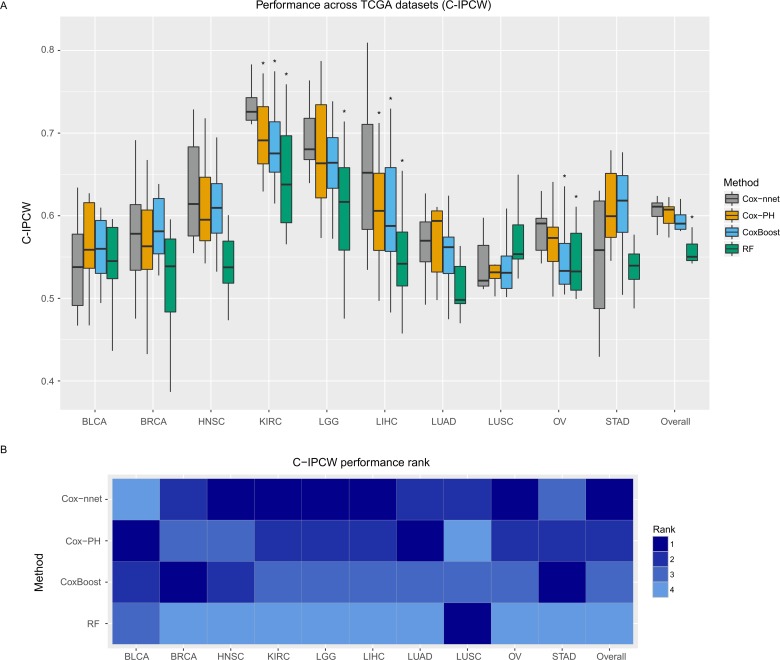
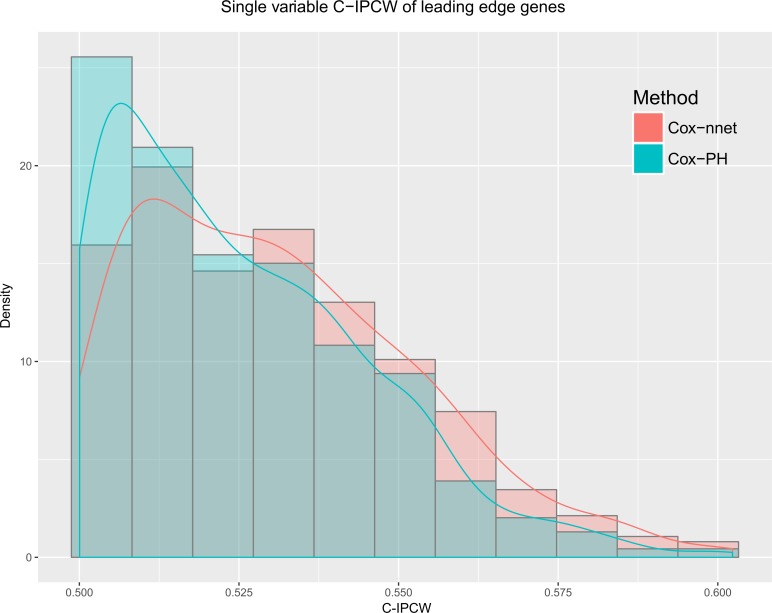
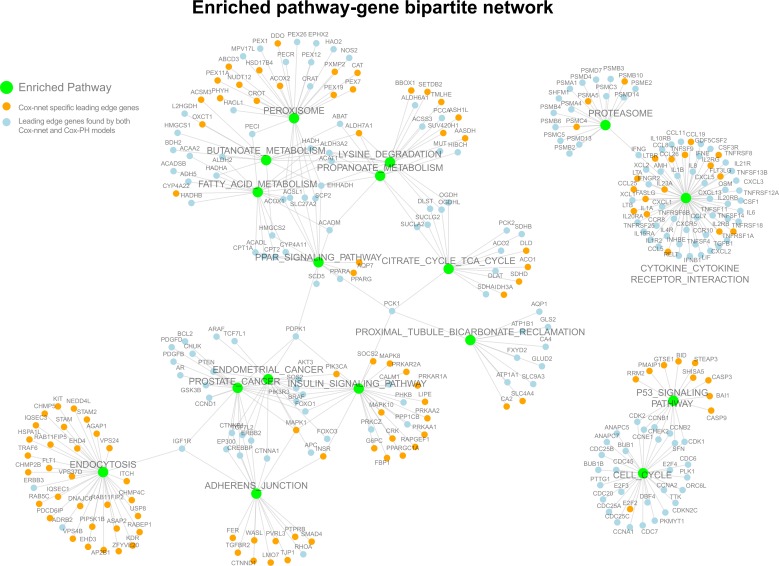
Artificial neural networks (ANN) are computing architectures with many interconnections of simple neural-inspired computing elements, and have been applied to biomedical fields such as imaging analysis and diagnosis. We have developed a new ANN framework called Cox-nnet to predict patient prognosis from high throughput transcriptomics data. In 10 TCGA RNA-Seq data sets, Cox-nnet achieves the same or better predictive accuracy compared to other methods, including Cox-proportional hazards regression (with LASSO, ridge, and mimimax concave penalty), Random Forests Survival and CoxBoost. Cox-nnet also reveals richer biological information, at both the pathway and gene levels. The outputs from the hidden layer node provide an alternative approach for survival-sensitive dimension reduction. In summary, we have developed a new method for accurate and efficient prognosis prediction on high throughput data, with functional biological insights. The source code is freely available at https://github.com/lanagarmire/cox-nnet.
Conflict of interest statement
The authors have declared that no competing interests exist.
Figures

References
-
- Therneau TM, Grambsch PM. Modeling survival data: extending the Cox model: Springer Science & Business Media; 2000.
-
- Breheny P, Huang J. Coordinate descent algorithms for nonconvex penalized regression, with applications to biological feature selection. The annals of applied statistics. 2011;5(1):232 doi: 10.1214/10-AOAS388 - DOI - PMC - PubMed
-
- Binder H. CoxBoost: Cox models by likelihood based boosting for a single survival endpoint or competing risks. R package version. 2013;1.
-
- Ishwaran H, Kogalur UB, Blackstone EH, Lauer MS. Random survival forests. The Annals of Applied Statistics. 2008:841–60.
-
- McCulloch WS, Pitts W. A logical calculus of the ideas immanent in nervous activity. The bulletin of mathematical biophysics. 1943;5(4):115–33. - PubMed
Publication types
MeSH terms
Grants and funding
LinkOut - more resources
Full Text Sources
Other Literature Sources
