. 2018 Apr 9;33(4):620-633.e6.
doi: 10.1016/j.ccell.2018.03.003.

Molecular Signatures of Regression of the Canine Transmissible Venereal Tumor

Affiliations

Molecular Signatures of Regression of the Canine Transmissible Venereal Tumor

Dan Frampton et al. Cancer Cell. .

Abstract

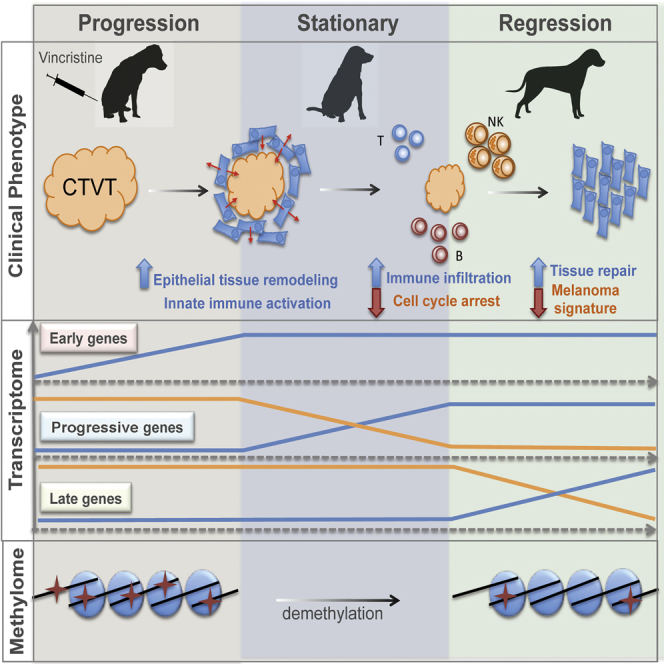
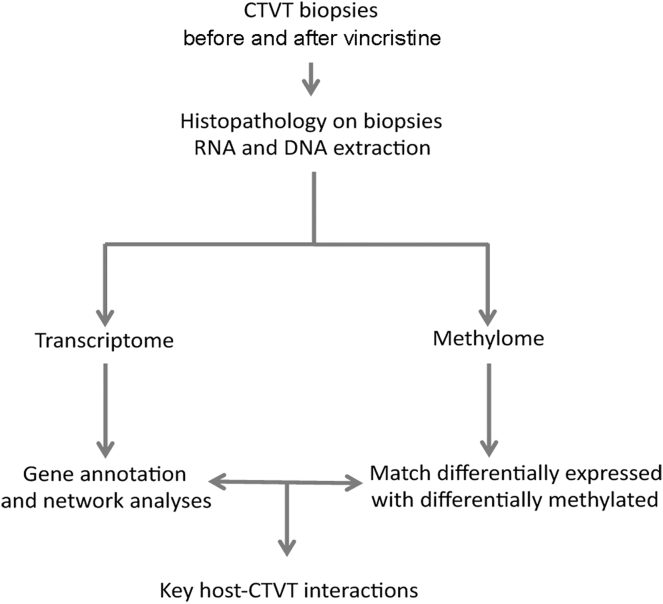
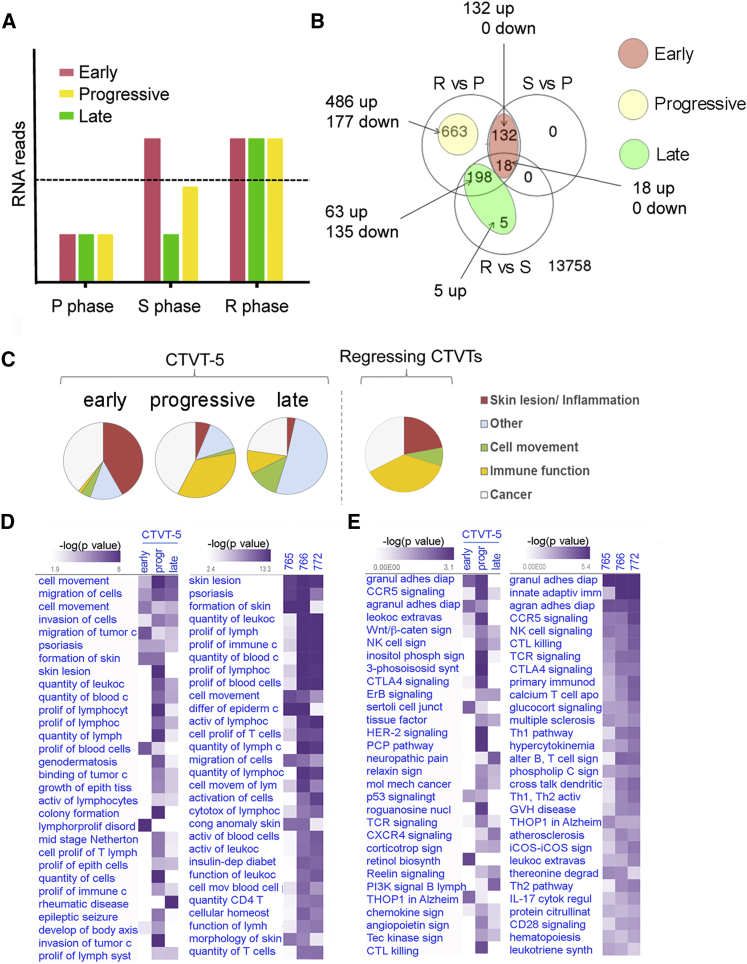
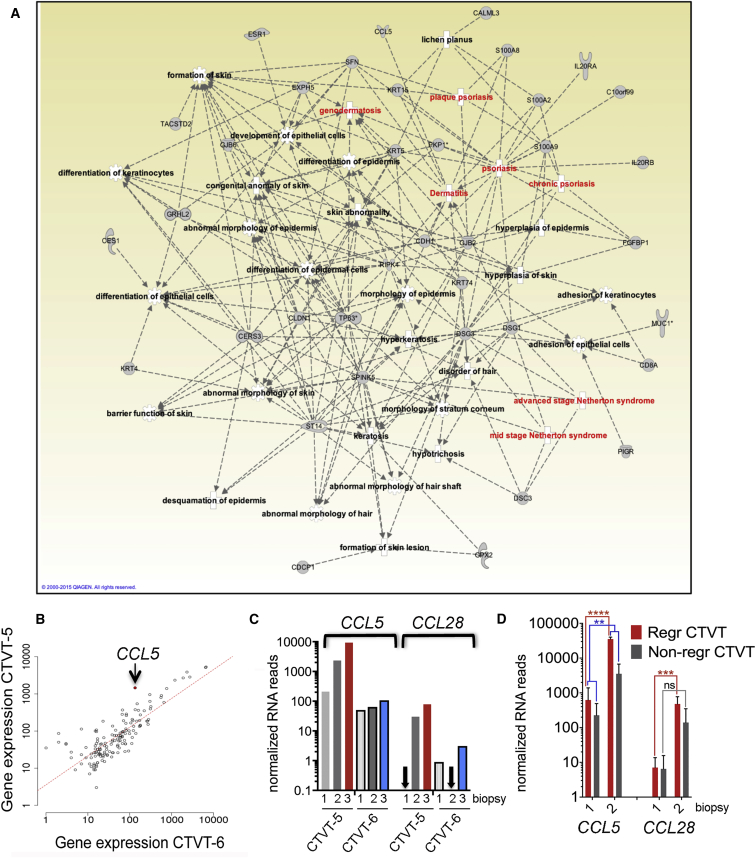
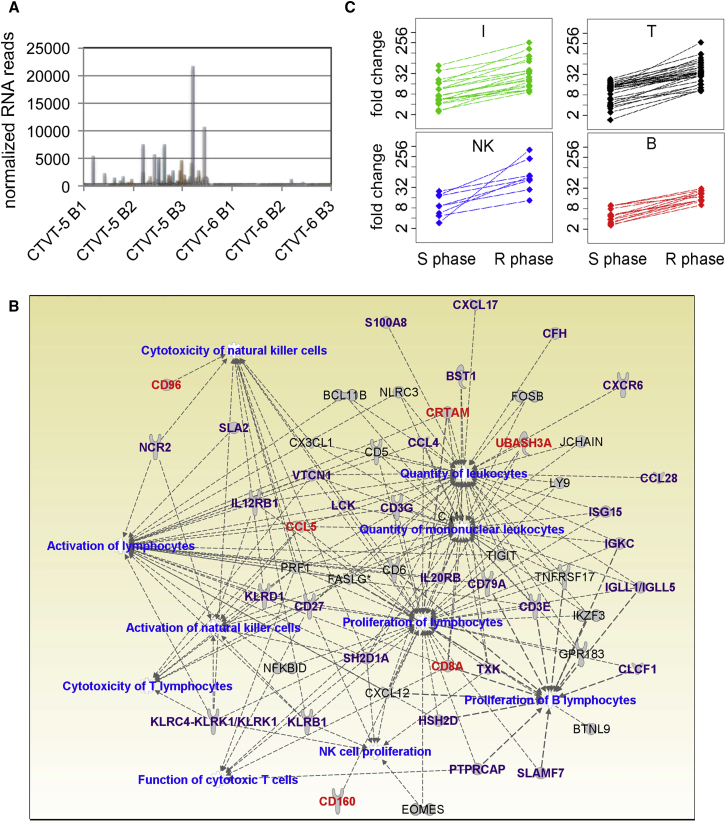
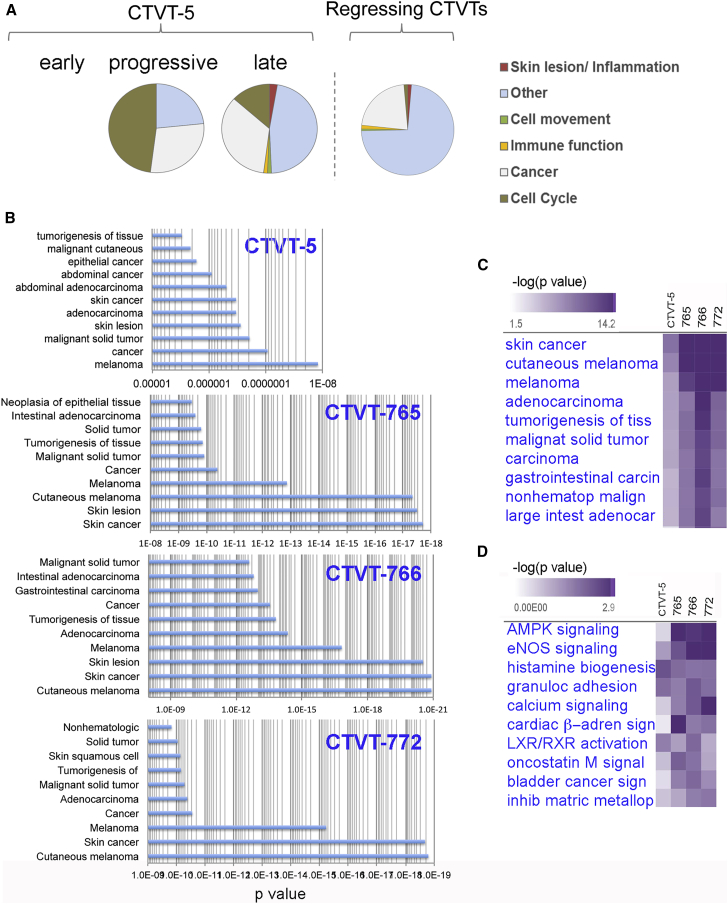
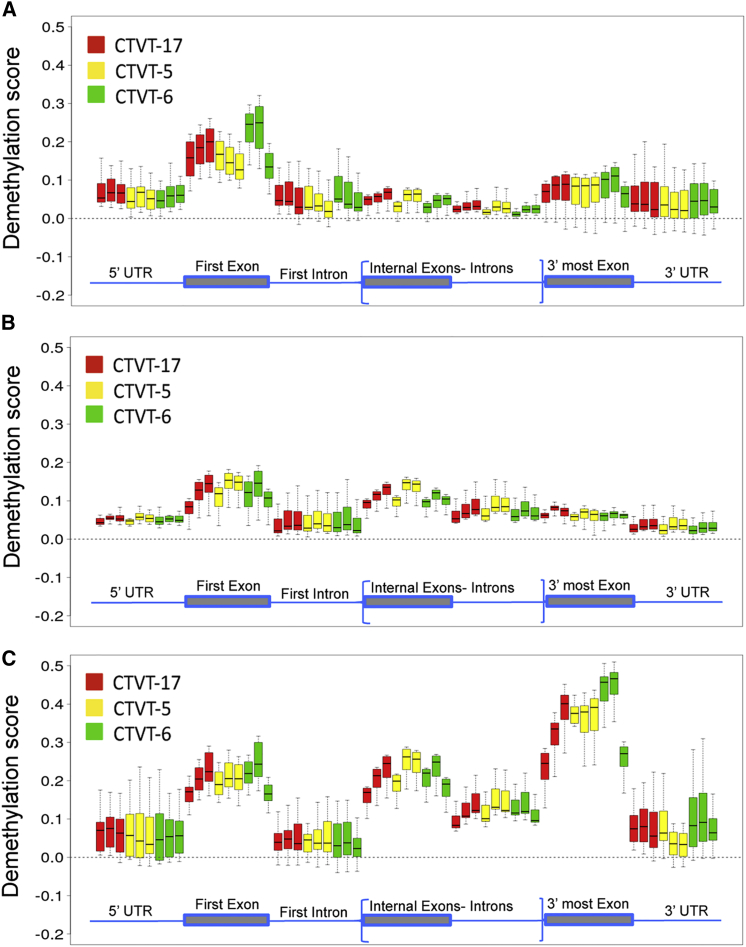
The canine transmissible venereal tumor (CTVT) is a clonally transmissible cancer that regresses spontaneously or after treatment with vincristine, but we know little about the regression mechanisms. We performed global transcriptional, methylation, and functional pathway analyses on serial biopsies of vincristine-treated CTVTs and found that regression occurs in sequential steps; activation of the innate immune system and host epithelial tissue remodeling followed by immune infiltration of the tumor, arrest in the cell cycle, and repair of tissue damage. We identified CCL5 as a possible driver of CTVT regression. Changes in gene expression are associated with methylation changes at specific intragenic sites. Our results underscore the critical role of host innate immunity in triggering cancer regression.

Keywords: CCL5; cancer; dog; epithelial; innate immunity; melanoma; methylation; regression; transmissible; vincristine.


Figures

None
Graphical abstract
Figure 1
Figure 1
Diagram of the Experimental Pipeline Used to Study CTVT Regression
Figure 2
Figure 2
Transcriptional Profiling Detects a Signature of CTVT Regression (A) Heatmap showing differential expression of the 1,016 significant genes (FC > 10 and adj-p < 0.01) relative to the geometric mean of CTVT-5 B1 and CTVT-6 B1 (mean of the logs). Genes are sorted by expression of B3/geometric mean of (CTVT-5 B1, CTVT-6 B1). B1, first biopsy; B2, second biopsy; B3, third biopsy. (B) qPCR on DNA extracted from biopsies obtained before (B1, day 0) and after (B2, day 28) vincristine administration of the 7xx CTVTs. Specific primers were used to amplify LINE-MYC DNA (tumor specific), DLA DQA-1 (tumor specific), and DLA DQA-1 (common to both host and tumor). All quantifications are relative to β-actin. (C) Heatmap showing differential expression of the 1,350 significant genes in the 7xx CTVTs (FC > 10 and adj-p < 0.01) relative to the geometric mean of the five B1 samples. Genes are sorted by expression of B2/geometric mean of 7xx B1s. Each row represents an individual gene. RNA-seq data were not available for CTVT-774 B1. The red lines next to each row indicate genes that reached statistical significance in the R-B2/R-B1 versus NR-B2/NR-B1 comparison. (D) Venn diagram showing the degree of overlap between CTVT-5 R versus P genes (1,016 genes), the 7xx CTVTs B2 versus B1 genes (1,350 genes) and genes that reached statistical significance in the R-B2/R-B1 versus NR-B2/NR-B1 comparison (189 genes). See also Figure S2 and Tables S1 and S2.
Figure 3
Figure 3
Dynamic Changes in Gene Expression across Sequential Biopsies Identify Pathological Processes during CTVT Regression (A) Schematic depiction of the changes in expression for the early, progressive, and late genes in the different CTVT phases. The dotted line indicates an expression FC > 10 relative to baseline values in the P phase. (B) Venn diagram illustrating the overlap between differentially expressed genes across all three comparisons. The diagram explains how differentially expressed genes were classified into three categories: early, late, and progressive. (C) Pie charts indicating the relative proportion of IPA gene networks within the early, progressive, and late upregulated gene groups of CTVT-5 and their relative proportion within the regressing 7xx CTVTs. (D and E) Heatmaps of comparative IPA analyses showing the top 30 diseases and biofunction pathways (ex cancer) (D) or canonical pathways (E) for B1, B2, and B3 of CTVT-5 and each individual regressive 7xx CTVTs. Pathways are clustered based on significance (−log10 p value, Fisher's exact test) and similarity. See also Table S3.
Figure 4
Figure 4
Early Upregulation of Epithelial and Inflammation-Related Genes Characterizes CTVT Regression (A) IPA diagram showing gene networks of early upregulated genes in CTVT-5. Inflammation-related nodes are highlighted in red. (B) Scatterplot illustrating correlation between normalized RNA-seq counts for early upregulated genes in CTVT-5 (B2) and CTVT-6 (B3). Best-fit line is shown in red. (C and D) Gene expression levels of CCL5 and CCL28 in CTVT-5 and CTVT-6 (C), and in the additional 7xx CTVT samples (D) (mean ± SEM, n = 3). Significant adj-p values are shown (∗∗∗∗p < 0.0001, ∗∗∗p < 0.001, ∗∗p < 0.01): all have FC > 10. See also Table S4.
Figure 5
Figure 5
Upregulation of T, NK, and B Cell-Related Genes Characterizes the Secondary Response to Vincristine (A) Expression changes in B1, B2, or B3 of 88 progressive immunological genes in CTVT-5 and CTVT-6. (B) Diagram showing 10 representative nodes obtained by IPA using the 88 progressive immunological genes upregulated in CTVT-5. Key nodes are shown in blue; key genes belonging to the core signature of regression are shown in red; progressive up genes in common between CTVT-5 and the regressive 7xx CTVTs are shown in purple. (C) The 88 immunological genes were annotated manually using Genecards and the available literature into four groups: I, inflammation/innate immunity; T, T cells; NK, natural killer cells; and B, B cells. Fold upregulation of genes in the S and R phase is relative to the P phase and is based on the normalized RNA-seq reads. See also Tables S4, S5, and S6.
Figure 6
Figure 6
Downregulated Genes Show a Melanoma-like Signature (A) Pie charts indicating the relative proportion of each functional IPA network within the progressive and late downregulated gene groups of CTVT-5 and within the downregulated gene groups of the regressing 7xx CTVTs. Note that no early downregulated gene was detected in CTVT-5. (B) Plots showing the confidence value of the main functionally annotated pathways identified by IPA for the late downregulated gene group in each regressing CTVT. The p value (Fisher's exact test) for each pathway is shown on the x axis. (C and D) Heatmaps of comparative IPA analyses showing the top 10 diseases and biofunction pathways (C) or canonical pathways (D) for each individual regressive CTVTs. Pathways are clustered based on significance (Fisher's exact test) and similarity. See also Tables S7 and S8; Figures S3 and S4.
Figure 7
Figure 7
Changes in Gene Expression Correlate with Specific Changes in DNA Methylation Demethylation profiles of early (A), progressive (B), and late (C) upregulated genes across serial biopsies of CTVT-17 (red), CTVT-5 (yellow), and CTVT-6 (green). Demethylation scores were obtained for individual genes by quantifying demethylation levels within specific regions of genes (≤2 kb upstream of first exon; first exon; first intron; internal exons; internal introns; last exon; ≤2 kb downstream of last exon) and normalized by subtracting the corresponding demethylation values observed for non-expressed genes. Boxplots illustrate the variation within these values across each gene-list (boxes extend to the first and third quartile, whiskers extend to 1.5× inter-quartile range, and the line represents median values). For each CTVT sample, boxplots are in order (from left to right): first, second and third biopsy. See also Figure S5.

Comment in

References

    1. Anders S., Huber W. Differential expression analysis for sequence count data. Genome Biol. 2010;11:R106. - PMC - PubMed
    1. Anders S., Pyl P.T., Huber W. HTSeq–a Python framework to work with high-throughput sequencing data. Bioinformatics. 2015;31:166–169. - PMC - PubMed
    1. Belov K. Contagious cancer: lessons from the devil and the dog. Bioessays. 2012;34:285–292. - PubMed
    1. Bird A.P. CpG-rich islands and the function of DNA methylation. Nature. 1986;321:209–213. - PubMed
    1. Blaine D.P. Fourth Edition. T. Boosey; 1810. A Domestic Treatise on the Diseases of Horses and Dogs.

Publication types

LinkOut - more resources