. 2019 Apr:160:73-82.
doi: 10.1016/j.nlm.2018.04.006. Epub 2018 Apr 7.

Sleep loss disrupts Arc expression in dentate gyrus neurons

Affiliations

Sleep loss disrupts Arc expression in dentate gyrus neurons

James E Delorme et al. Neurobiol Learn Mem. 2019 Apr.

Abstract

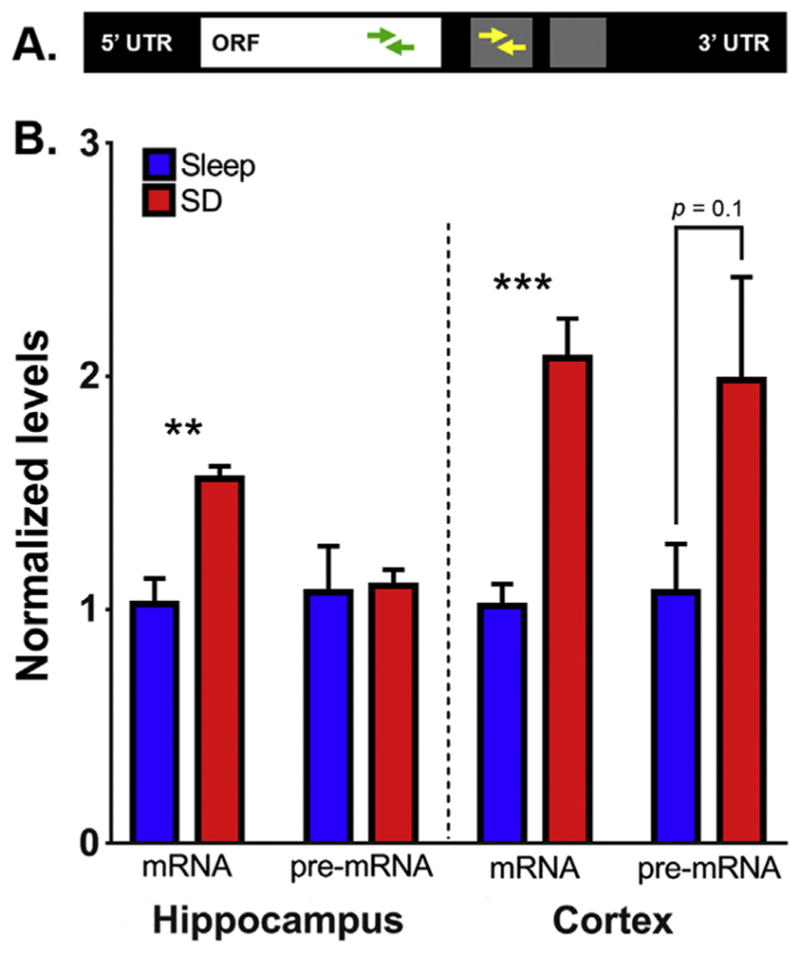
Sleep loss affects many aspects of cognition, and memory consolidation processes occurring in the hippocampus seem particularly vulnerable to sleep loss. The immediate-early gene Arc plays an essential role in both synaptic plasticity and memory formation, and its expression is altered by sleep. Here, using a variety of techniques, we have characterized the effects of brief (3-h) periods of sleep vs. sleep deprivation (SD) on the expression of Arc mRNA and Arc protein in the mouse hippocampus and cortex. By comparing the relative abundance of mature Arc mRNA with unspliced pre-mRNA, we see evidence that during SD, increases in Arc across the cortex, but not hippocampus, reflect de novo transcription. Arc increases in the hippocampus during SD are not accompanied by changes in pre-mRNA levels, suggesting that increases in mRNA stability, not transcription, drives this change. Using in situ hybridization (together with behavioral observation to quantify sleep amounts), we find that in the dorsal hippocampus, SD minimally affects Arc mRNA expression, and decreases the number of dentate gyrus (DG) granule cells expressing Arc. This is in contrast to neighboring cortical areas, which show large increases in neuronal Arc expression after SD. Using immunohistochemistry, we find that Arc protein expression is also differentially affected in the cortex and DG with SD - while larger numbers of cortical neurons are Arc+, fewer DG granule cells are Arc+, relative to the same regions in sleeping mice. These data suggest that with regard to expression of plasticity-regulating genes, sleep (and SD) can have differential effects in hippocampal and cortical areas. This may provide a clue regarding the susceptibility of performance on hippocampus-dependent tasks to deficits following even brief periods of sleep loss.

Keywords: In situ hybridization; Sleep deprivation; Synaptic plasticity; Transcription; Translation; pre-mRNA.


Conflict of interest statement

Conflict of interest

The authors declare no conflict of interest.

Figures

Fig. 1
Fig. 1
Expression of mature and pre-mRNA Arc transcripts in hippocampus and cerebral cortex of sleep deprived animals. (A) Arc transcript structure and quantitative polymerase chain reaction (qPCR) primer design. To quantify de novo Arc transcription, Arc primers were designed to target either the transcript’s open reading frame (green) or the first intron on its 3′ UTR (yellow). These primer sets were aimed at amplifying mature and pre-mRNA, respectively. (B) Expression of Arc mRNA and pre-mRNA in samples of whole hippocampus or whole cerebral cortex, normalized to expression of gamma actin (Actg1). Gene expression data in samples taken from mice after 3 h of ad lib sleep (Sleep) and sleep deprivation (SD) were normalized as a fold change relative to mean values from the Sleep group. Values indicate mean ± SEM; n = 5 mice/group; ** indicate p < 0.01, *** indicate p < .001, Student’s t-test. (For interpretation of the references to color in this figure legend, the reader is referred to the web version of this article.)
Fig. 2
Fig. 2
Total sleep time in mice allowed ad lib sleep from ZT0-3. Amount of time during which Sleep mice were observed to be inactive and in stereotyped sleep posture across the 3-h ad lib sleep period. Values are expressed as a percentage of total time, in 30-min intervals. Data are shown for mice used for in situ hybridization studies in (A) and for mice used for immunohistochemistry studies in (B).
Fig. 3
Fig. 3
Validation of Arc mRNA probes for RNAscope fluorescence in situ hybridization. (A) RNAscope in situ hybridization of mouse dentate gyrus (DG) section. Violet color represents Arc mRNA probe hybridization. (B) Positive control probes for in situ hybridization, targeting mRNA for the ubiquitously-expressed housekeeping gene Hprt1; images show representative signal in DG, CA1, and CA3. (C) Negative control probes targeting mRNA for DapB, a gene expressed in Bacillus subtilis, shown in the same regions. Scale bars indicate 100 μm. (For interpretation of the references to color in this figure legend, the reader is referred to the web version of this article.)
Fig. 4
Fig. 4
Mean fluorescence intensity values for in situ hybridization data for Arc mRNA in dorsal hippocampus and cortex. (A) Strategy for measuring mean fluorescence intensity in pyramidal cell and dendritic (Den) layers in dorsal hippocampal subregions. Selection of granule cell layer of the dentate gyrus and pyramidal cell layer of CA1/CA3 are shown in blue. Estimated dendritic regions adjacent to cell layers are shown in green. For Arc cellular quantification in the DG, an automated protocol (see Methods) detected Arc+ cells in the DG (yellow) and counted the number of Arc+ cells/mm2 within the granule cell layer (blue). (B) Mean fluorescence values did not significantly differ between Sleep (n = 6 mice) and SD (n = 5 mice) conditions in any area. Scale bars indicate 100 μm. (For interpretation of the references to color in this figure legend, the reader is referred to the web version of this article.)
Fig. 5
Fig. 5
Sleep deprivation simultaneously decreases Arc+ cells in the DG, and increases Arc+ cells in the cortex. (A) Representative images showing Arc+ cells in the DG following 3 h of ad lib Sleep (n = 6 mice) or SD (n = 5 mice). Scale bars indicate 100 μm. (B) The number of Arc+ cells/mm2 was reduced in the DG of mice following SD mice relative to mice allowed ad lib Sleep. Values indicate means ± SEM for each condition; *** indicates p < 0.001, Student’s t-test. (C) Pearson correlation coefficients for Arc+ cells/mm2 in DG vs. sleep time integrated over various intervals prior to sacrifice, based on sleep amounts from individual mice in the Sleep condition. (D) Representative images from Sleep and SD mice, showing Arc+ cells in primary somatosensory cortex overlying dorsal hippocampus. Scale bars indicate 100 μm. (E) The number of Arc+ cells/mm2 in the cortex was increased after SD. *** indicates p < 0.001, Student’s t-test. (F) Pearson correlation coefficients for cortical Arc+ cells/mm2 vs. total sleep time, integrated over various intervals prior to sacrifice. Negative relationships between sleep time and Arc+ cell numbers were present over the final 45-min of the experiment (* indicates p < 0.05 after Bonferroni correction).
Fig. 6
Fig. 6
Sleep deprivation does not significantly alter Arc protein levels in hippocampal areas CA3 or CA1. (A) Strategy for measuring mean fluorescence intensity in pyramidal cell and dendritic (Den) layers in dorsal hippocampal subregions. Selection of the pyramidal cell layer in CA1/CA3 are shown in blue. Estimated dendritic regions adjacent to cell layers are shown in green. (B) Mean fluorescence values did not significantly differ between Sleep (n = 5 mice) and SD (n = 5 mice) conditions in any area. Scale bars indicate 100 μm. (For interpretation of the references to color in this figure legend, the reader is referred to the web version of this article.)
Fig. 7
Fig. 7
Sleep deprivation simultaneously decreases Arc protein levels among DG cells, and increases Arc expression among cortical cells. (A) Representative images of immunohistochemical staining for Arc in dorsal and intermediate DG following 3 h of ad lib Sleep (n = 5 mice) or SD (n = 5 mice). (B) Arc+ cells/mm were decreased in both dorsal and intermediate DG. Data indicate mean ± SEM for each condition; * indicates p < 0.05, *** indicates p < 0.001, Student’s t-test. C. Pearson correlation coefficients for cortical Arc+ cells/mm in dorsal (black bars) and intermediate (green bars) DG vs. sleep time integrated over various intervals prior to sacrifice. (D) Representative images from Sleep and SD mice, showing Arc+ cells in primary somatosensory cortex overlying dorsal hippocampus. Scale bar indicates 100 μm. E. The number of Arc+ cells/mm2 in the cortex was increased after SD. * indicates p < 0.05, Student’s t-test. (F) Pearson correlation coefficients for cortical Arc+ cells/mm2 vs. sleep time integrated over various intervals prior to sacrifice. Negative relationships between total sleep time and Arc+ cell numbers were present over the final hour of the experiment. (For interpretation of the references to color in this figure legend, the reader is referred to the web version of this article.)
Fig. 7
Fig. 7
Sleep deprivation simultaneously decreases Arc protein levels among DG cells, and increases Arc expression among cortical cells. (A) Representative images of immunohistochemical staining for Arc in dorsal and intermediate DG following 3 h of ad lib Sleep (n = 5 mice) or SD (n = 5 mice). (B) Arc+ cells/mm were decreased in both dorsal and intermediate DG. Data indicate mean ± SEM for each condition; * indicates p < 0.05, *** indicates p < 0.001, Student’s t-test. C. Pearson correlation coefficients for cortical Arc+ cells/mm in dorsal (black bars) and intermediate (green bars) DG vs. sleep time integrated over various intervals prior to sacrifice. (D) Representative images from Sleep and SD mice, showing Arc+ cells in primary somatosensory cortex overlying dorsal hippocampus. Scale bar indicates 100 μm. E. The number of Arc+ cells/mm2 in the cortex was increased after SD. * indicates p < 0.05, Student’s t-test. (F) Pearson correlation coefficients for cortical Arc+ cells/mm2 vs. sleep time integrated over various intervals prior to sacrifice. Negative relationships between total sleep time and Arc+ cell numbers were present over the final hour of the experiment. (For interpretation of the references to color in this figure legend, the reader is referred to the web version of this article.)

References

    1. Acosta-Pena E, Camacho-Abrego I, Megarejo-Gutierrez M, Flores G, Drucker-Colin R, Garcia-Garcia F. Sleep deprivation induces differential morphological changes in the hippocampus and prefrontal cortex in young and old rats. Synapse. 2015;69:15–25. - PubMed
    1. Aton SJ, Broussard C, Dumoulin M, Seibt J, Watson A, Coleman T, Frank MG. Visual experience and subsequent sleep induce sequential plastic changes in putative inhibitory and excitatory cortical neurons. Proceedings of the National Academy of Sciences. 2013;110:3101–3106. - PMC - PubMed
    1. Aton SJ, Seibt J, Dumoulin M, Jha SK, Steinmetz N, Coleman T, … Frank MG. Mechanisms of sleep-dependent consolidation of cortical plasticity. Neuron. 2009;61:454–466. - PMC - PubMed
    1. Aton SJ, Suresh A, Broussard C, Frank MG. Sleep promotes cortical response potentiation following visual experience. Sleep. 2014;37:1163–1170. - PMC - PubMed
    1. Bernier BE, Lacagnina AF, Ayoub A, Shue F, Zemelman BV, Krasne FB, Drew MR. Dentate gyrus contributes to retrieval as well as encoding: evidence from context fear conditioning, recall, and extinction. Journal of Neuroscience. 2017;37:6359–6371. - PMC - PubMed

Publication types

Substances