. 2018 Apr 1;7(4):giy027.
doi: 10.1093/gigascience/giy027.

Whole-genome resequencing reveals signatures of selection and timing of duck domestication

Affiliations

Whole-genome resequencing reveals signatures of selection and timing of duck domestication

Zebin Zhang et al. Gigascience. .

Abstract

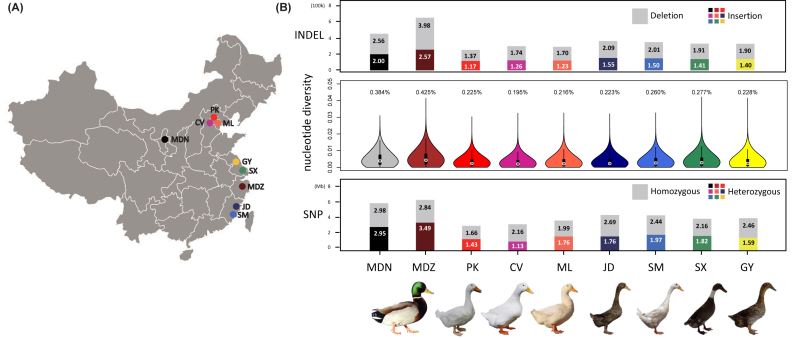
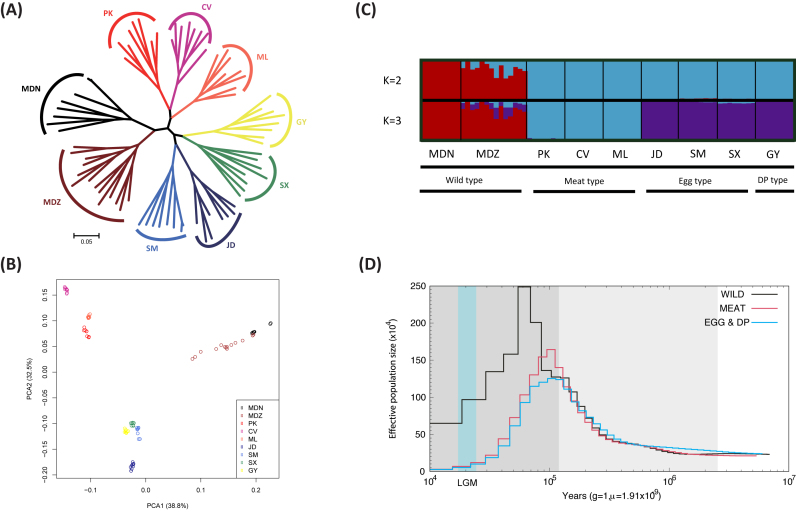
Background: The genetic basis of animal domestication remains poorly understood, and systems with substantial phenotypic differences between wild and domestic populations are useful for elucidating the genetic basis of adaptation to new environments as well as the genetic basis of rapid phenotypic change. Here, we sequenced the whole genome of 78 individual ducks, from two wild and seven domesticated populations, with an average sequencing depth of 6.42X per individual.

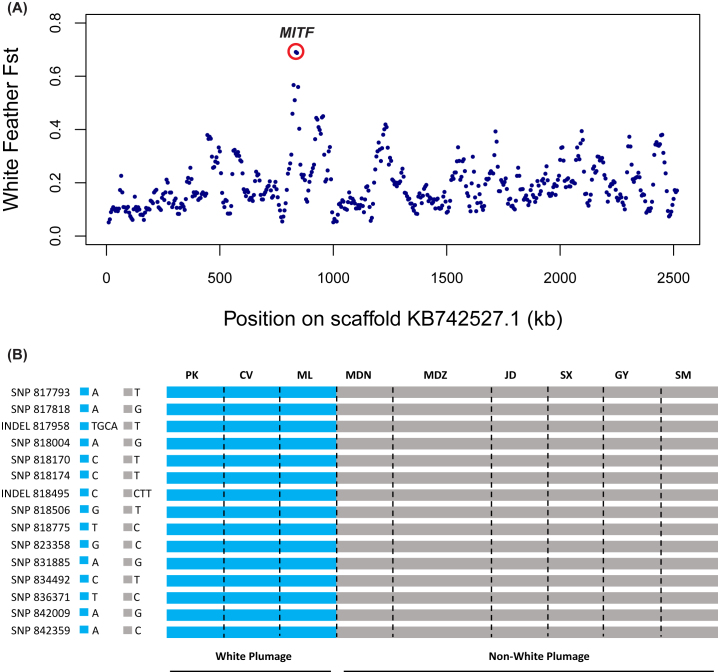
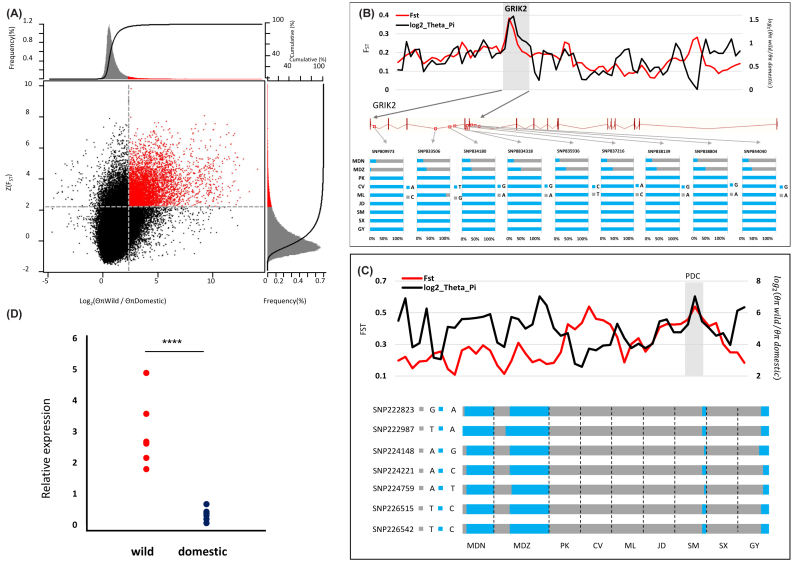
Results: Our population and demographic analyses indicate a complex history of domestication, with early selection for separate meat and egg lineages. Genomic comparison of wild to domesticated populations suggests that genes that affect brain and neuronal development have undergone strong positive selection during domestication. Our FST analysis also indicates that the duck white plumage is the result of selection at the melanogenesis-associated transcription factor locus.

Conclusions: Our results advance the understanding of animal domestication and selection for complex phenotypic traits.


Figures

Figure 1:
Figure 1:
Experimental design and variants statistics. A)null Sampling sites in this study. A total of 78 ducks from two wild populations (mallard Ningxia [MDN] n = 8; mallard Zhejiang [MDZ] n = 14), three meat breeds (Pekin [PK] n = 8; Cherry Valley [CV] n = 8; maple leaf [ML] n = 8), three egg breeds (Jin Ding [JD] n = 8; Shan Ma [SM] n = 8; Shao Xing [SX] n = 8), and one dual-purpose breed (Gao You [GY] n = 8) were selected. B) Genomic variation of nine populations. Mean number of SNPs and heterozygous and homozygous SNP ratio in the nine populations are shown at the bottom. Nucleotide diversity ratios of the nine populations are shown at the middle. The nucleotide diversity ratios in wild mallards are dramatically higher than ratios in domesticated ducks. Number of insertions and deletions in the nine populations are shown at the top. The number of deletions was higher than the number of insertions in all nine populations.
Figure 2:
Figure 2:
Population genetic structure and demographic history of nine duck populations. A) Neighbor-joining phylogenetic tree of nine duck populations. The scale bar is proportional to genetic differentiation (p distance). B) PCA plot of duck populations. Eigenvector 1 and 2 explained 38.8% and 32.5% of the observed variance, respectively. C) Population genetic structure of 78 ducks. The length of each colored segment represents the proportion of the individual genome inferred from ancestral populations (K = 2–3). The population names and production type are at the bottom. DP type means dual-purpose type. D) Demographic history of duck populations. Examples of PSMC estimate changes in the effective population size over time, representing variation in inferred Ne dynamics. The lines represent inferred population sizes and the gray shaded areas indicate the Pleistocene period, with Last Glacial Period (LGP) shown in darker gray, and Last Glacial Maximum (LGM) shown in light blue areas.
Figure 3:
Figure 3:
MITF shows different genetic signatures between white-plumage and non-white-plumage ducks. A) FST plot around the MITF locus. The FST value of MITF is highest for scaffold KB742527.1, circled in red. Each plot represent a 10-kb window. B) The 13 homozygous SNPs and 2 homozygous INDELs were identified in white-plumage ducks and absent in non-white-plumage ducks. SNPs and INDELs were named according to their position on the scaffold.
Figure 4:
Figure 4:
Genomic regions with strong selective sweep signals in wild population ducks and domesticated population ducks. A) Distribution of θπ ratios θπ (wild/domesticated) and Z(FST) values, which are calculated by 10-kbwindows with 5-kbsteps. Only scaffolds >10 kbwere used for our calculation, as FST results calculated on a small scaffold are unlikely to be accurate. Red data points located to the top-right regions correspond to the 5% right tails of empirical log2 (θπ wild/θπ domestic) ratio distribution, and the top 5% empirical Z(FST) distribution are genomic regions under selection during duck domestication. The two horizontal and vertical gray lines represent the top 5% value of Z(FST) (2.216) and log2 (θπ wild/θπ domestic) (2.375), respectively. B) The log2 (θπ) ratios and FST values around the GRIK2 locus and allele frequencies of nine SNPs within the GRIK2 gene across nine duck populations. The black and red lines represent log2 (θπ wild/θπ domestic) ratios and FST values, respectively. The gray bar shows the region under strong selection in GRIK2 gene. The nine red rectangular frames correspond to the locus on gene of nine SNPs. The SNPs were named according to their position on the scaffold. C) The PDC gene showed a different genetic signature in domesticated and wild ducks. The log2 (θπ) ratios and FST values around the PDC locus. The PDC gene region is shown in gray. Allele frequencies of seven SNPs within the PDC gene across nine duck populations. The SNPs are named according to their scaffold position. D) The PDC gene expression level differs between domesticated and wild ducks. PDC mRNA expression levels in brain of wild (MDN, n = 3; MDZ, n = 4) and domesticated (PK, n = 1; CV, n = 1; ML, n = 1; JD, n = 1; SM, n = 1; SX, n = 1; GY, n = 1) ducks. ****P value from t test (P < 0.0001).

References

    1. Li J, Zhang Y. Advances in research of the origin and domestication of domestic animals. Biodiversity Sci. 2009;17(4):319–29.
    1. Darwin C, Mayr E. On the origin of species by means of natural selection, or the preservation of favoured races in the struggle for life. John Murray: london: Harvard University Press; 1859.
    1. Chen C, Liu Z, Pan Q, et al. . Genomic analyses reveal demographic history and temperate adaptation of the newly discovered honey bee subspecies Apis mellifera sinisxinyuann. ssp. Mol Biol Evol. 2016;33(5):1337–48. - PMC - PubMed
    1. Yang J, Li WR, Lv FH, et al. . Whole-genome sequencing of native sheep provides insights into rapid adaptations to extreme environments. Mol Biol Evol. 2016;33(10):2576–92. - PMC - PubMed
    1. Li M, Tian S, Jin L, et al. . Genomic analyses identify distinct patterns of selection in domesticated pigs and Tibetan wild boars. Nat Genet. 2013;45(12):1431–8. - PubMed

Publication types

LinkOut - more resources