. 2018 Sep 1;33(9):1514-1525.
doi: 10.1093/ndt/gfy057.

Inverse correlation between vascular endothelial growth factor back-filtration and capillary filtration pressures

Affiliations

Inverse correlation between vascular endothelial growth factor back-filtration and capillary filtration pressures

Christoph Kuppe et al. Nephrol Dial Transplant. .

Abstract

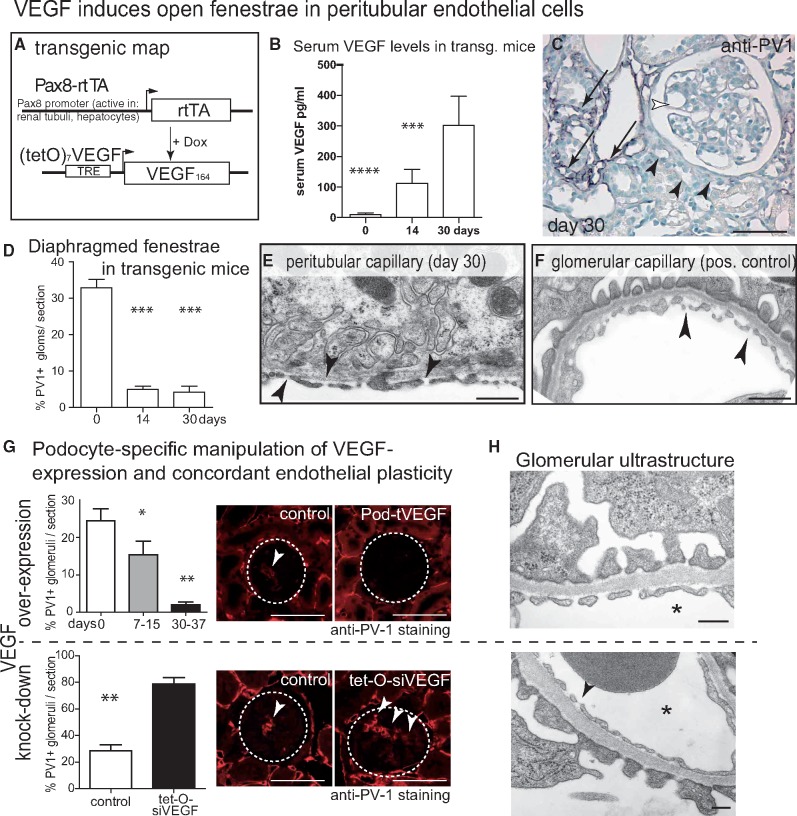
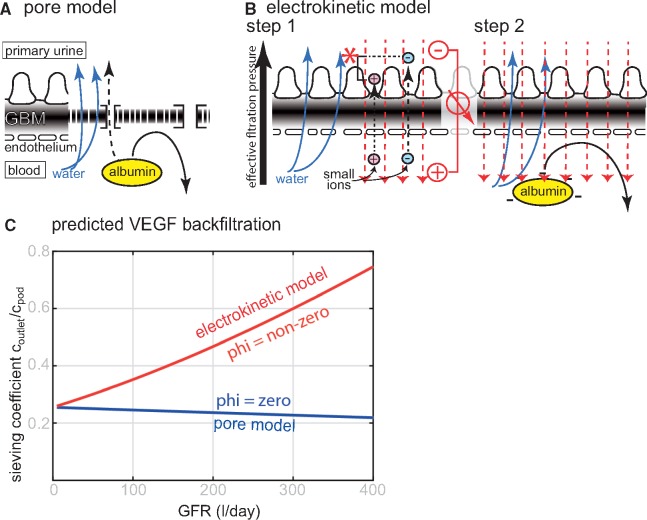
Background: Vascular endothelial growth factor A (VEGF) is an essential growth factor during glomerular development and postnatal homeostasis. VEGF is secreted in high amounts by podocytes into the primary urine, back-filtered across the glomerular capillary wall to act on endothelial cells. So far it has been assumed that VEGF back-filtration is driven at a constant rate exclusively by diffusion.

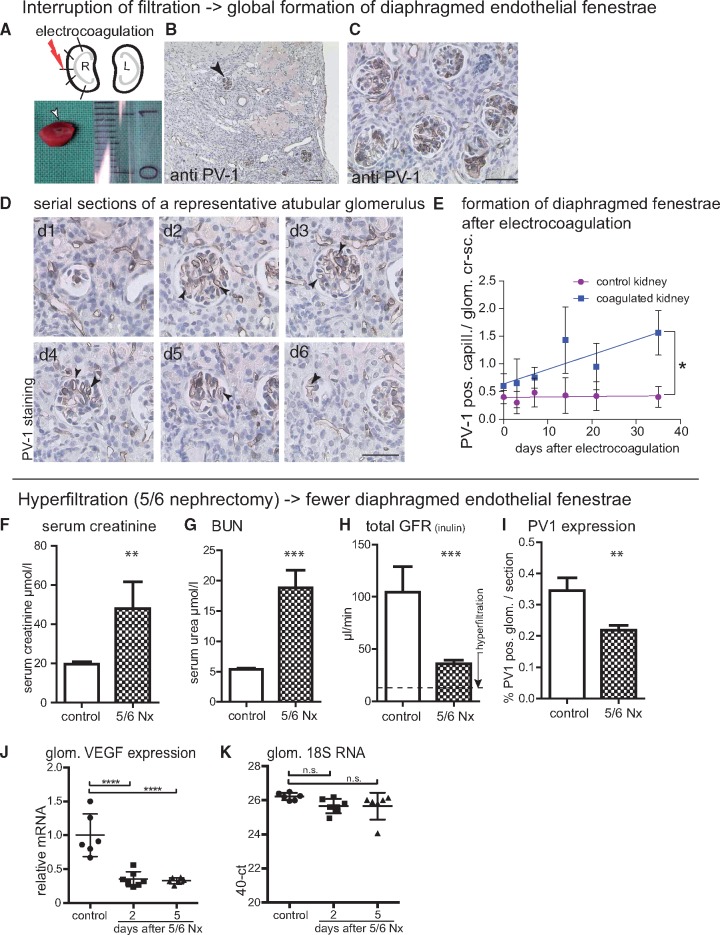
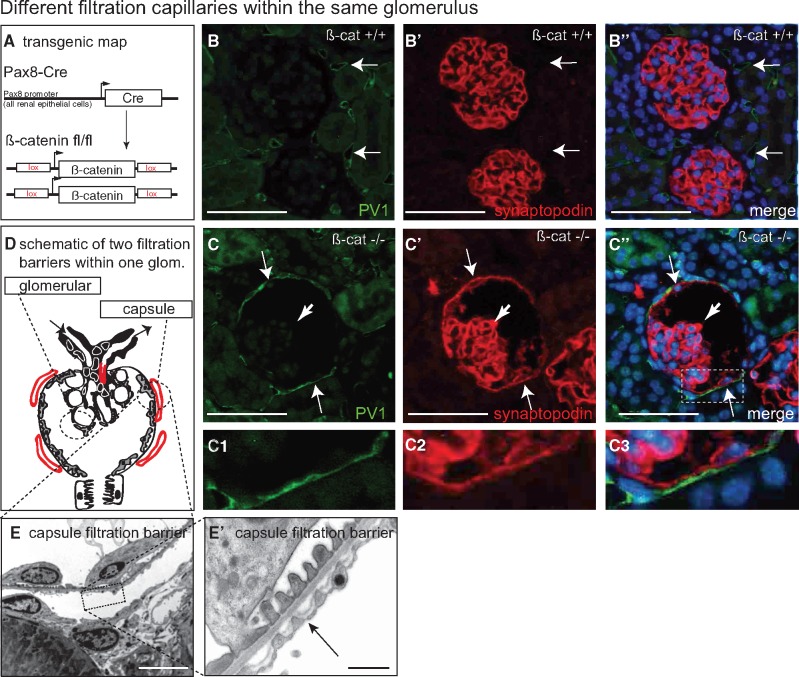
Methods: In the present work, glomerular VEGF back-filtration was investigated in vivo using a novel extended model based on endothelial fenestrations as surrogate marker for local VEGF concentrations. Single nephron glomerular filtration rate (SNGFR) and/or local filtration flux were manipulated by partial renal mass ablation, tubular ablation, and in transgenic mouse models of systemic or podocytic VEGF overexpression or reduction.

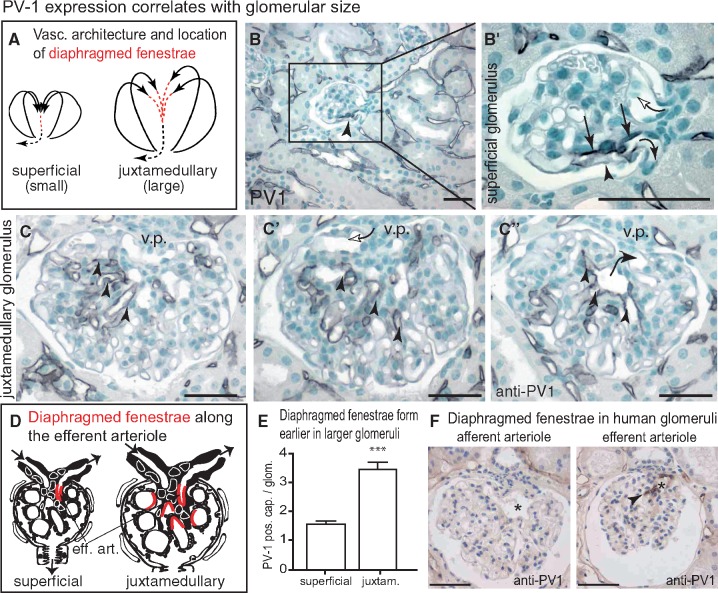
Results: Our study shows positive correlations between VEGF back-filtration and SNGFR as well as effective filtration rate under physiological conditions along individual glomerular capillaries in rodents and humans.

Conclusion: Our results suggest that an additional force drives VEGF back-filtration, potentially regulated by SNGFR.


Figures

FIGURE 1
FIGURE 1
VEGF induces open fenestrae in peritubular endothelial cells. (A) Transgenic map of systemic inducible VEGF overexpression in Pax8-rtTA-VEGF164 mice. (B) Serum VEGF levels in Pax8-rtTA-VEGF164 mice. (C) Immunostaining for diaphragmed fenestrae (PV-1) in VEGF-overexpressing transgenic mice showed partial preservation (arrows) or absence of diaphragmed endothelia within the tubulo-interstitium (black arrowheads). Within the glomeruli, hypertrophy and complete absence of PV-1 staining was noted (white arrowhead). (D) On random glomerular cross-sections, the fraction of glomeruli with PV-1-positive (i.e. diaphragmed) endothelial fenestrations was reduced significantly after induction of VEGF overexpression (50 glomeruli from 7 different animals per time point, one-way ANOVA, Bonferroni post hoc test; ***P < 0.001). (E–F) On TEM, tubular endothelial cells formed open fenestrae in VEGF-overexpressing mice (arrowheads). Manipulating VEGF expression in podocytes results in concordant changes of endothelial morphology. (G) VEGF overexpression in podocytes of transgenic Pod-rtTA/(TetO)7-VEGF164 abolished formation of diaphragmed fenestrae in endothelial cells (n = 5 per time point). In the opposite experiment, partial knock-down of endogenous VEGF in inducible Pod-rtTA/(TetO)7-siVEGF mice after 7 days [16], showed significant upregulation of diaphragmed fenestrae. Semi-quantitative evaluation of diaphragmed endothelia was performed by immunostainings for PV-1-positive glomeruli (50 glomeruli per mouse, n = 4 per time point, one-way ANOVA, Bonferroni post hoc test, *P < 0.05; **P < 0.01; ***P < 0.001; ****P < 0.0001), dashed circles mark representative glomeruli; arrows, PV-1 staining). (H) TEM showed no signs of endotheliosis in both transgenic mouse models (arrowheads; asterisks mark capillary lumen). Scale bars 50 µm for light microscopy, 0.5 µm for TEM.
FIGURE 2
FIGURE 2
SNGFR and endothelial fenestrations. (AC) Interruption of filtration-induced formation of diaphragmed fenestrae. The cortex of the right kidney was subjected to five electrocoagulations resulting in focal disruption of tubuli and tubulo-interstitial fibrosis. Arrow head, PV-1-positive glomerular cross-section. (D) Atubular glomeruli (verified by serial sectioning) are perfused but can no longer filter, and show global de novo expression of PV-1 (dark staining, arrow heads). (E) Formation of diaphragmed fenestrae (i.e. PV-1-positive capillary cross-sections per glomerular cross-sections) occurred over a period of 35 days (n = 2 mice per time point; slopes significantly different in a linear regression analysis, *P = 0.0197). Scale bars in (D), 50 μm; in (B, C) 100 μm. (FK) To induce hyperfiltration, subtotal nephrectomy (5/6 Nx) was performed in Bl6 mice. (F–H) Serum creatinine and BUN measurements showed increase after 5/6 Nx. Kidneys were analysed after 5 days (n = 7). FITC-inulin clearance decreased from 104 ± 24 µL/min in controls to 36 ± 4 µL/min (***P = 0.012) in the 5/6 Nx animals, confirming induction of hyperfiltration. (I) PV-1-positive capillary cross-sections were decreased significantly in the remnant kidneys compared to controls (Student’s t-test; **P < 0.01). (G, J, K) Total VEGF mRNA expression was down regulated in isolated glomeruli 2 and 5 days after 5/6 nephrectomy (5/6 Nx) as shown by semi-quantitative rtPCR (****P < 0.001). BUN: blood urea nitrogen.
FIGURE 3
FIGURE 3
Glomerular and parietal filtration barrier within the same glomerulus. (A) Transgenic map of experimental animals. (B) In control mice, PV-1-positive can be detected in peritubular capillaries (arrows). No podocyte marker can be detected on Bowman’s capsule. (C–C’’) In beta-catenin knock-out mice [17], the Bowman’s capsule is lined by parietal podocytes as shown by synaptopodin co-staining (arrows in C’). The glomerulus filters primary filtrate into a morphologically normal tubular system [17]. (C1–C3) In beta-catenin knock-out mice, parietal podocytes are fully differentiated (synaptopodin-positive cells, arrows), recruit peritubular capillaries and form a morphologically normal filtration barrier (higher magnification in panels B–B”) (scale bars 75 µm). In the TEM in C–C’ the arrows indicate fenestrae of endothelial cells with diaphragms. Endothelial cells within periglomerular capillaries formed fenestrae with diaphragms (panels C–C’’, arrow, C1–3, E–E’) (n = 5 per group). Scale bars 2 µm in E, 0, 5 µm in E’.
FIGURE 4
FIGURE 4
Capillary microvasculature of the glomerulus. (A) The afferent arteriole branches immediately into multiple paralell filtering capillaries [31]. The location of endothelial cells with diaphragmed fenestrae is marked in red, continuous endothelial cells are marked as black dotted line. (B, B’) In superficial glomeruli, endothelial cells with diaphragmed fenestrae localized exclusively towards the efferent arteriole (arrows, anti-PV-1 staining in serial sections of 10 healthy mice; arrowhead shows slightly reduced PV-1 staining towards the outer filtering aspect compared with the inner aspect of the efferent arteriole, which is predicted to filter less due to mesangial cells). The glomerular vas afferens can be identified because it branches immediately into multiple capillaries and it was always negative for PV-1 (white arrow; afferent and efferent arterioles are marked). (C–C’’) When analysing the larger juxtamedullary glomeruli on serial sections, more intraglomerular capillary cross-sections formed diaphragmed PV-1-positive fenestrae. Positive cross-sections occurred earlier within the tributaries of the efferent arteriole (arrow in C’’) and were often located already within the capillary tuft (arrowheads). v.p., vascular pole. (D) Schematic of the microanatomical location of diaphragmed fenestrae (in red) within the smaller superficial and larger juxtamedullary glomeruli. (E) Statistical analysis of the frequency of PV-1-positive capillary cross-sections per random glomerular cross-section in superficial versus juxtamedullary cross-sections (50 superficial or juxtamedullary glomeruli from 6 female Sv129 mice, respectively; Student’s t-test, *** P < 0.001). (F) In normal human kidney, no PV-1 expression was detected in the vas afferens (asterisk). In contrast, the vas efferens stained positive (arrow head), confirming our findings in rodents. Scale bars 50 µm.
FIGURE 5
FIGURE 5
Predicted mechanisms driving VEGF back-filtration in the pore model or electrokinetic model. (A) In the pore model, the glomerular filter is regarded as impermeable membrane perforated by small and large pores with defined diameter. (B) In the electrokinetic model, a streaming potential (red) is generated by forced filtration of the small ions (Step 1). First, forced filtration of the small ionic molecules (water; blue arrows, and small ions, i.e. salts; dashed black arrows) across the charged filter generates an electrical field, called streaming potential (red). It is generated because the small positively charged cations (e.g. sodium, potassium; red ions) pass the filter slightly slower than negatively charged anions (e.g. chloride, bicarbonate; blue ions), generating the zeta potential (red asterisk) which is proportional to GFR. In Step 2, which occurs simultaneously, negatively charged plasma proteins are pushed back by electrophoresis by the streaming potential. (C) In both models of glomerular filtration, total VEGF back-filtration was analysed mathematically depending on GFR (here shown as sieving coefficient of the total amount of released VEGF from podocytes at the outside of the filter). The calculations predict decreasing VEGF concentrations at the end of the glomerular capillary in the pore model versus increasing VEGF concentrations in the electrokinetic model.
FIGURE 6
FIGURE 6
Electrostatic charge of VEGF isoforms. (A) Schematic of the VEGF-A molecule. The N-terminal 110 amino acids of VEGF form a homodimer and bind and activate VEGF receptors. The C-terminus (VEGF120-188) is positively charged and immobilizes VEGF to cell surfaces and extracellular matrix. The N-terminus is separated from the cationic C-terminus by multiple proteolytic cleavage sites (asterisk) at positions 110–118. (B) SDS-PAGE and subsequent immunoblot of recombinant human VEGF isoforms 121 and 165 expressed in eukarotic cells. Deglycosylation modifies the apparent molecular weight of hVEGF165; VEGF121 remains unaffected. (C–D’) To evaluate whether glycosylation modifies the charge of VEGF isoforms, 2D gel electrophoresis (isoelectric focussing/SDS-PAGE) was performed before and after deglycosylation. (C, C’) Human VEGF121 had an apparent molecular weight of ∼15 and ∼18 kDa. Deglycosylation of O- and N-linked oligosaccharides did not affect the anionic charge of the protein (pI ∼6). (D, D’) Human VEGF165 showed an apparent molecular weight of ∼20 and ∼50 kDa, deglycosylation resulted in a slightly smaller and more cationic protein (pI ∼6, 5 → 7, 5) (B–D’; representative immunoblots of at least three independent experiments, each). In summary, glycosylation was detected in the C-terminal 44 amino acids of hVEGF165 (A) but not in hVEGF121 (B–D’). Sequence analysis predicts a calculated negative (anionic) charge of z = −4 or −10 for homodimers of VEGF120 or proteolytically cleaved VEGF110-113, respectively.

References

    1. Eremina V, Sood M, Haigh J. et al. Glomerular-specific alterations of VEGF-A expression lead to distinct congenital and acquired renal diseases. J Clin Invest 2003; 111: 707–716 - PMC - PubMed
    1. Sison K, Eremina V, Baelde H. et al. Glomerular structure and function require paracrine, not autocrine, VEGF-VEGFR-2 signaling. J Am Soc Nephrol 2010; 21: 1691–1701 - PMC - PubMed
    1. Jin J, Sison K, Li C. et al. Soluble FLT1 binds lipid microdomains in podocytes to control cell morphology and glomerular barrier function. Cell 2012; 151: 384–399 - PubMed
    1. Haraldsson B, Barisoni L, Quaggin SE.. Reply to: VEGF inhibition and renal thrombotic microangiopathy. N Engl J Med 2008; 359: 205–207 - PubMed
    1. Hayslett JP, Kashgarian M, Epstein FH.. Functional correlates of compensatory renal hypertrophy. J Clin Invest 1968; 47: 774–799 - PMC - PubMed

Publication types

Substances