. 2018 Jun;218(4):1462-1477.
doi: 10.1111/nph.15100. Epub 2018 Apr 10.

Large sensitivity in land carbon storage due to geographical and temporal variation in the thermal response of photosynthetic capacity

Affiliations

Large sensitivity in land carbon storage due to geographical and temporal variation in the thermal response of photosynthetic capacity

Lina M Mercado et al. New Phytol. 2018 Jun.

Abstract

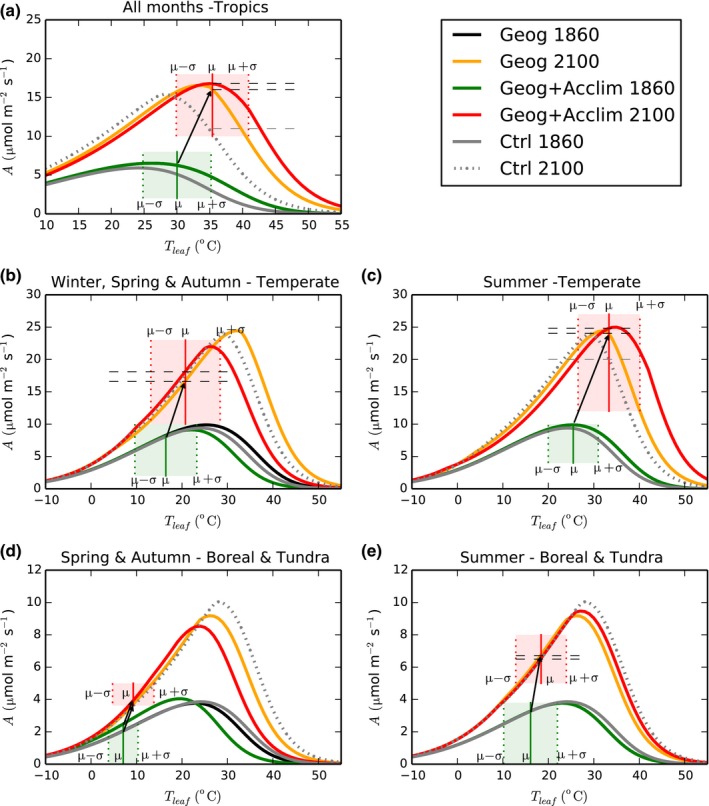
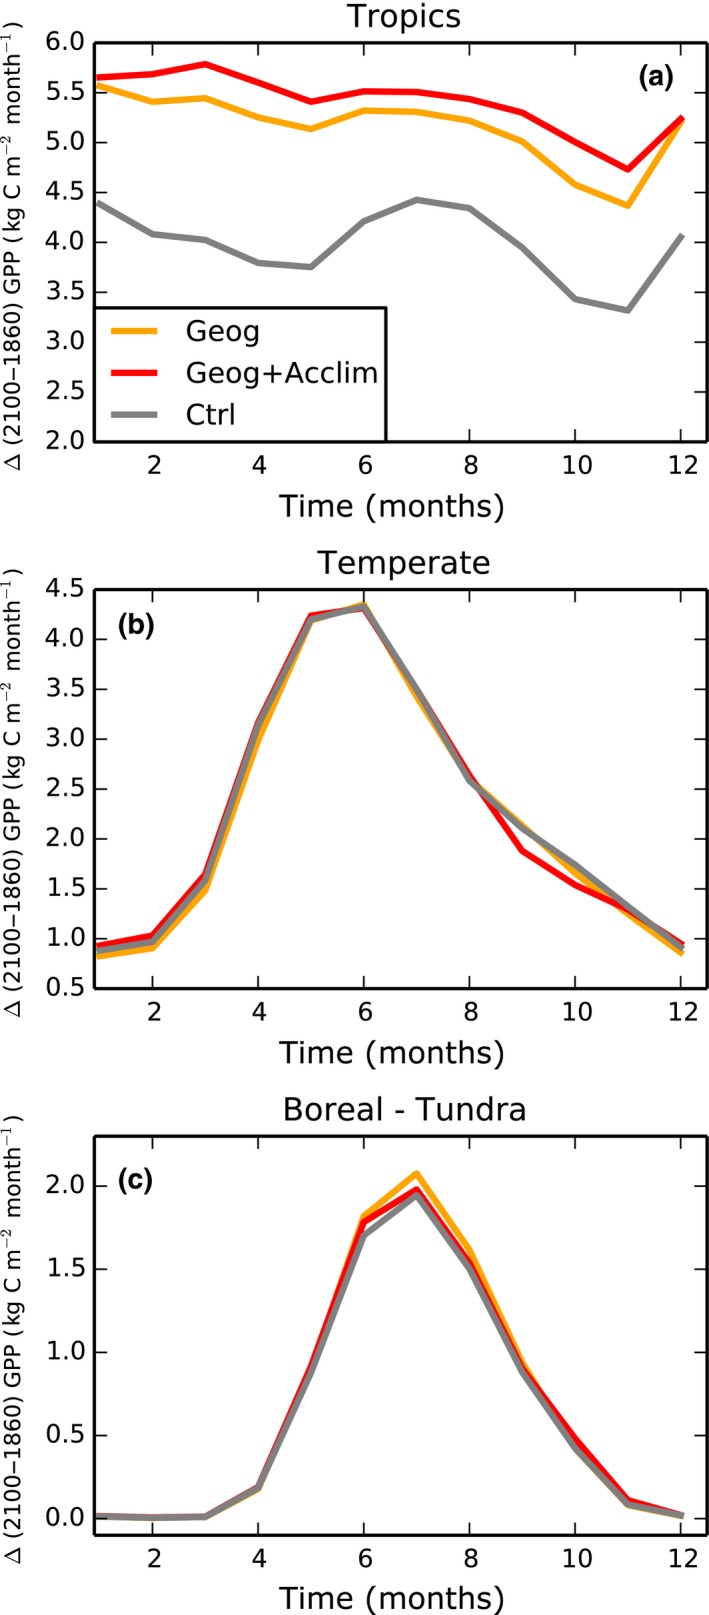
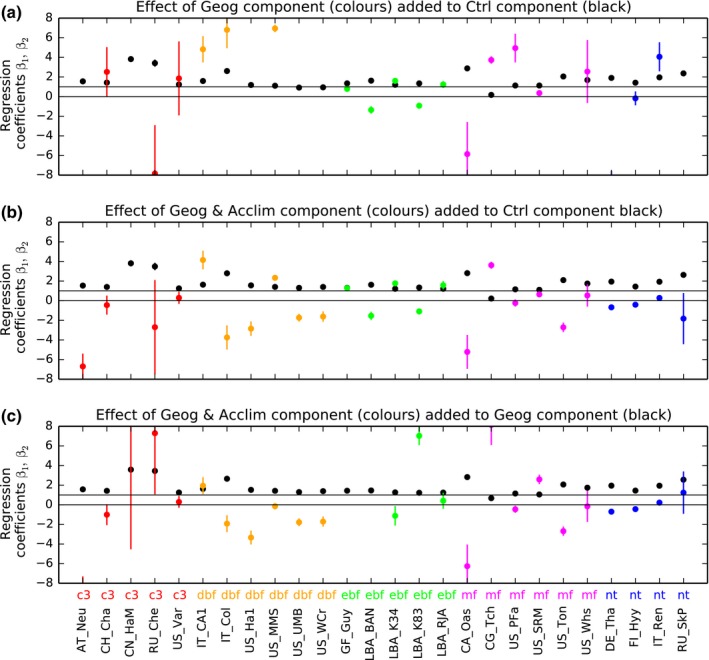
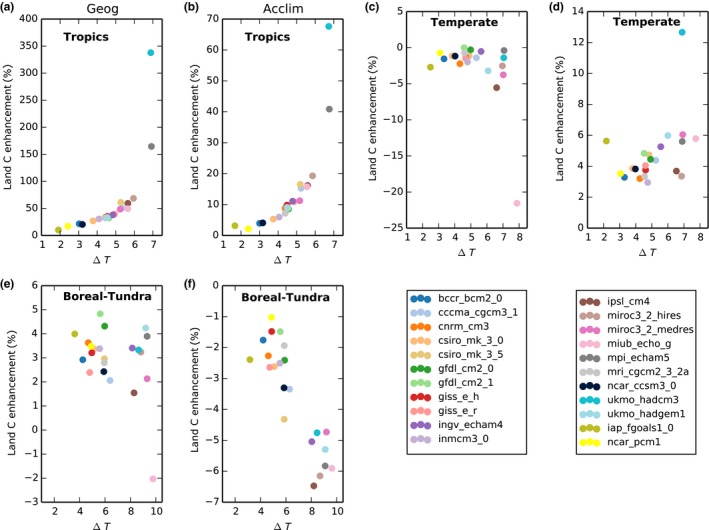
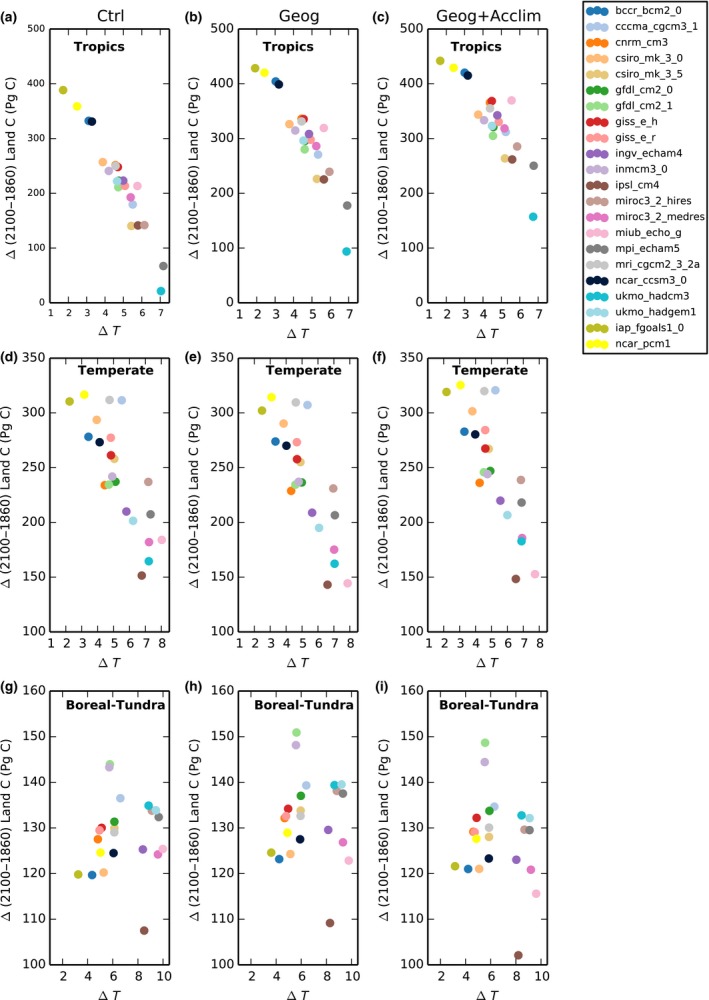
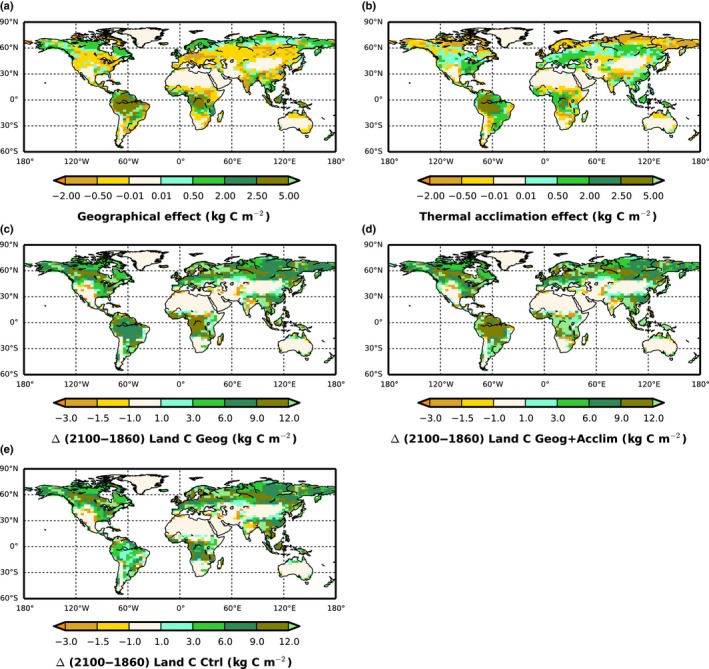
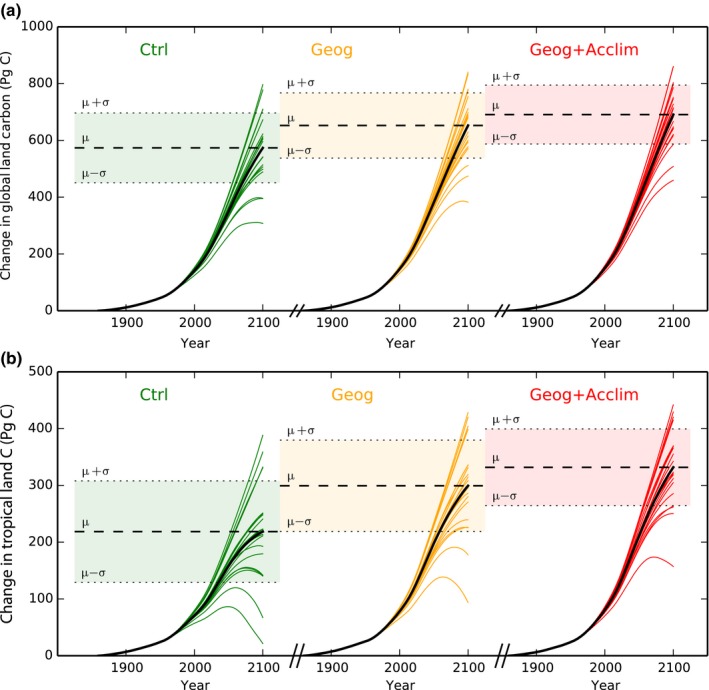
Plant temperature responses vary geographically, reflecting thermally contrasting habitats and long-term species adaptations to their climate of origin. Plants also can acclimate to fast temporal changes in temperature regime to mitigate stress. Although plant photosynthetic responses are known to acclimate to temperature, many global models used to predict future vegetation and climate-carbon interactions do not include this process. We quantify the global and regional impacts of biogeographical variability and thermal acclimation of temperature response of photosynthetic capacity on the terrestrial carbon (C) cycle between 1860 and 2100 within a coupled climate-carbon cycle model, that emulates 22 global climate models. Results indicate that inclusion of biogeographical variation in photosynthetic temperature response is most important for present-day and future C uptake, with increasing importance of thermal acclimation under future warming. Accounting for both effects narrows the range of predictions of the simulated global land C storage in 2100 across climate projections (29% and 43% globally and in the tropics, respectively). Contrary to earlier studies, our results suggest that thermal acclimation of photosynthetic capacity makes tropical and temperate C less vulnerable to warming, but reduces the warming-induced C uptake in the boreal region under elevated CO2 .

Keywords: V cmax; geographical variation of the temperature response of Vcmax and Jmax; modelling photosynthesis; temperature response of photosynthetic capacity; thermal acclimation; tropics.


Figures

Figure 1
Figure 1
Schematic representation of leaf‐level temperature response of light‐saturated gross photosynthesis by sunlit leaves using Ctrl, Geog and Geog+Acclim configurations on (a) a tropical forest (whole year), (b, c) temperate grassland (spring & autumn and summer months, respectively) and (d, e) shrub in the boreal & tundra region (spring & autumn and summer months, respectively) at pre‐industrial (continuous grey, black and green lines) and year 2100 (dotted grey, yellow and red lines) temperatures using an intermediate model in terms of predicted warming for illustrative purposes (gfdl_cm2). Note the scale differences across plant functional types (PFTs). The mean ± 1 SD (μ ± σ) of daytime hourly leaf temperature are represented in the green and red shaded boxes for the years 1860 and 2100, respectively. The black arrow represents the change in photosynthesis in Geog at the mean daytime temperature between 1860 and 2100. The dashed lines represent the extra carbon from acclimation at the mean daytime temperature in 2100.
Figure 2
Figure 2
Change in simulated gross primary productivity (GPP) averaged for the (a) tropics, (b) temperate, and (c) boreal and tundra regions over the 1860–2100 period with climate from the gfdl_cm2 model. Note the differences in y‐axis scales.
Figure 3
Figure 3
Ecosystem‐level evaluation. Black dots are regression coefficient β 1 (Eqn (Eqn 6)) which in (a) and (b) are the component of Ctr simulations to observations, and in (c) are Geog simulations. Coloured dots (β 2 in Eqn (Eqn 6)) correspond to additional components, of (a) Geographical effects, (b) Geographical and acclimation effects, and (c) thermal acclimation effects only. Vertical lines correspond to the 95% confidence intervals on regression coefficients. Values of zero and unity are marked; values near unity suggest modelled effects may be observable in the measurements, and that its calculation is of the correct order of magnitude. Some sites had ‘β 2’ values out of the focal range on the vertical axis.
Figure 4
Figure 4
Simulated enhancement of land carbon storage due to (a, c, e) individual geographical and (b, d, f) acclimation effects for 22 global climate models (GCMs) as a function of the change in regional land surface temperature over the study period (ΔT). Rows represent regions: tropical (30°N < Lat < 30°S), temperate (60°N > Lat > 30°N and 60°S > Lat > 30°S) and boreal and tundra (60°S < Lat > 60°N) regions. Note the differences in y‐axis scales.
Figure 5
Figure 5
Simulated change in global land carbon over the study period in (a, d, g) Ctrl, (b, e, h) Geog and (c, f, i) Geog+Acclim for 22 global climate models (GCMs) as a function of the change in regional land surface temperature over the study period (ΔT). Rows represent regions: tropical (30°N < Lat < 30°S), temperate (60°N > Lat > 30°N and 60°S > Lat > 30°S) and boreal and tundra (60°S < Lat > 60°N). Note the differences in y‐axis scales.
Figure 6
Figure 6
Impact of incorporating (a) geographical variability and (b) thermal acclimatization of temperature sensitivity of photosynthetic capacity on land carbon (C). The (a) Geographical effect was estimated (Eqn (Eqn 8)) as the multi‐model mean change in land C storage (kg C m−2) in (c) the Geog simulation minus change in the Ctrl simulation over the study period (1860–2100). Correspondingly the (a) acclimation effect was estimated as the difference between (d) Geog+Acclim and (c) Geog simulations. Positive (negative) values represent an increase (decrease) in land C storage.
Figure 7
Figure 7
Simulated changes (respect to 1860) in (a) global terrestrial carbon stocks (Pg C) and (b) tropical land carbon under future climate change for Ctrl, Geog and Geog+Acclim simulations.

References

    1. Arneth A, Mercado L, Kattge J, Booth BBB. 2012. Future challenges of representing land‐processes in studies on land‐atmosphere interactions. Biogeosciences 9: 3587–3599.
    1. Arora VK. 2003. Simulating energy and carbon fluxes over winter wheat using coupled land surface and terrestrial ecosystem models. Agriculture and Forest Meteorology 118: 21–47.
    1. Berry J, Bjorkman O. 1980. Photosynthetic response and adaptation to temperature in higher plants. Annual Review of Plant Physiology 31: 491–543.
    1. Booth BBB, Jones CD, Collins M, Totterdell IJ, Cox PM, Sitch S, Huntingford C, Betts RA, Harris GR, Lloyd J. 2012. High sensitivity of future global warming to land carbon cycle processes. Environmental Research Letters 7: 024002.
    1. Cavaleri MA, Reed SC, Smith WK, Wood TE. 2015. Urgent need for warming experiments in tropical forests. Global Change Biology 21: 2111–2121. - PubMed

Publication types

LinkOut - more resources