. 2018 Jun;59(6):974-981.
doi: 10.1194/jlr.M081463. Epub 2018 Apr 10.

Adipocyte-specific DKO of Lkb1 and mTOR protects mice against HFD-induced obesity, but results in insulin resistance

Affiliations

Adipocyte-specific DKO of Lkb1 and mTOR protects mice against HFD-induced obesity, but results in insulin resistance

Yan Xiong et al. J Lipid Res. 2018 Jun.

Abstract

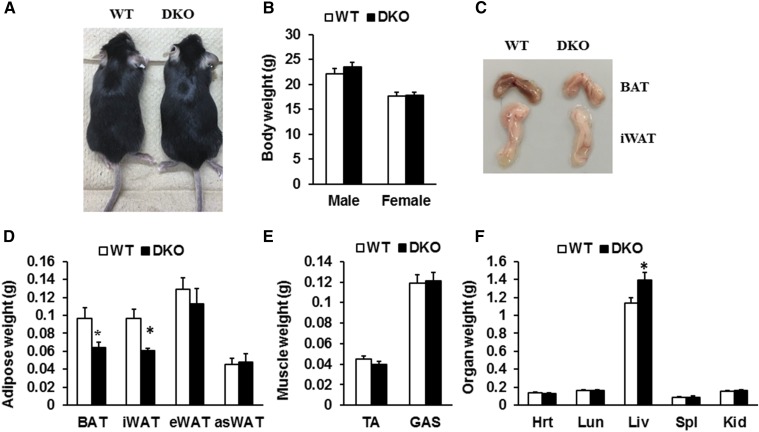
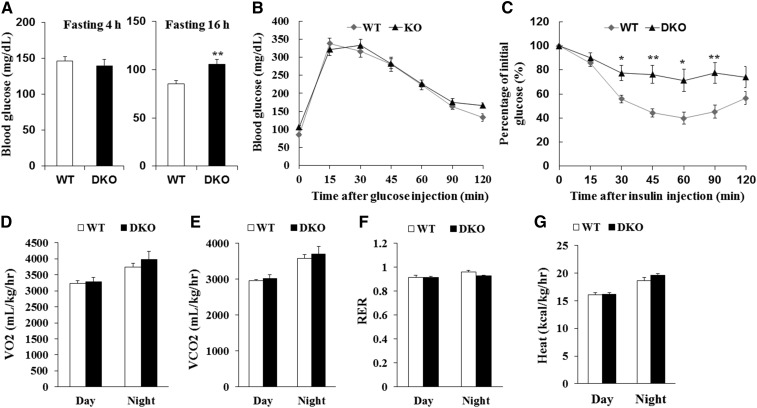
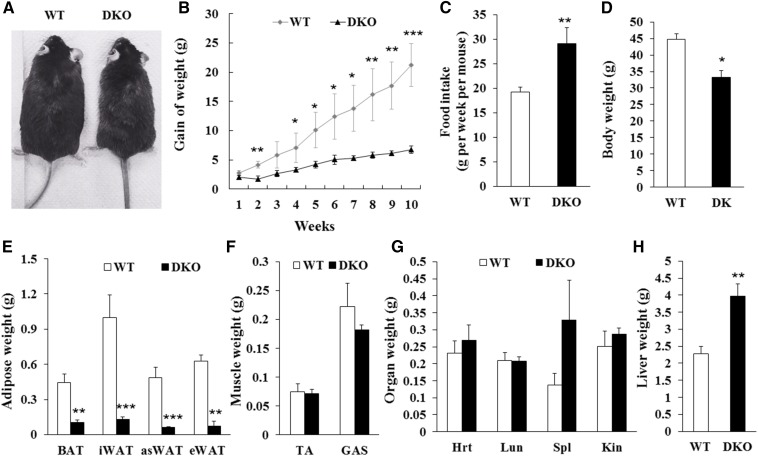
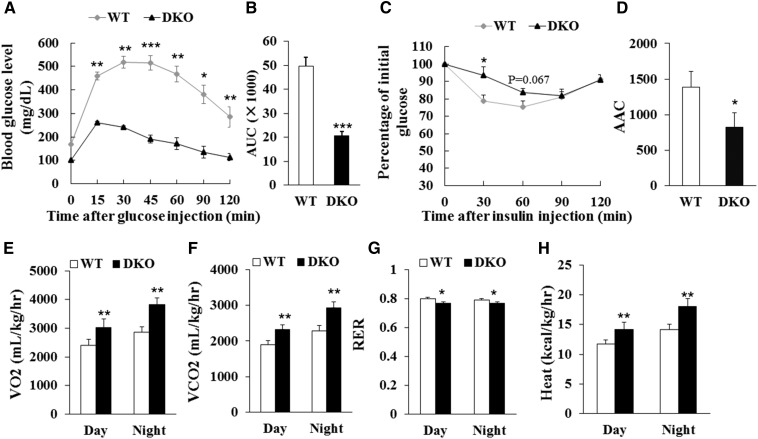
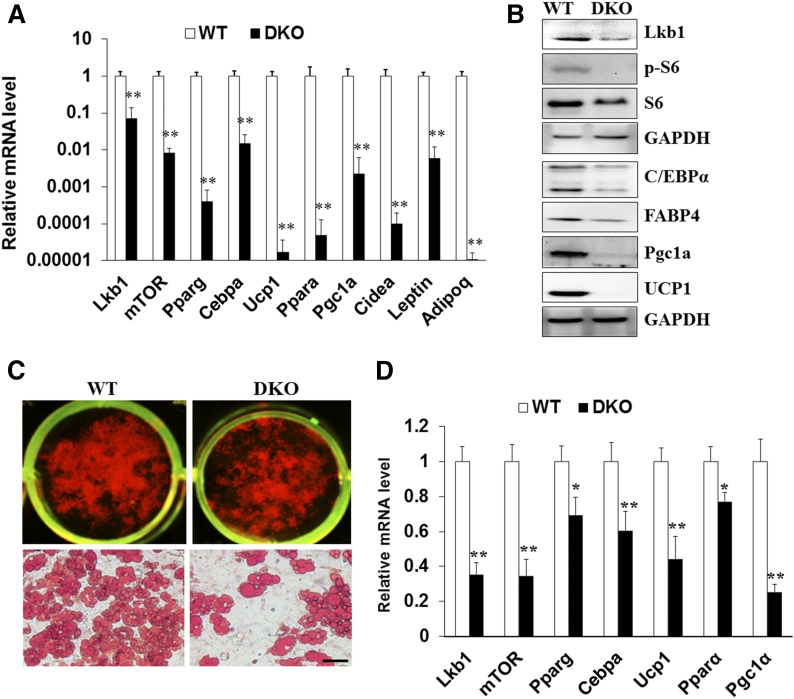
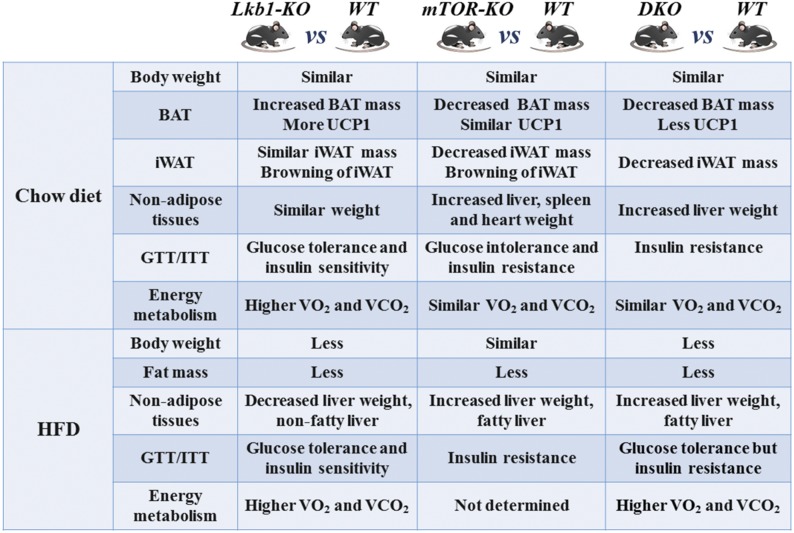
Liver kinase B1 (Lkb1) and mammalian target of rapamycin (mTOR) are key regulators of energy metabolism and cell growth. We have previously reported that adipocyte-specific KO of Lkb1 or mTOR in mice results in distinct developmental and metabolic phenotypes. Here, we aimed to assess how genetic KO of both Lkb1 and mTOR affects adipose tissue development and function in energy homeostasis. We used Adiponectin-Cre to drive adipocyte-specific double KO (DKO) of Lkb1 and mTOR in mice. We performed indirect calorimetry, glucose and insulin tolerance tests, and gene expression assays on the DKO and WT mice. We found that DKO of Lkb1 and mTOR results in reductions of brown adipose tissue and inguinal white adipose tissue mass, but in increases of liver mass. Notably, the DKO mice developed fatty liver and insulin resistance, but displayed improved glucose tolerance after high-fat diet (HFD)-feeding. Interestingly, the DKO mice were protected from HFD-induced obesity due to their higher energy expenditure and lower expression levels of adipogenic genes (CCAAT/enhancer binding protein α and PPARγ) compared with WT mice. These results together indicate that, compared with Lkb1 or mTOR single KOs, Lkb1/mTOR DKO in adipocytes results in overlapping and distinct metabolic phenotypes, and mTOR KO largely overrides the effect of Lkb1 KO.

Keywords: adipose; liver kinase B1; mammalian target of rapamycin; metabolism.


Conflict of interest statement

The authors declare no competing financial interests.

Figures

Fig. 1.
Fig. 1.
Effect of Lkb1 and mTOR DKO on body weight and tissue mass. A: Representative image of WT and DKO mice. B: Body weight of WT and DKO mice (male, n = 6; female, n = 5). C: Representative images of BAT and iWAT depots. D–F: Weights of adipose (D) and nonadipose tissues (E, F) (n = 6). Comparisons were made by unpaired two-tailed Student’s t-tests. Error bars, SEM; *P < 0.05. TA, tibialis anterior muscle; GAS, gastrocnemius muscle; Hrt, heart; Lun, lung; Liv, liver; Spl, spleen; Kid, kidney. Male mice at 8–10 weeks of age were used unless otherwise indicated.
Fig. 2.
Fig. 2.
Induced insulin resistance in DKO mice. A: Fasting glucose levels (n = 9). B, C: Blood glucose concentrations during intraperitoneal GTTs (B) (n = 9) and intraperitoneal ITTs (C) (WT, n = 8; DKO, n = 9) performed on WT and KO mice. D–G: Average VO2 (D), VCO2 (E), RER (F), and heat production (G) performed on WT and DKO mice (n = 5). Comparisons were made by unpaired two-tailed Student’s t-tests. Error bars represent SEM. *P < 0.05, **P < 0.01.
Fig. 3.
Fig. 3.
Adipocyte-specific deletion of Lkb1 and mTOR protects mice from HFD-induced obesity. A: Representatives of WT and DKO mice fed with HFD for 10 weeks. B, C: Body weight gains (B) and food intake (C) of WT (n = 5) and DKO (n = 3) mice during HFD feeding. D–H: Body weight (D), adipose tissue mass (E), muscle mass (F), and organ mass (G, H) of WT (n = 5) and DKO (n = 3) mice after 10 weeks on HFD. Comparisons were made by unpaired two-tailed Student’s t-tests. Error bars represent SEM. *P < 0.05, **P < 0.01, ***P < 0.001.
Fig. 4.
Fig. 4.
Lkb1 and mTOR DKO affects glucose and energy metabolism in mice after HFD feeding. A, B: Blood glucose concentrations and area under curve (AUC) during GTT (A, B) (WT, n = 9; DKO, n = 8) after 10 week HFD. C, D: Blood glucose concentrations and area above curve (AAC) during ITT (C, D) (n = 7) after 10 week HFD. E–H: Average day and night VO2 (E), VCO2 (F), RER (G), and heat production (H) of WT (n = 4) and DKO (n = 3) mice after 10 week HFD. Comparisons were made by unpaired two-tailed Student’s t-tests. Error bars represent SEM. *P < 0.05, **P < 0.01, ***P < 0.001.
Fig. 5.
Fig. 5.
Deletion of Lkb1 and mTOR decreases the expression of adipogenesis and mitochondrial function-related genes in BAT and cultured brown adipocytes. A, B: mRNA (A) and protein (B) levels of adipogenesis and mitochondrial function-related genes in BAT from WT and DKO mice after 10 weeks of HFD feeding (n = 5). C: Oil Red O staining of cultured WT and DKO brown adipocytes. D: mRNA levels of adipogenesis and mitochondrial function-related genes in differentiated WT and KO brown adipocytes (n = 3). Comparisons were made by unpaired two-tailed Student’s t-tests. Error bars represent SEM. *P < 0.05, **P < 0.01.
Fig. 6.
Fig. 6.
Similarities and differences between the Lkb1-KO [Adipoq-Lkb1 (6)], mTOR-KO [Adipoq-mTOR (21)], and DKO mouse phenotypes.

References

    1. Wu J., Bostrom P., Sparks L. M., Ye L., Choi J. H., Giang A. H., Khandekar M., Virtanen K. A., Nuutila P., Schaart G., et al. . 2012. Beige adipocytes are a distinct type of thermogenic fat cell in mouse and human. Cell. 150: 366–376. - PMC - PubMed
    1. Wu J., Cohen P., and Spiegelman B. M.. 2013. Adaptive thermogenesis in adipocytes: is beige the new brown? Genes Dev. 27: 234–250. - PMC - PubMed
    1. Waldén T. B., Hansen I. R., Timmons J. A., Cannon B., and Nedergaard J.. 2012. Recruited vs. nonrecruited molecular signatures of brown, “brite,” and white adipose tissues. Am. J. Physiol. Endocrinol. Metab. 302: E19–E31. - PubMed
    1. Oelkrug R., Polymeropoulos E. T., and Jastroch M.. 2015. Brown adipose tissue: physiological function and evolutionary significance. J. Comp. Physiol. B. 185: 587–606. - PubMed
    1. Cannon B., and Nedergaard J.. 2004. Brown adipose tissue: function and physiological significance. Physiol. Rev. 84: 277–359. - PubMed

Publication types

MeSH terms