

Clinical and epidemiological variability in severe sepsis: an ecological study
- PMID: 29636401
- PMCID: PMC7027349
- DOI: 10.1136/jech-2018-210501
Clinical and epidemiological variability in severe sepsis: an ecological study
Abstract
Background: To assess clinical and epidemiological trends of severe sepsis.
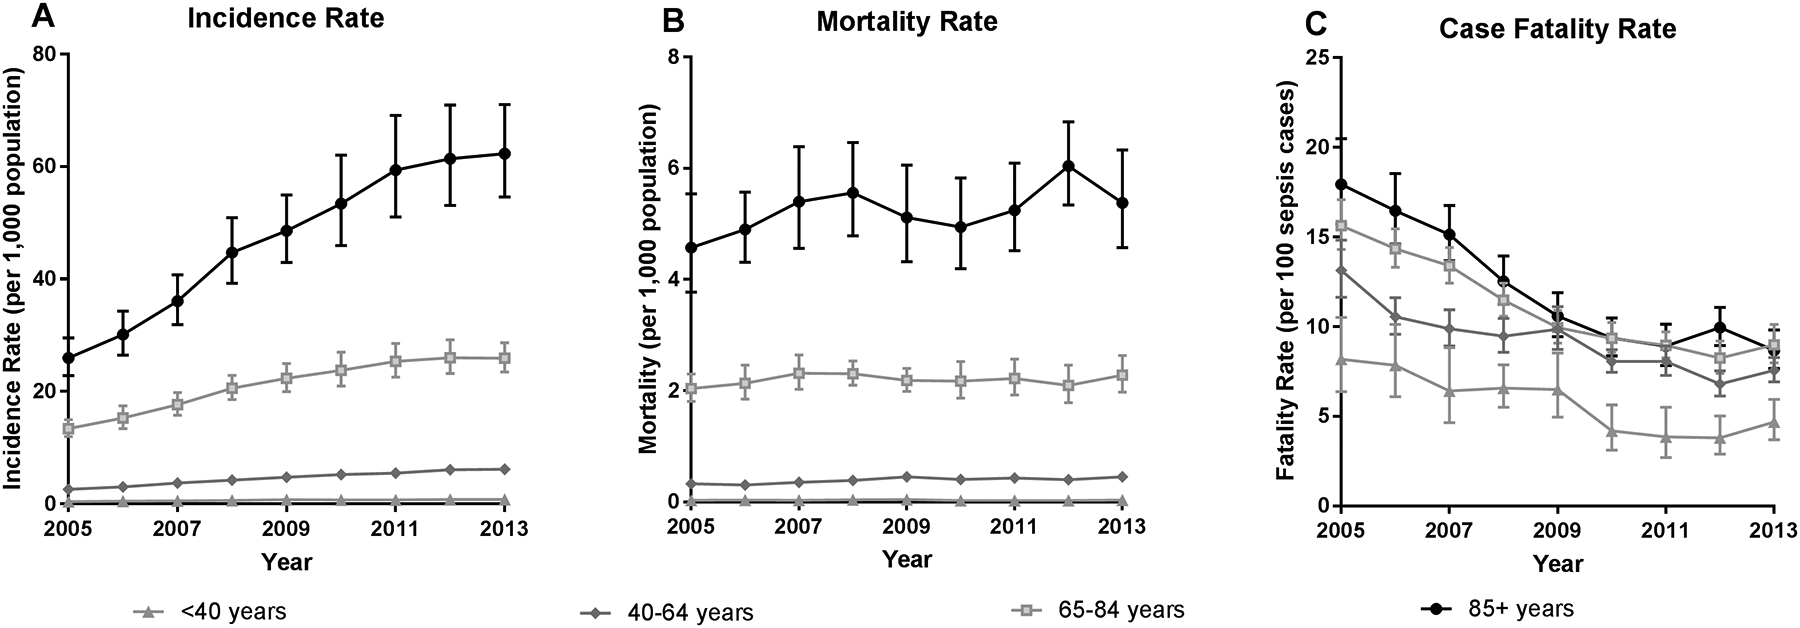
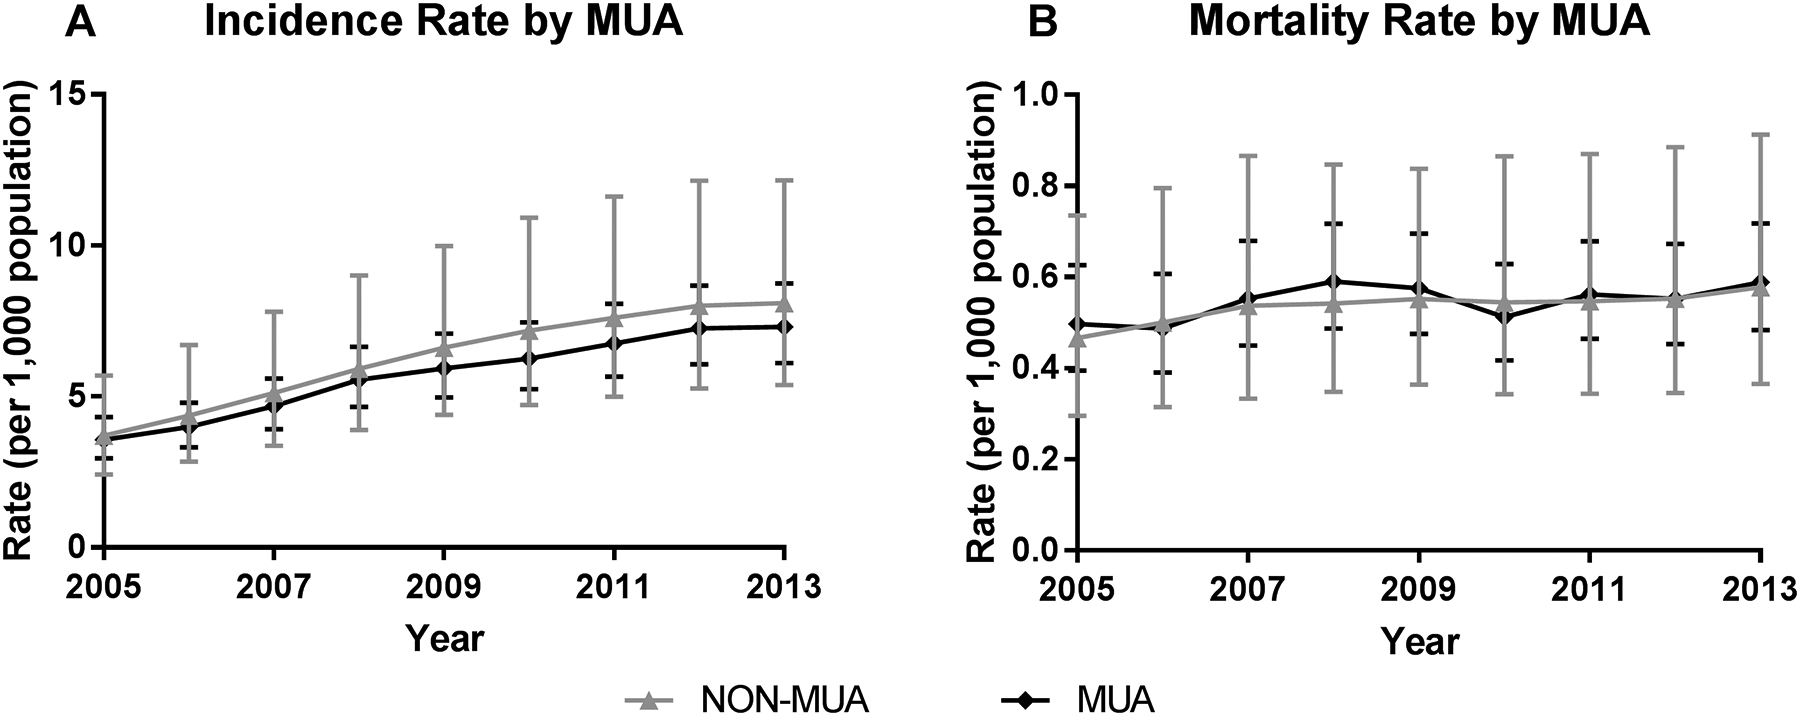
Methods: Ecological study of patients presenting to the emergency department with severe sepsis or septic shock between 2005 and 2013. Patients were identified using the state-wide hospital administrative database. Key outcomes included incidence rates (IRs) and mortality rates (per 1000 population) by age and medically underserved areas (MUAs), sepsis case fatality rate (deaths per 100 sepsis cases), and proportions of transfer and comorbidities.
Results: There were 154 019 sepsis cases identified. In 2005, 85+ yo in non-MUAs had a 44% increase in IR compared with those in MUAs, and this difference rose to 74% by 2013. Mortality rates were 1.6 (95% CI 1.3 to 1.8) times greater among 85+ yo in non-MUAs. Mortality rates increased by 1.8% annually, while the sepsis case fatality rate decreased by 7.7%. The proportion of transfer among sepsis cases decreased by 2.1% per year (3.8% in non-MUAs, 0.7% in MUAs).
Conclusions: Sepsis incidence varies geographically, and access to healthcare is one proposed mechanism that may explain heterogeneity. Over time, we may be capturing higher acuity sepsis cases with better recognition and management, as well as observing differential diagnostic coding documentation by location.
Keywords: epidemiology of aging; geography; inequalities; infection; mortality.
© Article author(s) (or their employer(s) unless otherwise stated in the text of the article) 2018. All rights reserved. No commercial use is permitted unless otherwise expressly granted.
Conflict of interest statement
Competing interests: None declared.
Figures

References
-
- Angus DC, Linde-Zwirble WT, Lidicker J, et al. Epidemiology of severe sepsis in the United States: analysis of incidence, outcome, and associated costs of care. Crit Care Med 2001;29(7):1303–10. - PubMed
-
- Health Resources & Services Administration. Medically Underserved Areas and Populations (MUA/Ps) 2016. [Available from: https://bhw.hrsa.gov/shortage-designation/muap accessed March 21, 2017.
Publication types
MeSH terms
Grants and funding
LinkOut - more resources
Full Text Sources
Other Literature Sources
Medical