. 2018 Apr 10;9(1):1353.
doi: 10.1038/s41467-018-03696-w.

Generation and characterization of ultrathin free-flowing liquid sheets

Affiliations

Generation and characterization of ultrathin free-flowing liquid sheets

Jake D Koralek et al. Nat Commun. .

Erratum in

Abstract

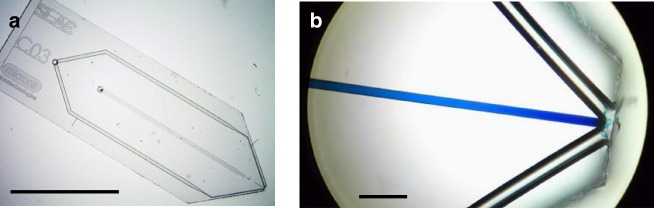
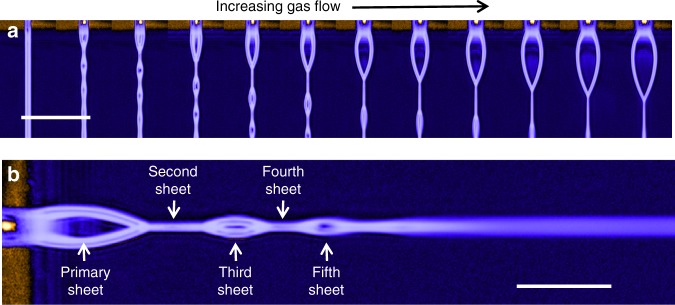
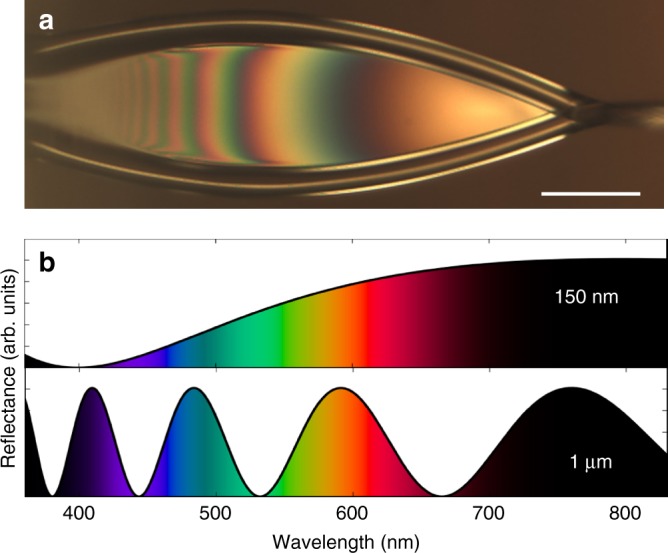
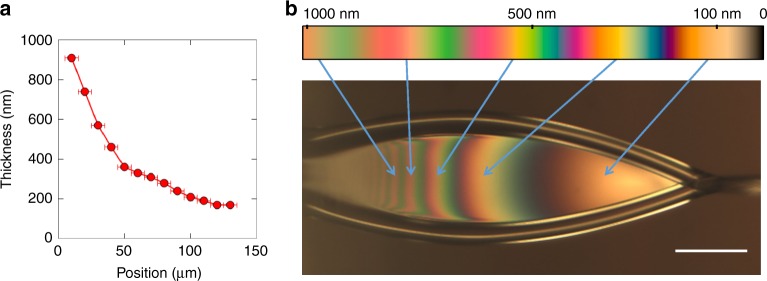
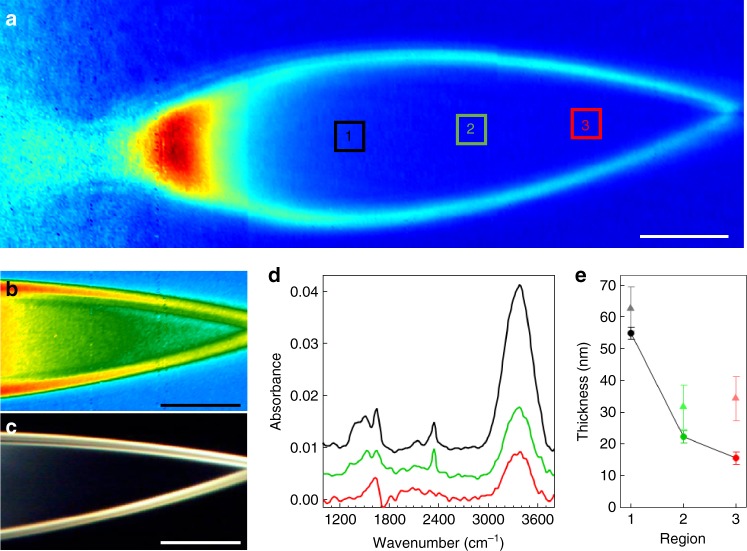
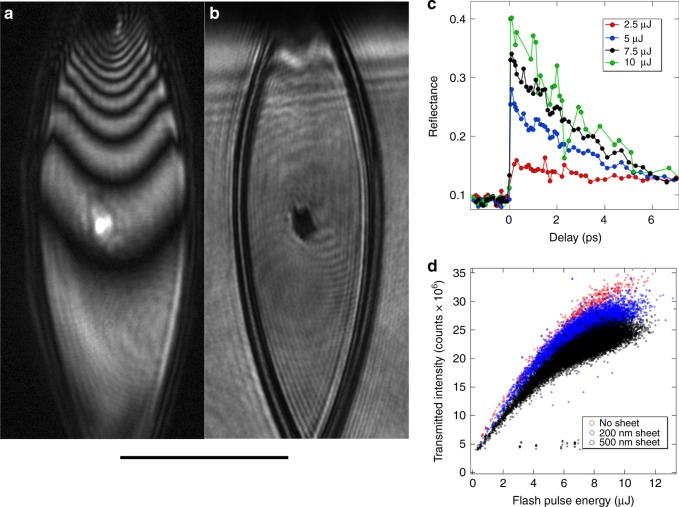
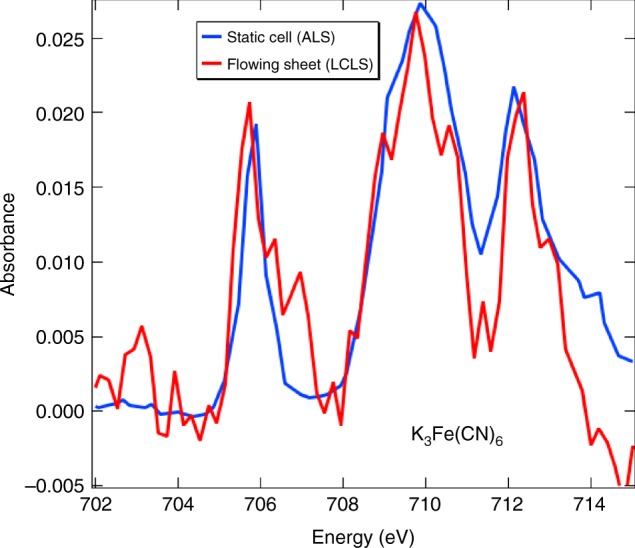
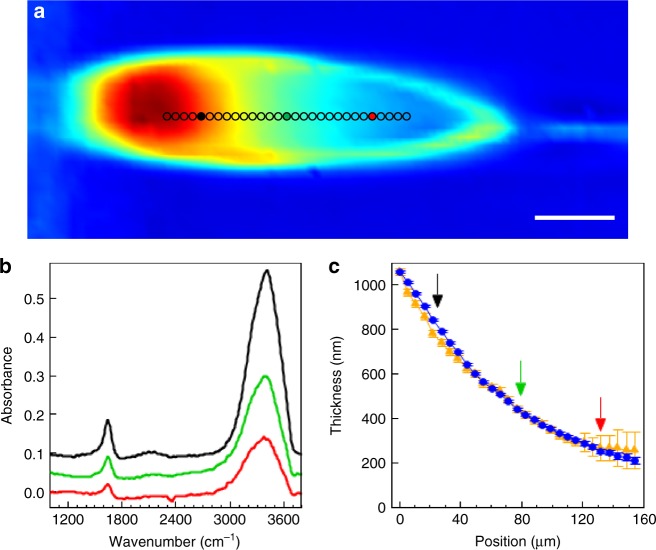
The physics and chemistry of liquid solutions play a central role in science, and our understanding of life on Earth. Unfortunately, key tools for interrogating aqueous systems, such as infrared and soft X-ray spectroscopy, cannot readily be applied because of strong absorption in water. Here we use gas-dynamic forces to generate free-flowing, sub-micron, liquid sheets which are two orders of magnitude thinner than anything previously reported. Optical, infrared, and X-ray spectroscopies are used to characterize the sheets, which are found to be tunable in thickness from over 1 μm down to less than 20 nm, which corresponds to fewer than 100 water molecules thick. At this thickness, aqueous sheets can readily transmit photons across the spectrum, leading to potentially transformative applications in infrared, X-ray, electron spectroscopies and beyond. The ultrathin sheets are stable for days in vacuum, and we demonstrate their use at free-electron laser and synchrotron light sources.


Conflict of interest statement

The authors declare no competing interests.

Figures

Fig. 1
Fig. 1
Microfluidic gas-dynamic nozzle. The microfluidic device for generating free-flowing liquid sheets is shown in a. The gas and liquid ports are on the underside of the chip on the left. Microfluidic channels for gas (outer), and liquid (central) can be traced to the output of the nozzle on the right side of the chip. The chip dimensions are 6×19 mm, and the scale bar is 6 mm. A close-up of the nozzle output is shown in b, where a blue dye has been introduced into the liquid channel. The scale bar in b is 100 μm
Fig. 2
Fig. 2
Ultrathin liquid sheet generation. A series of images depicting the formation of a liquid sheet is shown in a. In these images the nozzle output is on the top, the liquid is flowing downward, and the gas flow increases as we move to the right of the figure. The cylindrical liquid jet on the far left evolves into a thin sheet as gas flow is increased. The scale bar in a is 1 mm. A more detailed view of the alternating orthogonal sheet structure is shown in b, where the nozzle is on the left, and the liquid is flowing to the right. The scale bar in b is 500 μm
Fig. 3
Fig. 3
Spectral reflectance of water. An optical reflection image of an ultrathin liquid sheet is shown in a, highlighting the thin-film interference fringes. The calculated spectral reflectance of water for films of 150 nm and 1 μm thickness are shown in b. The scale bar in a is 50 μm
Fig. 4
Fig. 4
Optical characterization of liquid sheets. The thickness of a liquid sheet is measured by spectral reflectance, as described in the text, and plotted in a as a function of position along the sheet, starting at the far left arrow in b. The error bars in a represent the 10 μm sampling size of the measurement. The color bar above the image in b is a simulation of the observed reflected color for water films, as a function of thickness, as described in the text. Arrows indicate the corresponding fringes on the liquid sheet, in agreement with the spectral reflectance measurements of a. The scale bar in a is 50 μm
Fig. 5
Fig. 5
Infrared spectromicroscopy of ultrathin liquid water sheets. a A false-color image of the integrated IR transmission (3100–3650 cm−1) through a water sheet with 150 µL min−1 flow rate, compiled from three separate tiled images with no additional processing. The color scale for the image in b is the spectral weight in the O–H stretch mode, highlighting the amount of liquid water in the sheet. The corresponding optical reflection image is shown in c, demonstrating total lack of reflection for the thinnest parts of the sheet. d Infrared absorption spectra of the water sheet in the three regions highlighted by the black, green, and red boxes in a. The spectra for regions 1 and 2 are offset for clarity. e The calculated sheet thickness in each of the three regions indicated in a, using the measured absorbance values of the O–H stretch at 3404 cm−1 (dark circles, connected by black lines for clarity) and the H2O bending mode at 1643.5 cm−1 (light triangles). The error bars in e represent an estimate of the uncertainty of the absorption measurement based on the signal-to-noise ratio of the peaks of interest. In this case, the error bars are calculated by measuring the baseline noise (peak-to-peak) on either side of the peak of interest and scaling the error for the calculated thickness by standard error propagation methods. The scale bars in all panels are 50 μm
Fig. 6
Fig. 6
Soft X-ray measurements of liquid water sheets. Measurements from the FLASH free-electron laser are shown as described in the text. Shown are optical reflection (a) and transmission (b) images taken in situ. The entire sheet was illuminated by an optical parametric amplifier (500 nm), which was used as a probe of the dynamics induced by the soft X-ray pulses. The X-ray spot can be seen as a bright spot in reflection and a dark spot in transmission, immediately following the X-ray pump. c The reflectivity of the X-ray pumped region of the water sheet, as a function of time delay between the X-ray pump and optical probe, for a series of different pump fluences. d The intensity of soft X-rays transmitted through the water sheet, as a function of FLASH pulse energy, for different sheet thicknesses. The scale bar is 100 μm
Fig. 7
Fig. 7
Soft X-ray transmission spectroscopy of aqueous sheets. Soft X-ray transmission spectra for 100 mM Fe(CN)6(3−) measured at the ALS in a static cell (blue), and at the LCLS in a flowing ultrathin liquid sheet (red) are shown. The ALS data was scaled down to compare to the absorbance of the much shorter liquid path in the LCLS data
Fig. 8
Fig. 8
Infrared spectromicroscopy of liquid water sheets. a A false-color image of the integrated IR transmission (3100–3650 cm−1) through a water sheet with 250 µL min−1 flow rate, under similar conditions as Fig. 4. The scale bar is 50 µm. b The infrared spectra of the water sheet at three points along the sheet, as indicated by the black, green, and red colored circles in a. The black and green spectra are offset for clarity. c The calculated sheet thickness along the central region of the water sheet, as indicated by the markers in a, using values of the O–H stretch mode at 3404 cm−1 (blue circles) and the H2O bending mode at 1643.5 cm−1 (gold triangles). The black, green, and red arrows indicate the positions of the respective colored markers in a, as well as the colored spectra in b. The error bars in c represent an estimate of the uncertainty of the absorption measurement based on the signal-to-noise ratio of the peaks of interest. In this case, the error bars are calculated by measuring the baseline noise (peak-to-peak) on either side of the peak of interest and scaling the error for the calculated thickness by standard error propagation methods

References

    1. Naslund LA, et al. X-ray absorption spectroscopy measurements of liquid water. J. Phys. Chem. B. 2005;109:13835–13839. doi: 10.1021/jp052046q. - DOI - PubMed
    1. Fransson T, et al. X-ray and electron spectroscopy of water. Chem. Rev. 2016;116:7551–7569. doi: 10.1021/acs.chemrev.5b00672. - DOI - PubMed
    1. DePonte, D. P. et al. Gas dynamic virtual nozzle for generation of microscopic droplet streams. J. Phys. D Appl. Phys. 41, 19 (2008).
    1. Ekimova M, Quevedo W, Faubel M, Wernet P, Nibbering ETJ. A liquid flatjet system for solution phase soft-x-ray spectroscopy. Struct. Dyn. 2015;2:054301. doi: 10.1063/1.4928715. - DOI - PMC - PubMed
    1. Fondell M, et al. Time-resolved soft X-ray absorption spectroscopy in transmission mode on liquids at MHz repetition rates. Struct. Dyn. 2017;4:054902. doi: 10.1063/1.4993755. - DOI - PMC - PubMed

Publication types