. 2018 Apr 10;9(1):1366.
doi: 10.1038/s41467-018-03751-6.

Massive mining of publicly available RNA-seq data from human and mouse

Affiliations

Massive mining of publicly available RNA-seq data from human and mouse

Alexander Lachmann et al. Nat Commun. .

Abstract

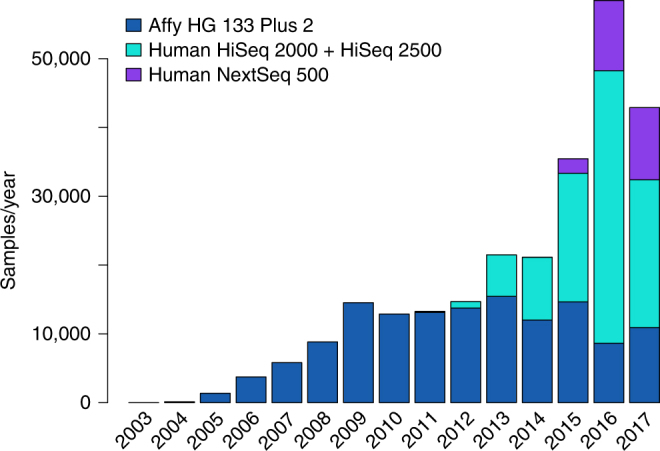
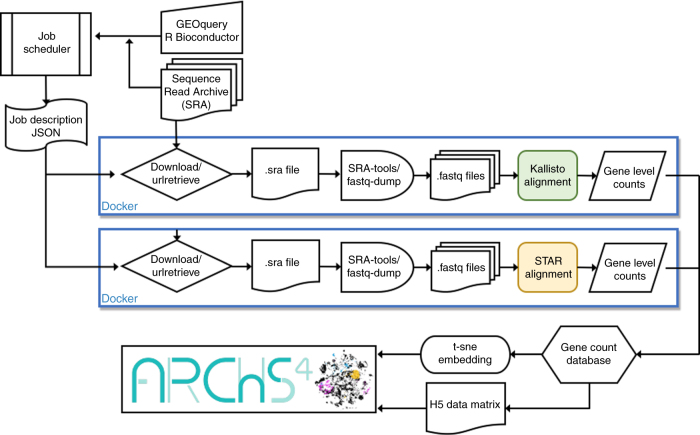
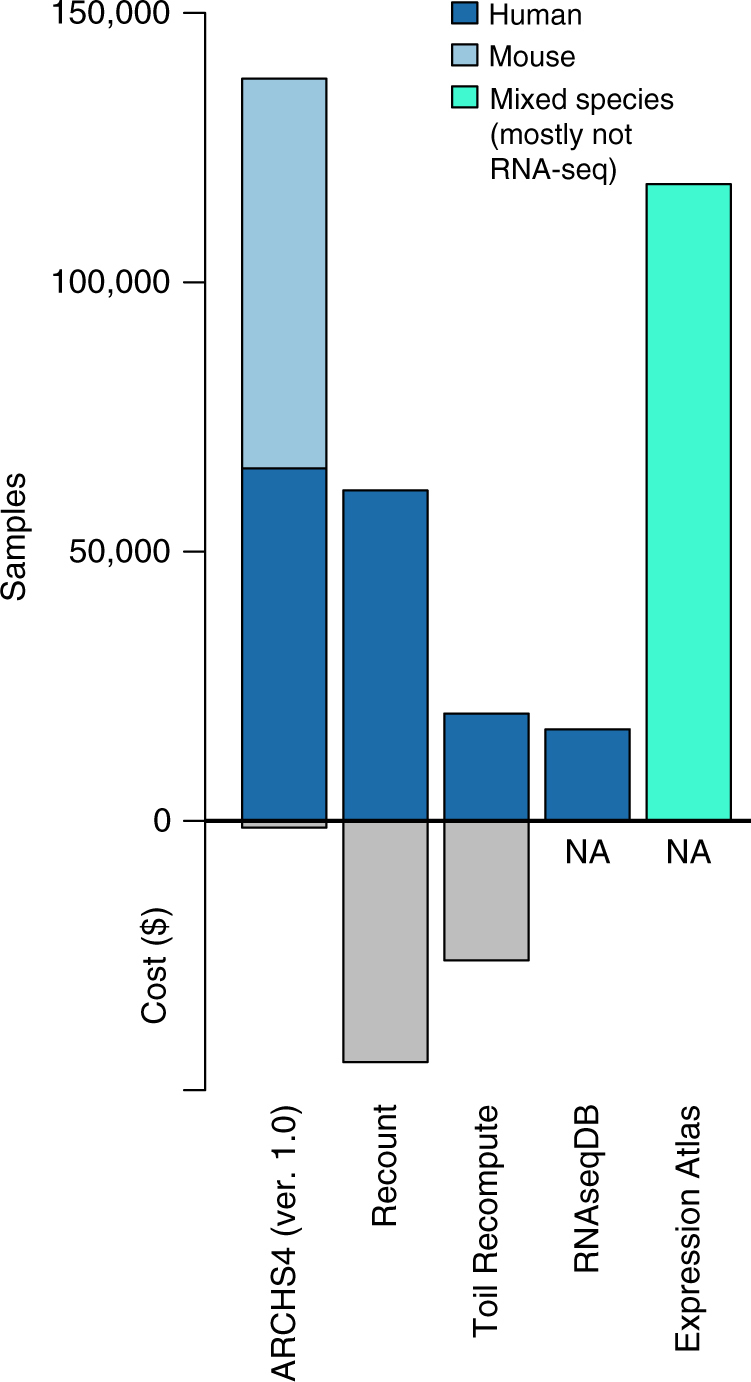
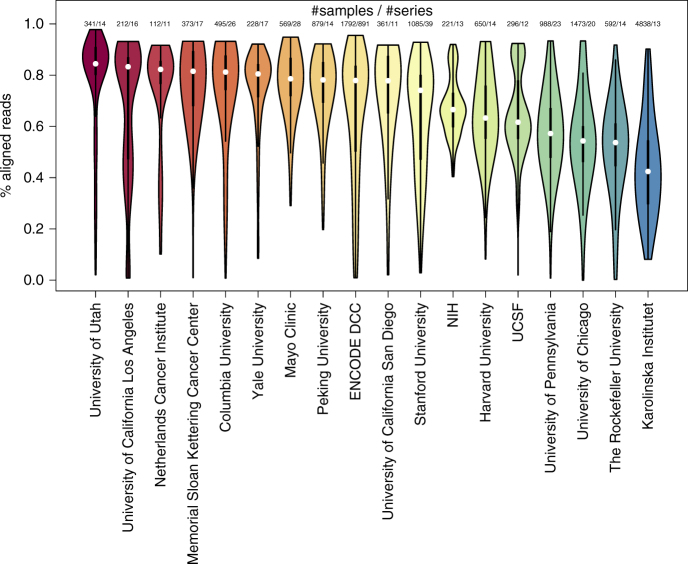
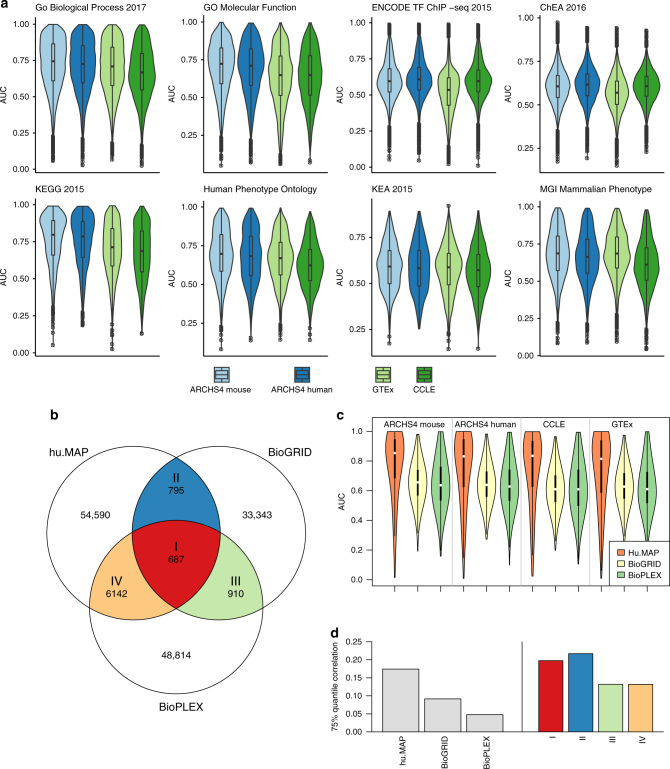
RNA sequencing (RNA-seq) is the leading technology for genome-wide transcript quantification. However, publicly available RNA-seq data is currently provided mostly in raw form, a significant barrier for global and integrative retrospective analyses. ARCHS4 is a web resource that makes the majority of published RNA-seq data from human and mouse available at the gene and transcript levels. For developing ARCHS4, available FASTQ files from RNA-seq experiments from the Gene Expression Omnibus (GEO) were aligned using a cloud-based infrastructure. In total 187,946 samples are accessible through ARCHS4 with 103,083 mouse and 84,863 human. Additionally, the ARCHS4 web interface provides intuitive exploration of the processed data through querying tools, interactive visualization, and gene pages that provide average expression across cell lines and tissues, top co-expressed genes for each gene, and predicted biological functions and protein-protein interactions for each gene based on prior knowledge combined with co-expression.


Conflict of interest statement

The authors declare no competing interests.

Figures

Fig. 1
Fig. 1
Publicly available RNA-seq samples currently available at GEO/SRA for human and mouse compared to available samples collected with the popular Affymetrix HG U133 Plus 2 platform
Fig. 2
Fig. 2
Schematic illustration of the ARCHS4 cloud-based alignment pipeline workflow. A job scheduler instructs Dockerized alignment instances that are processing FASTQ files from the SRA database in parallel. The pipeline supports the STAR and Kallisto aligners. The final results are sent to a database for post-processing. Dimensionality reduction for data visualization is calculated with t-SNE, and all counts are additionally stored in a H5 data matrix. The .sra file extension is the native file format for files from the SRA database
Fig. 3
Fig. 3
Dimensionality reduction and processing time evaluation. a Average correlation between samples before and after applying the Johnson–Lindenstrauss dimensionality reduction. The original gene expression matrix is reduced from 34,198 genes/dimensions to smaller sets of JL dimensions. For each number of JL dimensions, the procedure was repeated 10 times to obtain variances. b Mean AUC for predicting GO biological processes using the ARCHS4 mouse co-expression data created from different size sets of randomly selected samples. Whiskers in plots a and b represent one standard deviation from the mean. c Processing time per million reads for single read and paired-end read RNA-seq for the Kallisto processing container. d Elapsed time per million (MM) spots/nucleotides for completing the processing of paired read FASTQ files with the Dockerized Kallisto processing container; rs in c and d are the r2 correlation coefficient linear fit. e Distribution of the number of detected genes for pipelines that utilize the Kallisto vs. STAR aligners across 1708 randomly selected and processed human RNA-seq samples. f Distribution of AUCs for predicting gene set membership for GO biological processes from co-expression matrices derived from the same set of 1708 human RNA-seq samples processed by STAR or Kallisto aligners
Fig. 4
Fig. 4
Total available samples from large-scale re-processing RNA-seq resources and the total estimated cost of processing raw samples to gene/transcript counts
Fig. 5
Fig. 5
Distribution of the percentage of aligned reads from human RNA-seq samples that are successfully aligned with Kallisto by institution as it is reported within GEO submission pages. The selected institutions that are shown, have processed at least 100 samples from more than 10 different gene expression series. Colors represent alignment quality (red-high; blue-low)
Fig. 6
Fig. 6
Prediction of biological function and protein–protein interactions. a The distribution of AUC for gene set membership prediction of gene annotations from eight gene set libraries with co-expression data created from ARCHS4 mouse, ARCHS4 human, GTEx, and CCLE. The gene set libraries used to train and evaluate the predictions are ChEA, ENCODE, GO Biological Process, GO Molecular Function, KEA, KEGG Pathways, Human Phenotype Ontology, and MGI Mammalian Phenotype Level 4. These libraries were obtained from the Enrichr collection of libraries. b Venn diagram showing the intersection of edges between three PPI databases hu.MAP, BioGRID, and BioPLEX. c Distribution of AUC for protein–protein interaction prediction from gene co-expression data created in the same way from ARCHS4 mouse, ARCHS4 human, CCLE, and GTEx. d Bar plot of the pairwise correlation between genes with reported protein–protein interactions for the three PPI networks hu.MAP, BioGRID, and BioPLEX in ARCHS4 mouse expression. The right tail of the gene pair correlation distribution is shown by the 75% quantile. On the right, the bars represent the percent overlap of predicted interactions for the matching intersections from the Venn diagram plotted in b

References

    1. Venter JC, et al. The sequence of the human genome. Science. 2001;291:1304–1351. doi: 10.1126/science.1058040. - DOI - PubMed
    1. Schena M, Shalon D, Davis RW, Brown PO. Quantitative monitoring of gene expression patterns with a complementary DNA microarray. Science. 1995;270:467–470. doi: 10.1126/science.270.5235.467. - DOI - PubMed
    1. Marioni JC, Mason CE, Mane SM, Stephens M, Gilad Y. RNA-seq: an assessment of technical reproducibility and comparison with gene expression arrays. Genome Res. 2008;18:1509–1517. doi: 10.1101/gr.079558.108. - DOI - PMC - PubMed
    1. Edgar R, Domrachev M, Lash AE. Gene Expression Omnibus: NCBI gene expression and hybridization array data repository. Nucleic Acids Res. 2002;30:207–210. doi: 10.1093/nar/30.1.207. - DOI - PMC - PubMed
    1. Brazma A, et al. ArrayExpress—a public repository for microarray gene expression data at the EBI. Nucleic Acids Res. 2003;31:68–71. doi: 10.1093/nar/gkg091. - DOI - PMC - PubMed

Publication types