. 2018 Apr 10;9(1):1373.
doi: 10.1038/s41467-018-03714-x.

NKX2-5 regulates human cardiomyogenesis via a HEY2 dependent transcriptional network

Affiliations

NKX2-5 regulates human cardiomyogenesis via a HEY2 dependent transcriptional network

David J Anderson et al. Nat Commun. .

Abstract

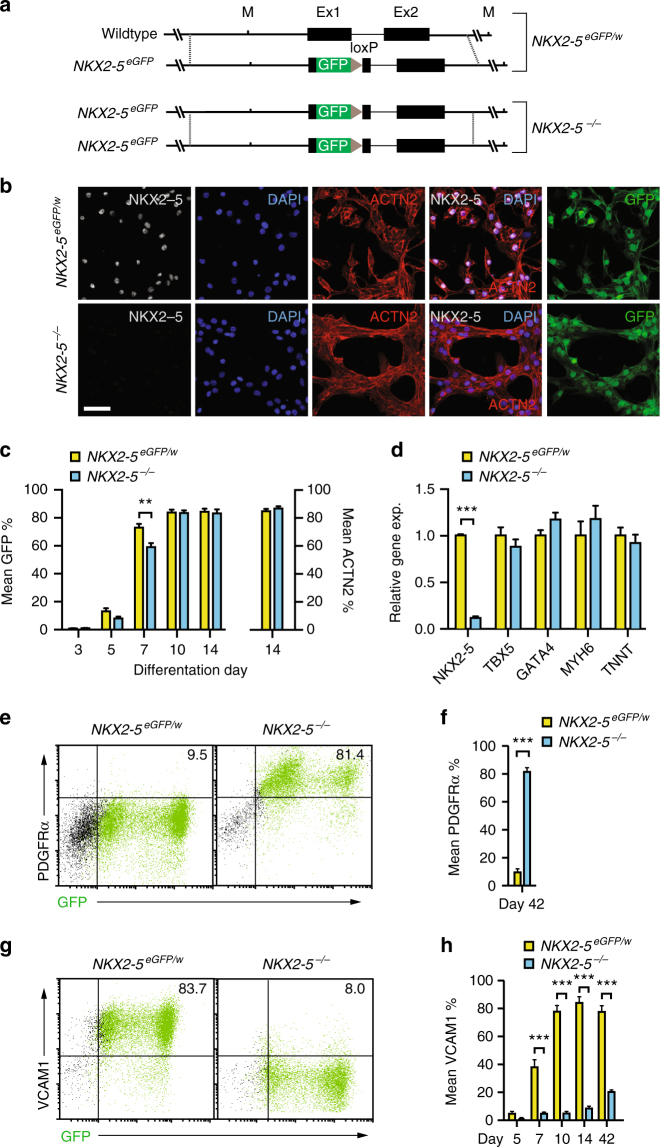
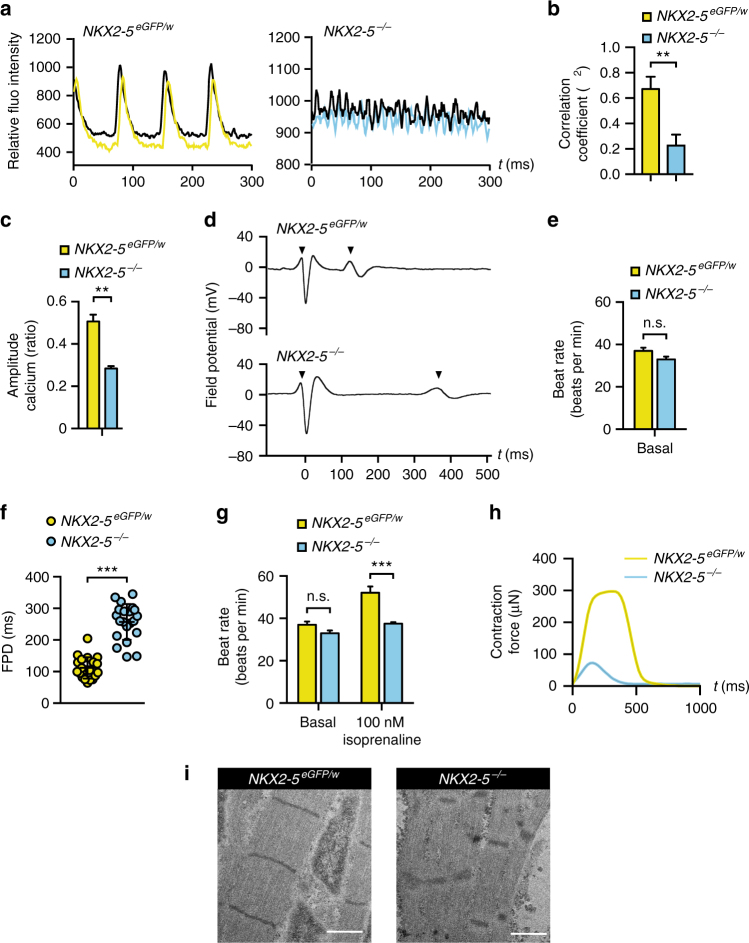
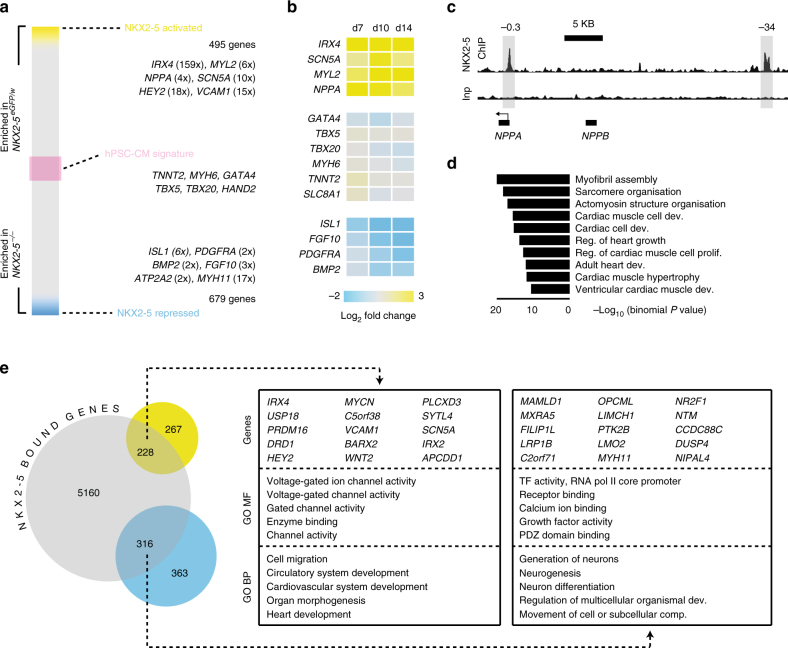
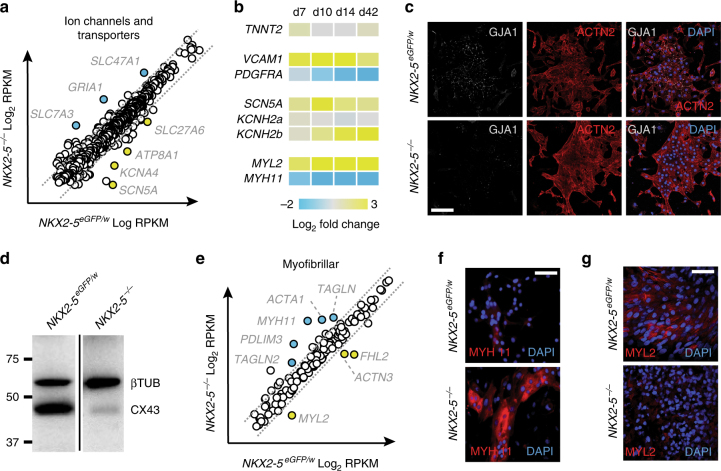
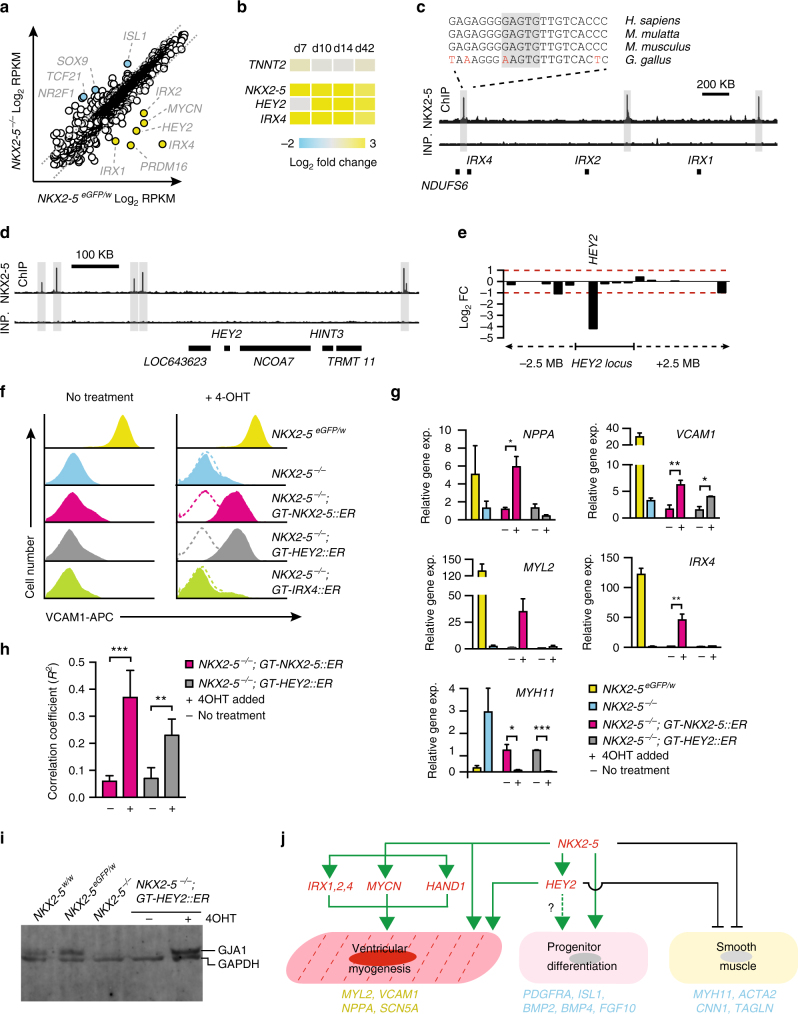
Congenital heart defects can be caused by mutations in genes that guide cardiac lineage formation. Here, we show deletion of NKX2-5, a critical component of the cardiac gene regulatory network, in human embryonic stem cells (hESCs), results in impaired cardiomyogenesis, failure to activate VCAM1 and to downregulate the progenitor marker PDGFRα. Furthermore, NKX2-5 null cardiomyocytes have abnormal physiology, with asynchronous contractions and altered action potentials. Molecular profiling and genetic rescue experiments demonstrate that the bHLH protein HEY2 is a key mediator of NKX2-5 function during human cardiomyogenesis. These findings identify HEY2 as a novel component of the NKX2-5 cardiac transcriptional network, providing tangible evidence that hESC models can decipher the complex pathways that regulate early stage human heart development. These data provide a human context for the evaluation of pathogenic mutations in congenital heart disease.


Conflict of interest statement

The authors declare no competing interests.

Figures

Fig. 1
Fig. 1
NKX2-5 regulates cardiomyocyte differentiation. a Schematic representation of NKX2-5eGFP/w and NKX2-5−/− (NKX2-5 null) genotype. b Immunofluorescent detection of NKX2-5, ACTN2 and GFP in NKX2-5eGFP/w and NKX2-5−/− cultures at day 14 of cardiac differentiation. Nuclei counterstained with DAPI. Scale bar = 50 μM. c Bar graph quantifying GFP and ACTN2 expression in differentiating NKX2-5eGFP/w and NKX2-5−/− cultures, as determined by flow cytometry (see Supplementary Fig. 1). Data represent mean ± SEM (n = 5). **p < 0.01 (Student’s t-test). d Q-PCR analysis of NKX2-5eGFP/w and NKX2-5−/− cultures at day 14 of differentiation. NKX2-5 null cardiomyocytes show normal expression of characteristic cardiomyocyte markers. Data represent mean ± SEM (n = 4). *** p < 0.001 (Student’s t-test). e, f Representative flow cytometry plots (e) and bar graph (f) of PDGFRα expression in NKX2-5eGFP/w and NKX2-5−/− cultures at day 42 of differentiation. Numbers on plots are percentage of cells in quadrant. Data represent mean ± SEM (n = 4). ***p < 0.001 (Student’s t-test). g, h Representative flow cytometry plot at day 14 of differentiation (g) and bar graph (h) of a time course of VCAM1 expression in differentiating NKX2-5eGFP/w and NKX2-5−/− cultures. Numbers on plots are percentage of cells in quadrant. Data represent mean ± SEM (n = 4). ***p < 0.001 (Student’s t-test)
Fig. 2
Fig. 2
Functional profiling demonstrates NKX2-5−/− cardiomyocytes have perturbed electrophysiology and reduced contractile force. a Representative graphs showing co-ordination of calcium flux in day 17 cardiomyocyte monolayers derived from NKX2-5eGFP/w and NKX2-5−/− hESCs as detected by Fluo4-AM. b Bar graph quantifying demonstrating analysis of correlation between calcium imaging signals as derived in a. Data represent mean ± SEM (n = 6). ** p < 0.01 (Student’s t-test). c Bar graphs quantifying calcium amplitude (as a ratio of max to min calcium concentration) during contraction of NKX2-5eGFP/w and NKX2-5−/− monolayers at day 14 of differentiation. Data represent mean ± SEM (n = 6). ** p < 0.01 (Student’s t-test). d Representative traces of MEA extracellular field potentials of cardiomyocyte aggregates derived from NKX2-5eGFP/w and NKX2-5−/− cultures at day 14 of differentiation (arrowheads represent start and end of field potential). e Bar graph demonstrating NKX2-5eGFP/w and NKX2-5−/− cardiomyocyte aggregates have similar rates of contraction at day 14 of differentiation, as determined by MEA. Data represent mean ± SEM (n = 13). f Dot plots of field potential duration (FPD) of cardiomyocyte aggregates, as derived in d. NKX2-5 null cardiomyocyte aggregates have a prolonged FPD, which is maintained until day 42 of differentiation (Supplementary Fig. 2a). Bars represent mean ± SD (n = 20). *** p < 0.001 (Student’s t-test). g Bar graphs demonstrating NKX2-5 null cardiomyocyte aggregates at day 14 of differentiation have an impaired chronotropic response to beta-adrenergic stimulation with isoprenaline, as determined by MEA. Data represent mean ± SEM (n = 13). *** p < 0.001 (Student’s t-test). h Representative graph of contraction force generated during a single contraction by NKX2-5eGFP/w and NKX2-5−/− bioengineered cardiac organoids (see Supplementary Fig. 2f for quantitation). i Transmission electron micrographs show that NKX2-5 null cardiomyocytes have disorganized sarcomeres compared to NKX2-5eGFP/w cardiomyocytes (see also Supplementary Fig. 2g). Scale bar = 1 μM
Fig. 3
Fig. 3
Defining the NKX2-5 transcriptional network. a Schematic heat map showing differential gene expression between GFP+ cells isolated from NKX2-5eGFP/w and NKX2-5−/− GFP+ cultures at day 10 of cardiac differentiation. In NKX2-5 null GFP+ cells, NKX2-5 activated genes (yellow) have reduced expression whereas NKX2-5 repressed genes (blue) have increased expression. Expression of hPSC-CM signature genes (pink) is largely NKX2-5 independent. Numbers represent mean fold change in gene expression (n = 3). b Heat map of gene expression in GFP+ cells isolated from NKX2-5eGFP/w and NKX2-5−/− cultures at day 7, 10, or 14 of cardiac differentiation, as determined by Q-PCR. Displayed as mean log2 fold change between the two genotypes at each time point (n = 4). c Representative NKX2-5 ChIP-seq data showing localization of NKX2-5 binding at the NPPA locus. Highlighted peaks in NKX2-5 ChIP-seq track denote conserved NKX2-5 binding regions at −0.3 kb and −34 kb from transcriptional start site enriched after chromatin immunoprecipitation with NKX2-5. Inp = input chromatin. d Most represented GO biological process terms returned when the closest genes to NKX2-5 binding sites were analyzed. This data shows NKX2-5 binds near genes involved in heart development and cardiomyocyte function. e Venn diagram outlining overlap between genes positively (yellow) and negatively (blue) regulated by NKX2-5, and NKX2-5 bound genomic regions (gray). Boxes contain top 15 differentially regulated genes with proximal NKX2-5 binding sites and top 5 GO terms (MF = molecular function, BP = biological process) from the genes within the overlapping regions of the Venn diagram
Fig. 4
Fig. 4
Deletion of NKX2-5 disrupts both electrical and mechanical gene networks in cardiomyocytes. a Dot plot representation of RNA-seq absolute gene expression (log2 RPKM values) for a reported list of ion channel and transporter genes. Dotted lines mark 2-fold differential expression level. b Heat map of gene expression (Q-PCR) in GFP+ cells isolated from NKX2-5eGFP/w and NKX2-5−/− cultures at day 7, 10, 14, or 42 of cardiac differentiation. Displayed as mean log2 fold change between the two genotypes at each time point (n = 4). c Immunocytochemistry analysis of GJA1 (CX43) and ACTN2 expression in cardiomyocytes derived from NKX2-5eGFP/w and NKX2-5−/− cells at day 42 of differentiation. Scale bar = 100 μm. d Western blot detection of GJA1 in NKX2-5eGFP/w and NKX2-5−/− cultures confirms reduction in GJA1 observed in h. Size markers in kDa are indicated to the left of the blot. e Dot plot representation of RNA-seq absolute gene expression (log2 RPKM values) for myofibrillar genes. Dotted lines mark 2-fold differential expression level. f Immunofluorescent detection of MYH11 (smooth muscle myosin heavy chain) in cardiomyocytes derived from NKX2-5eGFP/w and NKX2-5−/− cells at day 14 of differentiation. Nuclei are counterstained with DAPI. Scale bar = 50 μm. g Immunofluorescent detection of MYL2 (Myosin light chain 2 v) in cardiac organoids generated from NKX2-5eGFP/w and NKX2-5−/− cells. Nuclei are counterstained with DAPI. Scale bar = 50 μm
Fig. 5
Fig. 5
HEY2 is a key downstream transcriptional mediator of NKX2-5. a Dot plot representation of RNA-seq absolute gene expression (log2 RPKM values) for FANTOM5 predicted transcription factors. Dotted line marks 2 fold differential expression level. b Heat map of gene expression in GFP+ cells isolated from NKX2-5eGFP/w and NKX2-5−/− cultures at day 7, 10 or 14 of cardiac differentiation, as determined by Q-PCR. Displayed as mean log2 fold change between the two genotypes at each time point (n = 4). c, d Schematics of NKX2-5 ChIP-seq data showing the IRX1/2/4 cluster (c) and HEY2 locus (d) with regions bound by NKX2-5 highlighted. The IRX4 proximal NKX2-5 bound region is highly conserved. Inp. = input chromatin. e Differential expression of genes 2.5 Mbp up or downstream of the HEY2 locus in d. This data shows HEY2 is the only differentially expressed gene in this chromosomal region. Red dashed line marks 2 fold (adj. p value < 0.05) gene expression difference between genotypes. f Histograms of flow cytometry analysis of VCAM1 in untreated (No treatment) or induced (+4-OHT) NKX2-5−/− GAPTrap (GT) lines. Both GT-NKX2-5::ER and GT-HEY::ER restore VCAM1 expression (n = 4). g Gene expression profiling of genetic rescue via the modified GAPTrap loci, GT-NKX2-5::ER, GT-HEY::ER and GT-IRX4::ER, as determined by Q-PCR (n = 3). * p < 0.05, ** p < 0.01, *** p < 0.001 (Student’s t-test). h Correlation coefficient between contractile areas improves when both NKX2-5 and HEY2 are induced (n = 3, scored blind to genotype). ** p < 0.01, *** p < 0.001 (Student’s t-test). i Western blot showing restoration of GJA1 (connexin 43) levels by HEY2 and that wildtype (HES3) and NKX2-5eGFP/w GJA1 levels are comparable. j Network model of NKX2-5 regulated genes and their potential roles in regulating ventricular myogenesis, progenitor differentiation and smooth muscle differentiation. Representative genes with altered expression (yellow text activated genes, blue repressed genes) in NKX2-5 null cultures are shown below each process

References

    1. Kathiriya IS, Nora EP, Bruneau BG. Investigating the transcriptional control of cardiovascular development. Circ. Res. 2015;116:700–714. doi: 10.1161/CIRCRESAHA.116.302832. - DOI - PMC - PubMed
    1. Davidson EH, Erwin DH. Gene regulatory networks and the evolution of animal body plans. Science. 2006;311:796–800. doi: 10.1126/science.1113832. - DOI - PubMed
    1. Garg V, et al. GATA4 mutations cause human congenital heart defects and reveal an interaction with TBX5. Nature. 2003;424:443–447. doi: 10.1038/nature01827. - DOI - PubMed
    1. Li QY, et al. Holt-Oram syndrome is caused by mutations in TBX5, a member of the Brachyury (T) gene family. Nat. Genet. 1997;15:21–29. doi: 10.1038/ng0197-21. - DOI - PubMed
    1. Schott JJ, et al. Congenital heart disease caused by mutations in the transcription factor NKX2-5. Science. 1998;281:108–111. doi: 10.1126/science.281.5373.108. - DOI - PubMed

Publication types

MeSH terms

Substances