. 2018 Apr 10;9(1):1364.
doi: 10.1038/s41467-018-03856-y.

ATAC-Seq analysis reveals a widespread decrease of chromatin accessibility in age-related macular degeneration

Affiliations

ATAC-Seq analysis reveals a widespread decrease of chromatin accessibility in age-related macular degeneration

Jie Wang et al. Nat Commun. .

Abstract

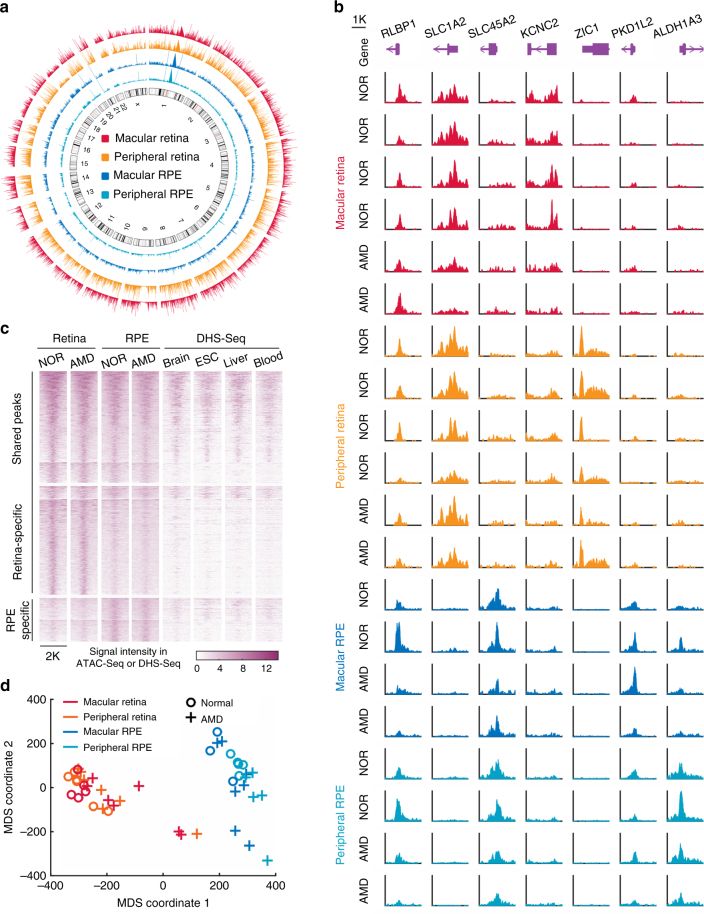
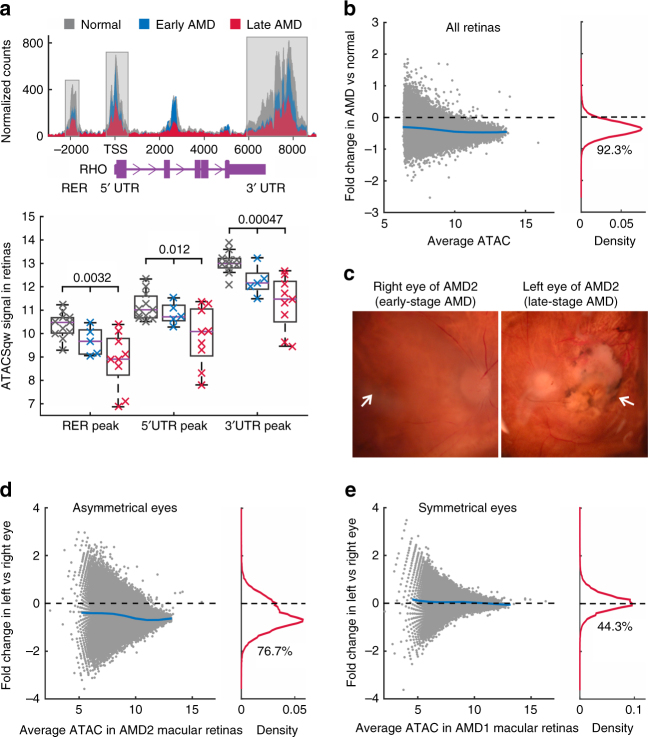
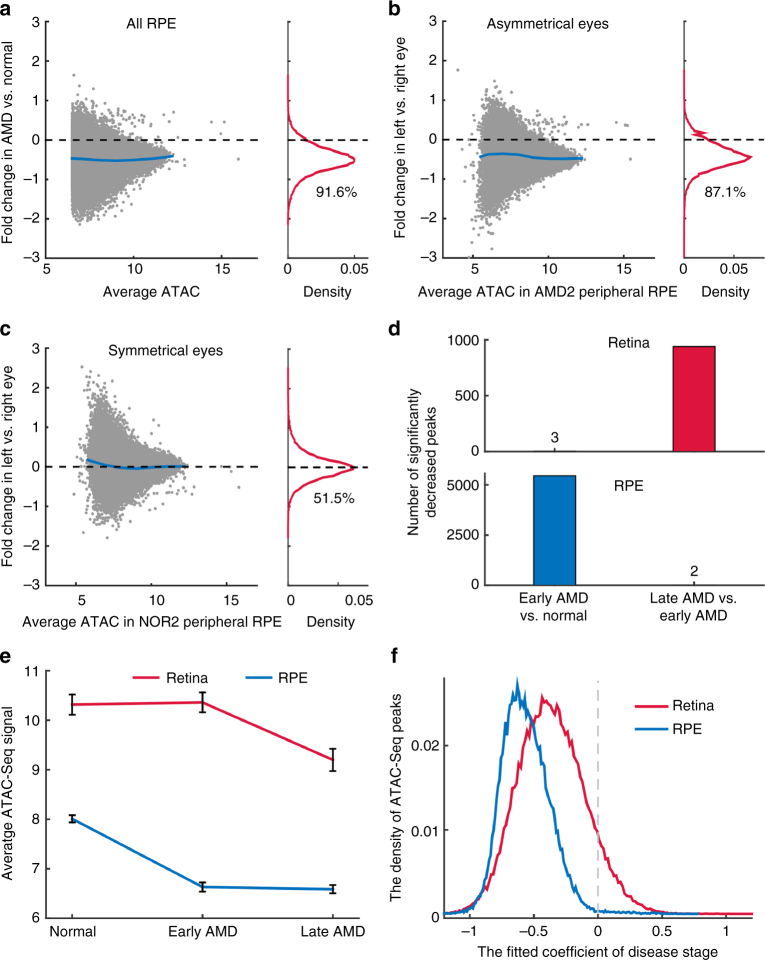
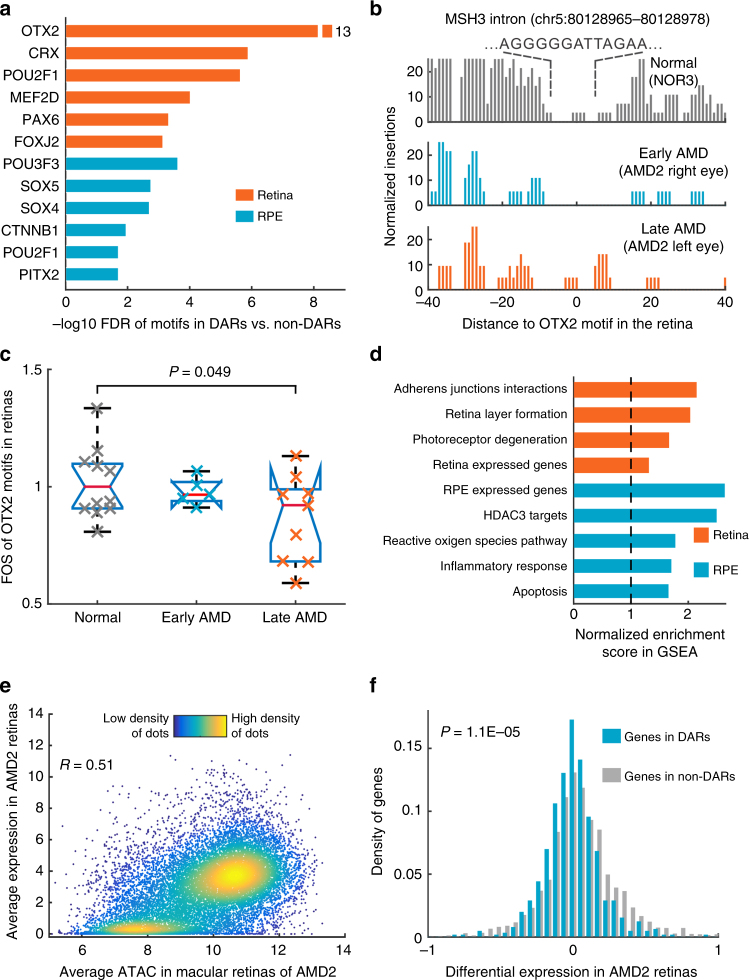
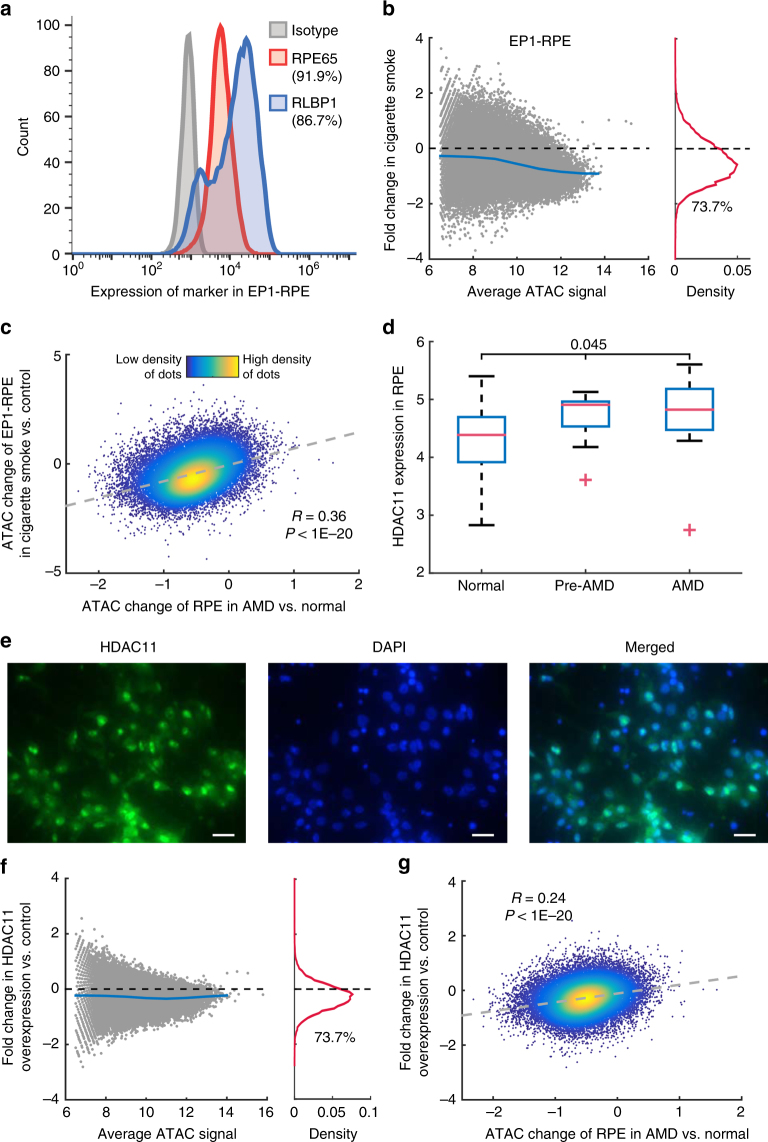
Age-related macular degeneration (AMD) is a significant cause of vision loss in the elderly. The extent to which epigenetic changes regulate AMD progression is unclear. Here we globally profile chromatin accessibility using ATAC-Seq in the retina and retinal pigmented epithelium (RPE) from AMD and control patients. Global decreases in chromatin accessibility occur in the RPE with early AMD, and in the retina of advanced disease, suggesting that dysfunction in the RPE drives disease onset. Footprints of photoreceptor and RPE-specific transcription factors are enriched in differentially accessible regions (DARs). Genes associated with DARs show altered expression in AMD. Cigarette smoke treatment of RPE cells recapitulates chromatin accessibility changes seen in AMD, providing an epigenetic link between a known risk factor for AMD and AMD pathology. Finally, overexpression of HDAC11 is partially responsible for the observed reduction in chromatin accessibility, suggesting that HDAC11 may be a potential new therapeutic target for AMD.


Conflict of interest statement

The authors declare no competing interests.

Figures

Fig. 1
Fig. 1
The landscape of chromatin accessibility in human retina and RPE. a Genome-wide chromatin accessibility of a control eye. b The instances of open chromatin in the retina and RPE from healthy controls (NOR) and AMD patients. c Specific and shared ATAC-Seq peaks in the retina and RPE. Each row represents one peak. The color represents the intensity of chromatin accessibility. Peaks are grouped based on K-means clustering and aligned at the center of regions. d Multidimensional scaling (MDS) of all retina and RPE samples
Fig. 2
Fig. 2
Changes of chromatin accessibility in AMD retinas. a The chromatin accessibility in regulatory regions of the rhodopsin gene RHO. Top panel shows average ATAC-Seq signal for each category. Bottom panel is the boxplot of log2-transformed ATAC-Seq signal for all samples (n = 11 for normal, 5 for early AMD, and 9 late AMD). One-way ANOVA test was performed. TSS, transcript start site. RER, rhodopsin enhancer region. UTR, untranslated region. b Changes of chromatin accessibility in AMD (n = 14) relative to normal (n = 11) in all retina samples. Each dot represents one ATAC-Seq peak. Blue line in the left panel indicates average fold changes of peaks with the same ATAC-Seq intensity. The percentage of reduced peaks is shown under the density curve in the right panel. c The microscopy of right and left eyes from one AMD patient with asymmetrical disease status. The left image shows early AMD (mild RPE pigmentary changes) while the right image shows geographic atrophy. Arrows indicate the macular regions. Note that human macula has a diameter of around 6 mm. d ATAC-Seq signal changes in right and left macular retinas from the AMD patient with asymmetrical disease status. e Accessibility changes in one AMD patient whose eyes are at the same (symmetrical) disease stage
Fig. 3
Fig. 3
Changes in chromatin accessibility in the RPE and at different disease stages. a Changes of chromatin accessibility in AMD (n = 12) relative to normal (n = 8) for all RPE samples. Blue line in the left panel indicates average fold changes of peaks. The percentage of reduced peaks is showed under the density curve. b, c Changes of chromatin accessibility in the RPE from donors whose eyes are at the different (asymmetrical) or the same (symmetrical) stage of disease. d The number of peaks in the retina and RPE with significantly decreased accessibility for early AMD (n = 5 for the retina, 4 for the RPE) vs. normal (n = 11 for the retina, 8 for the RPE) or late AMD (n = 9 for the retina, 8 for the RPE) vs. early AMD (late stage). e Average signal of ATAC-Seq peaks with differential accessibility at any stage of AMD. Error bars represent the standard error of mean. f The density curves of the stage coefficients in the fitting model of retina and RPE ATAC-Seq peaks
Fig. 4
Fig. 4
The regulation and expression associated with DARs in the retina and RPE. a Enriched TF motifs in footprints within DARs. b An example of footprint of OTX2 in MSH3 gene. An OTX2 footprint located at the intron of MSH3 was observed in the normal sample, decreased in the early-stage AMD, and absent from late-stage AMD sample. c Footprint occupancy scores (FOS) for OTX2 motifs in normal, early-stage, and late-stage AMD retinas. Student’s t-test was performed between normal samples and late-stage AMD samples. d Significantly enriched functions of DAR nearby genes from gene set enrichment analysis (GSEA). e The relationship of chromatin accessibility and RNA-Seq measured gene expression in retinas. f The density of differential expression in left vs. right retinas of the AMD patient. P value for Student’s t-test is shown
Fig. 5
Fig. 5
Chromatin accessibility changes in cigarette smoke-treated or HDAC11-overexpressed RPE cells. a Flow cytometric analysis of the expression of RPE specific markers RPE65 and RLBP1 from 12-week-old iPSC-derived RPE monolayers. Isotype was used as the control for gating strategy. b Changes in chromatin accessibility after cigarette smoke treatment. The average intensities of two replicates were used in the analysis. The percentage of reduced peaks is shown under the density curve in the right panel. c Comparison of chromatin accessibility changes in AMD RPE and cigarette smoke-treated RPE cells. d HDAC11 expression in peripheral RPE at different disease stages (n = 46 for normal, 9 for pre-AMD, and 14 for AMD). One-way ANOVA test was performed. The red symbol ‘ + ‘ indicates the outlier. The data are from NCBI GEO GSE29801. e HDAC11 and DAPI staining in the RPE cell. Scale bar, 50 µm. f Changes in chromatin accessibility with HDAC11 overexpression. g Comparison of accessibility changes in AMD RPE and HDAC11-overexpressed RPE cells. The gray dashed line is the fitting line. R is Pearson’s correlation coefficient

References

    1. Wong WL, et al. Age-related macular degeneration. N. Engl. J. Med. 2014;358:2606–2617. - PubMed
    1. Wong WL, et al. Global prevalence of age-related macular degeneration and disease burden projection for 2020 and 2040: a systematic review and meta-analysis. Lancet Glob. Health. 2014;2:e106–e116. doi: 10.1016/S2214-109X(13)70145-1. - DOI - PubMed
    1. Lim LS, Mitchell P, Seddon JM, Holz FG, Wong TY. Age-related macular degeneration. Lancet. 2012;379:1728–1738. doi: 10.1016/S0140-6736(12)60282-7. - DOI - PubMed
    1. Ambati J, Fowler BJ. Mechanisms of age-related macular degeneration. Neuron. 2012;75:26–39. doi: 10.1016/j.neuron.2012.06.018. - DOI - PMC - PubMed
    1. Fritsche LG, et al. A large genome-wide association study of age-related macular degeneration highlights contributions of rare and common variants. Nat. Genet. 2016;48:134–143. doi: 10.1038/ng.3448. - DOI - PMC - PubMed

Publication types

MeSH terms