. 2018 Apr 10;9(1):1324.
doi: 10.1038/s41467-018-03732-9.

Longer and more frequent marine heatwaves over the past century

Affiliations

Longer and more frequent marine heatwaves over the past century

Eric C J Oliver et al. Nat Commun. .

Abstract

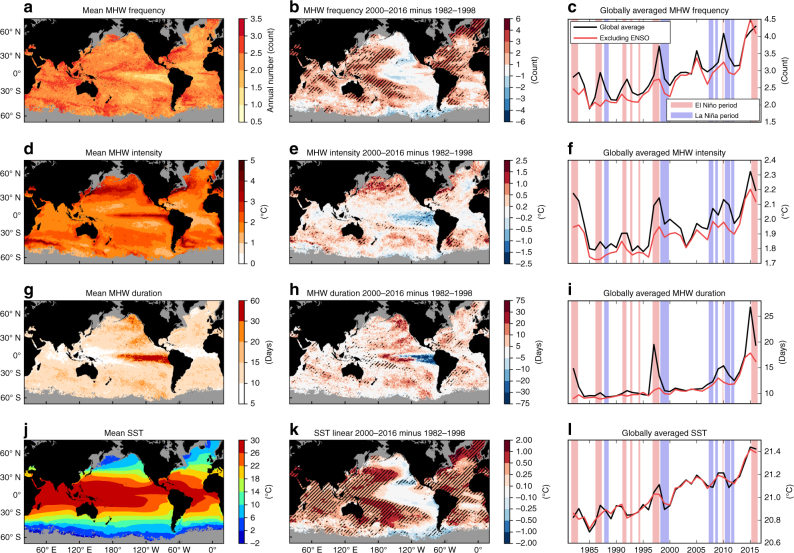
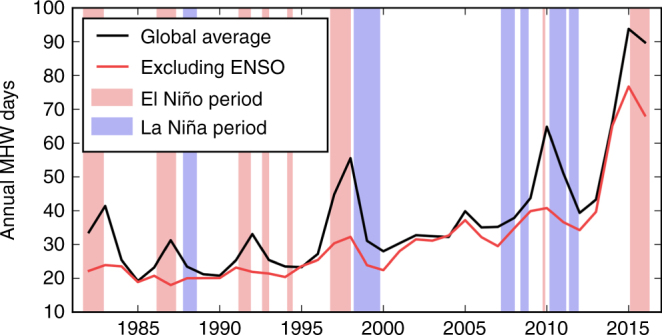
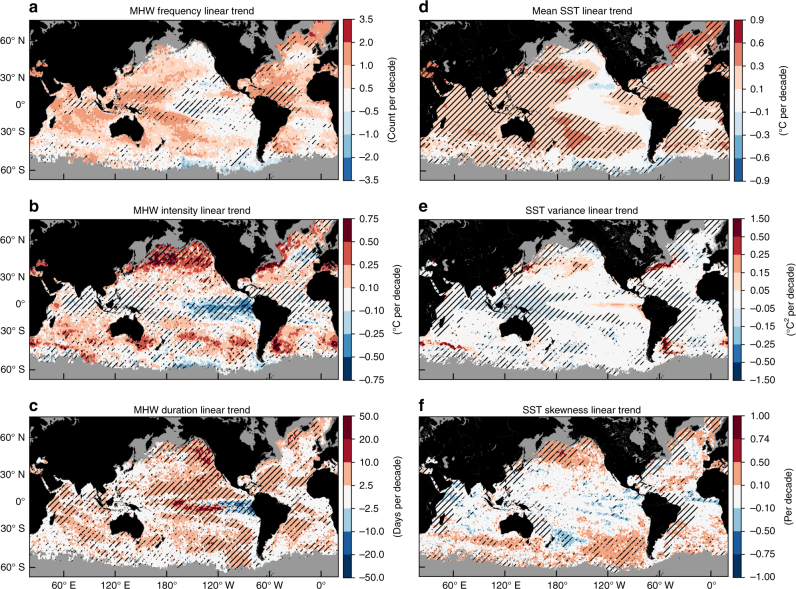
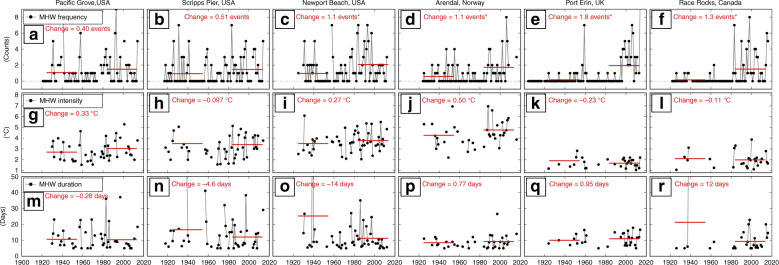
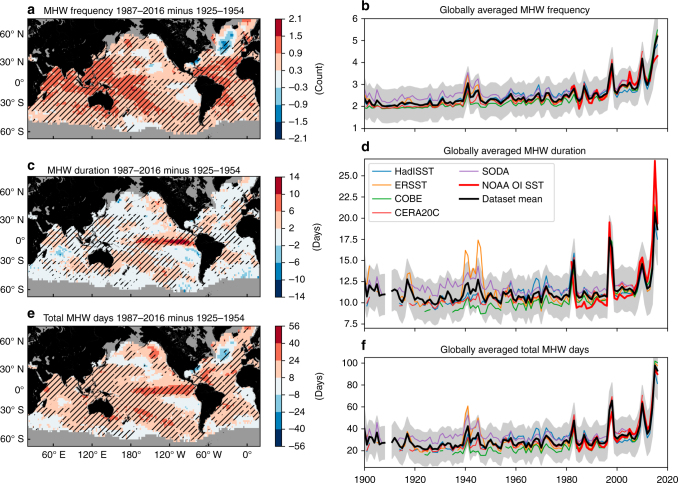
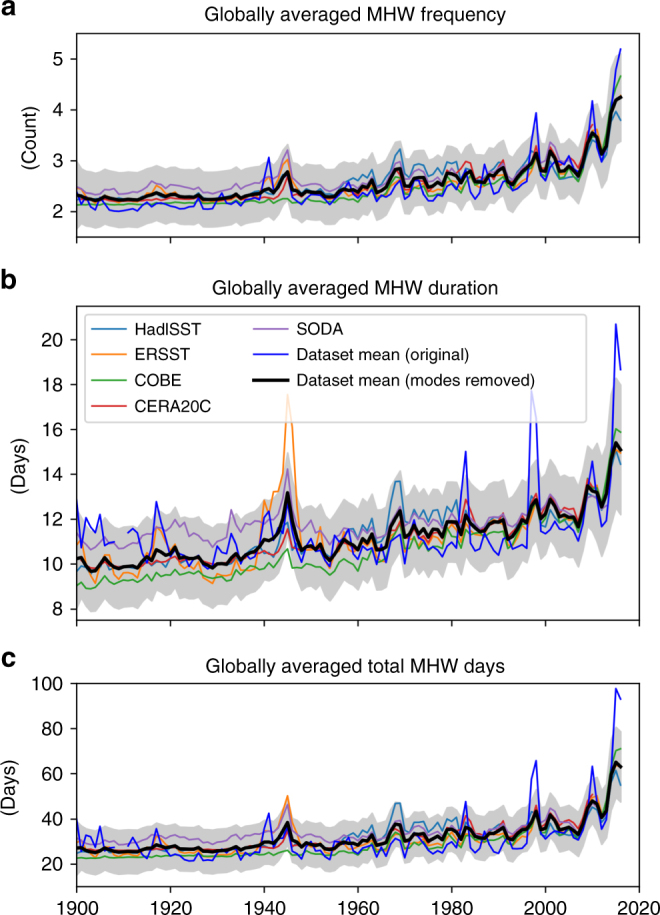
Heatwaves are important climatic extremes in atmospheric and oceanic systems that can have devastating and long-term impacts on ecosystems, with subsequent socioeconomic consequences. Recent prominent marine heatwaves have attracted considerable scientific and public interest. Despite this, a comprehensive assessment of how these ocean temperature extremes have been changing globally is missing. Using a range of ocean temperature data including global records of daily satellite observations, daily in situ measurements and gridded monthly in situ-based data sets, we identify significant increases in marine heatwaves over the past century. We find that from 1925 to 2016, global average marine heatwave frequency and duration increased by 34% and 17%, respectively, resulting in a 54% increase in annual marine heatwave days globally. Importantly, these trends can largely be explained by increases in mean ocean temperatures, suggesting that we can expect further increases in marine heatwave days under continued global warming.


Conflict of interest statement

The authors declare no competing interests.

Figures

Fig. 1
Fig. 1
Global sea surface temperature and marine heatwave properties. a, d, g, j Mean over the 1982–2016 period, b, e, h, k difference between the 1982–1998 and 2000–2016 periods, and c, f, i, l globally averaged time series of annual mean ac marine heatwave (MHW) count, df MHW intensity, gi MHW duration and jl SST from NOAA OI SST over 1982–2016. In b, e, h and k, hatching indicates the change is significantly different from zero at the 5% level. In c, f, i and l, the black lines show the globally averaged time series and red lines show a global average after removing the signature of ENSO. In c, f, i and l, the light red and blue shading indicate El Niño and La Niña periods, respectively, defined by periods exceeding ±1 s.d. of the MEI index for at least three consecutive months
Fig. 2
Fig. 2
Total number of marine heatwave days globally. Globally averaged time series of total marine heatwave (MHW) days from NOAA OI SST over 1982–2016. The black line shows the globally averaged time series of total MHW days from NOAA OI SST over 1982–2016. The red line shows this metric after removing the signature of ENSO. The light red and blue shading indicate El Niño and La Niña periods, respectively, defined by periods exceeding ±1 s.d. of the MEI index for three consecutive months
Fig. 3
Fig. 3
Identification of excess trends in marine heatwave properties globally. Shown are linear trends in a marine heatwave frequency, b marine heatwave intensity, c marine heatwave duration, d annual mean SST, e annual SST variance and f annual SST skewness from NOAA OI SST over 1982–2016. Hatching in ac indicates the linear trend is significantly different from what is expected solely due to the rise in the annual mean SST (at the 5% level), based on the statistical climate model. Hatching in df indicates the linear trend is significant from zero (p < 0.05)
Fig. 4
Fig. 4
Marine heatwave properties at six sites with century-long daily in situ temperature records. Shown are af the number of marine heatwaves (MHW) in each year, gl average annual MHW intensity, mr average annual MHW duration at Pacific Grove, Scripps Pier, Newport Beach (USA), Arendal (Norway), Port Erin (UK) and Race Rocks (Canada). Red lines show means over 1925–1954 and 1984–2013 and red text indicates differences between these periods (a star indicates statistical significance at the 5% level)
Fig. 5
Fig. 5
Centennial-scale changes in marine heatwave proxies derived from monthly gridded sea surface temperature data sets. a, c, e Difference between 1925–1954 and 1987–2016 and b, d, f globally averaged time series of annual a, b marine heatwave (MHW) frequency, c, d MHW duration and e, f total MHW days based on monthly proxies derived from all proxy data sets (data set mean) over 1900–2016. In a, c,e, hatching indicates that all five data sets agreed on the sign of the change (corresponding to 5% significance based on a binomial distribution) and grey areas indicate no data. The equivalent maps for each individual data set can be found in Supplementary Fig. 4. In b, d, f, globally averaged time series of MHW properties are shown for (thick red line) the NOAA OI SST 1982–2016 data, (thin coloured lines) the individual proxy data sets and (thick black line) the mean across all five proxy data sets. The shaded areas show the 95% confidence intervals based on proxy model errors, averaged across the five data sets (taking into account temporal covariance)
Fig. 6
Fig. 6
Influence of climate modes on marine heatwaves globally. Globally averaged time series of annual (first row) marine heatwave (MHW) frequency, (second row) duration and (third row) total MHW days based on monthly proxies over 1900–2016. Shown are the original results which include the influence of major global-scale climate modes (i.e., ENSO, PDO, AMO; blue lines) and results after the removal of their global signature (thin coloured lines and thick black lines). The shaded areas show the 95% confidence intervals based on model errors, averaged across proxy data sets (taking into account temporal covariance; after removal of climate modes). Note that the blue lines in this figure are identical to the black lines in Fig. 5

References

    1. Hobday A, et al. A hierarchical approach to defining marine heatwaves. Prog. Oceanogr. 2016;141:227–238. doi: 10.1016/j.pocean.2015.12.014. - DOI
    1. Sparnocchia S, Schiano ME, Picco P, Bozzano R, Cappelletti A. The anomalous warming of summer 2003 in the surface layer of the Central Ligurian Sea (Western Mediterranean) Ann. Geophys. 2006;24:443–452. doi: 10.5194/angeo-24-443-2006. - DOI
    1. Olita A, Sorgente R, Ribotti A, Natale S, Gaberšek S. Effects of the 2003 European heatwave on the Central Mediterranean Sea surface layer: a numerical simulation. Ocean Sci. Discuss. 2006;3:85–125. doi: 10.5194/osd-3-85-2006. - DOI
    1. Pearce AF, Feng M. The rise and fall of the ‘marine heat wave’ off Western Australia during the summer of 2010/11. J. Mar. Syst. 2013;112:139–156. doi: 10.1016/j.jmarsys.2012.10.009. - DOI
    1. Chen K, Gawarkiewicz GG, Lentz SJ, Bane JM. Diagnosing the warming of the Northeastern US Coastal Ocean in 2012: a linkage between the atmospheric jet stream variability and ocean response. J. Geophys. Res. Ocean. 2014;119:218–227. doi: 10.1002/2013JC009393. - DOI

Publication types

LinkOut - more resources