. 2018 Feb 14:2018:5180165.
doi: 10.1155/2018/5180165. eCollection 2018.

Herba Artemisiae Capillaris Extract Prevents the Development of Streptozotocin-Induced Diabetic Nephropathy of Rat

Affiliations

Herba Artemisiae Capillaris Extract Prevents the Development of Streptozotocin-Induced Diabetic Nephropathy of Rat

Jianan Geng et al. Evid Based Complement Alternat Med. .

Abstract

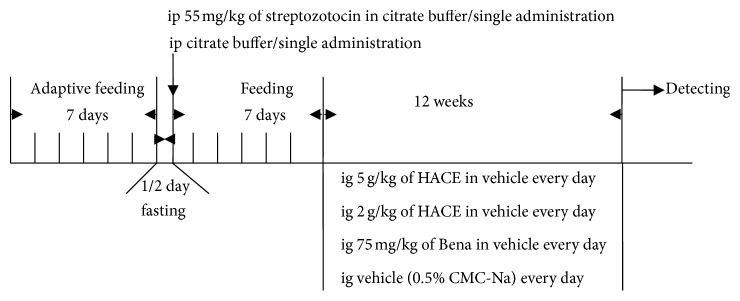
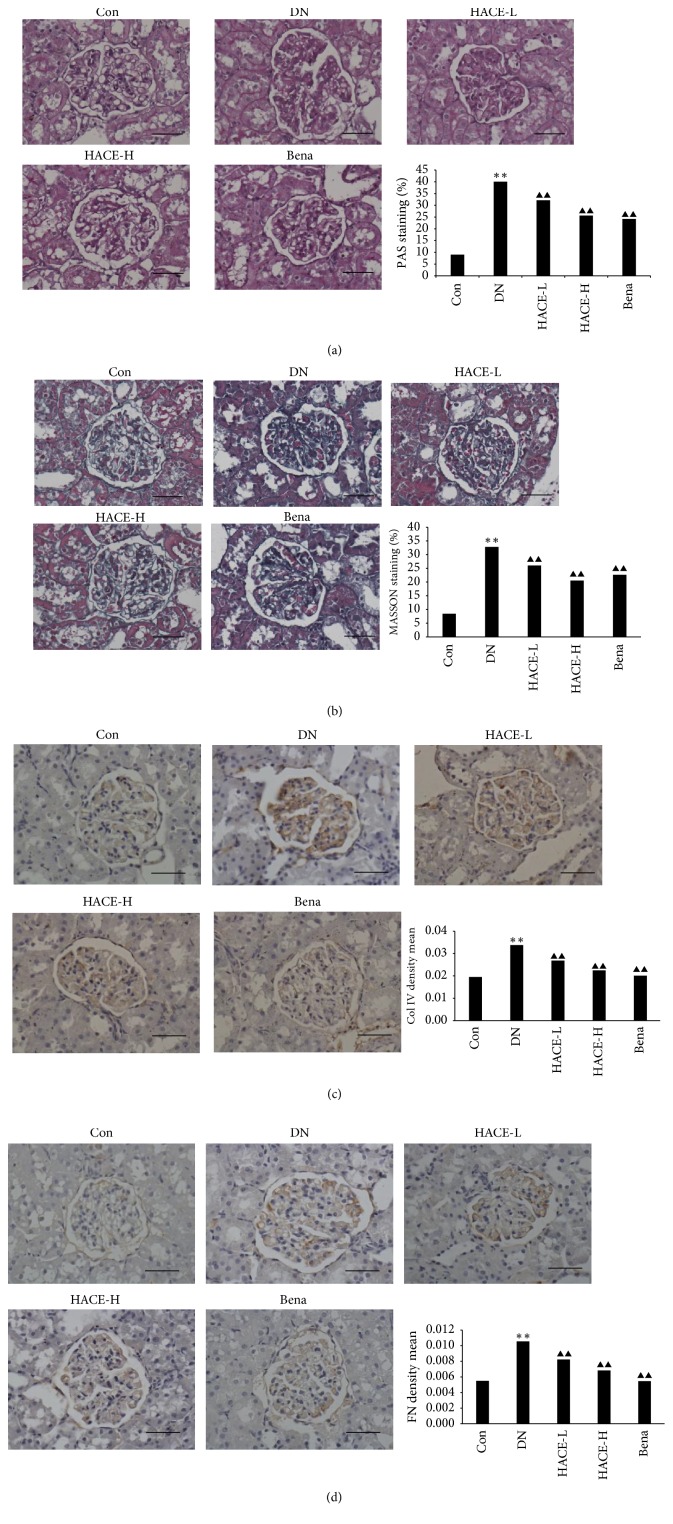
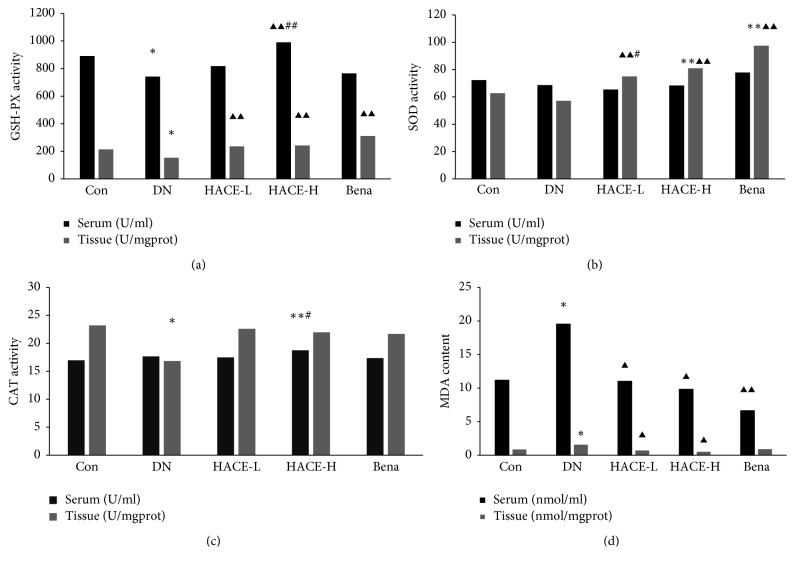
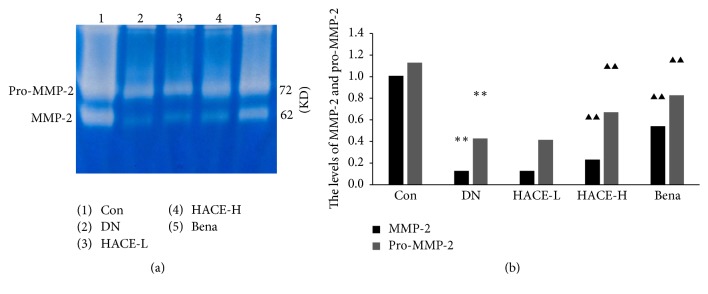
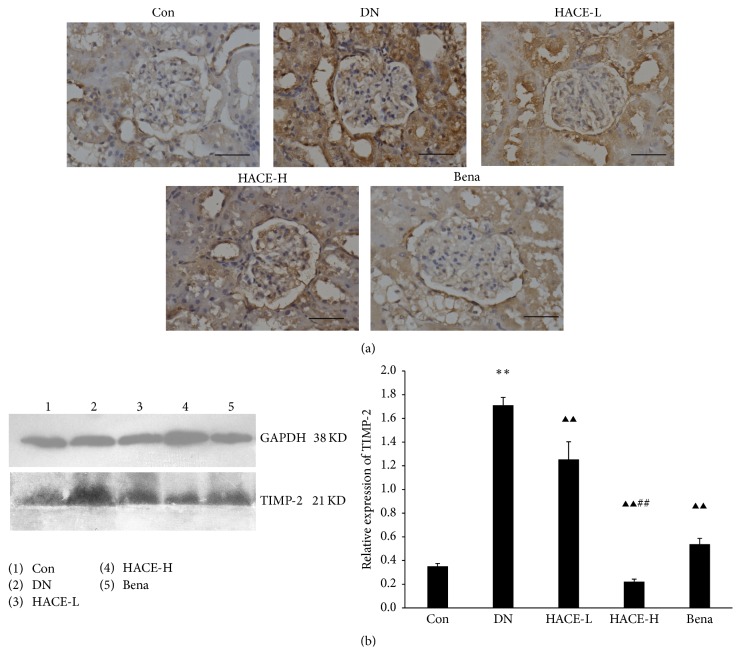
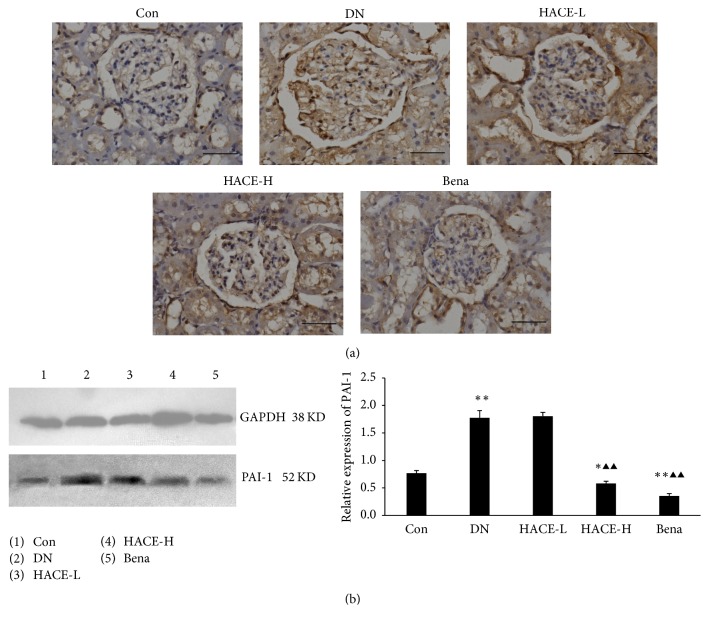
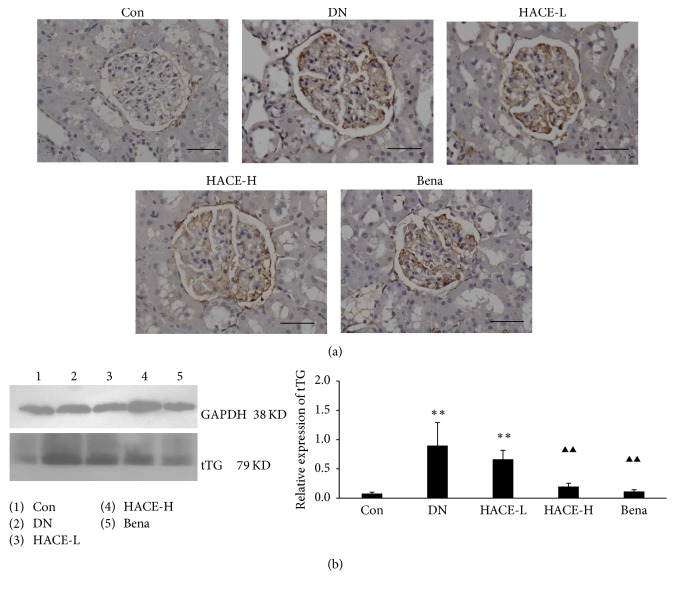
Diabetic nephropathy (DN) is a major cause of end-stage renal disease throughout the world; until now there is no specific drug available. In this work, we use herba artemisiae capillaris extract (HACE) to alleviate renal fibrosis characterized by the excessive accumulation of extracellular matrix (ECM) in rats, aiming to investigate the protective effect of the HACE on DN. We found that the intragastric treatment of high-dose HACE could reverse the effect of streptozotocin not only to decrease the level of blood glucose and blood lipid in different degree but also further to improve renal functions. It is worth mentioning that the effect of HACE treatment was comparable to the positive drug benazepril. Moreover, we found that HACE treatment could on one hand inhibit oxidative stress in DN rats through regulating enzymatic activity for scavenging reactive oxygen species and on the other hand increase the ECM degradation through regulating the activity of metalloproteinase-2 (MMP-2) and the expression of tissue transglutaminase (tTG), which explained why HACE treatment inhibited ECM accumulation. On the basis of above experimental results, we conclude that HACE prevents DN development in a streptozotocin-induced DN rat model, and HACE is a promising candidate to cure DN in clinic.


Figures

Figure 1
Figure 1
The time schedule of this study.
Figure 2
Figure 2
The effect of HACE treatment on the ECM accumulation in the diabetic kidney. ECM accumulation in the kidney was measured by PAS staining (a) and Masson staining (b) under a light microscope (×400). Quantitative analysis for the percentage of PAS and Masson in the glomerulus by the computer image analysis system is presented as the histogram. ((c) and (d)) Protein levels of type IV collagen (c) and fibronectin (d) as the two main components of ECM were detected by immunohistochemistry. Positive staining is shown in brown. Sections are counterstained with hematoxylin (magnification: ×400). Bar = 100 μm. Quantitative results of these stain photos are shown in the histogram, which represents the density mean (density mean = IOD/area). Each bar represents mean ± SD (n = 10). Con: nondiabetic control group; DN: streptozotocin-induced diabetic group; HACE-L: low-dose-HACE-treated group; HACE-H: high-dose-HACE-treated group; Bena: benazepril; Col IV: type IV collagen; FN: fibronectin. ∗∗P < 0.01 versus Con; ▲▲P < 0.01 versus DN.
Figure 3
Figure 3
The effect of HACE treatment on the activity of GSH-PX, SOD, CAT, and MDA. (a) GSH-PX activity. (b) SOD activity. (c) CAT activity. (d) MDA activity. Con: nondiabetic control group; DN: streptozotocin-induced diabetic group; HACE-L: low-dose-HACE-treated group; HACE-H: high-dose-HACE-treated group; Bena: benazepril; SOD: superoxide dismutase; CAT: hydrogen peroxidase; GSH-PX: glutathione peroxidase. Data are presented as mean ± SD from 10 animals (n = 10) for each group. P < 0.05 versus Con; ∗∗P < 0.01 versus Con; P < 0.05 versus DN; ▲▲P < 0.01 versus DN; #P < 0.05 versus Bena; ##P < 0.05 versus Bena.
Figure 4
Figure 4
The activity of MMP-2. (a) The activity of MMP-2 was detected by zymography; MMP-2 will hydrolyze the gelatin at corresponding position and reveal transparent visible band under blue background; the brightness of band represents the activity of the enzyme. 62 KD brand is the active form of MMP-2; 72 KD brand is the form of pro-MMP-2. (b) The relative value of MMP-2 and pro-MMP-2 activity. Enzyme volume = strip area × (band gray − background gray). The results were standardized to MMP-2 enzyme volume and normalized to 1.0 in control group. Con: nondiabetic control group; DN: streptozotocin-induced diabetic group; HACE-L: low-dose-HACE-treated group; HACE-H: high-dose-HACE-treated group; Bena: benazepril. ∗∗P < 0.01 versus Con; ▲▲P < 0.01 versus DN.
Figure 5
Figure 5
HACE suppressed the expression of TIMP-2 in kidney. (a) The expression of TIMP-2 by immunohistochemistry. Bar = 100 μm. (b) The expression of TIMP-2 by Western blot. GAPDH was shown as a loading control. The relative expression was the ratio of TIMP-2 to GAPDH conducted by densitometric analysis. Con: nondiabetic control group; DN: streptozotocin-induced diabetic group; HACE-L: low-dose-HACE-treated group; HACE-H: high-dose-HACE-treated group; Bena: benazepril. ∗∗P < 0.01 versus Con; ▲▲P < 0.01 versus DN; ##P < 0.05 versus Bena.
Figure 6
Figure 6
HACE suppressed the expression of PAI-1 in kidney of rats with diabetic nephropathy. (a) The expression of PAI-1 by immunohistochemistry. Bar = 100 μm. (b) The expression of PAI-1 by Western blot. GAPDH was shown as a loading control. The relative expression was the ratio of PAI-1 to GAPDH conducted by densitometric analysis. Con: nondiabetic control group; DN: streptozotocin-induced diabetic group; HACE-L: low-dose-HACE-treated group; HACE-H: high-dose-HACE-treated group; Bena: benazepril. P < 0.05 versus Con; ∗∗P < 0.01 versus Con; ▲▲P < 0.01 versus DN.
Figure 7
Figure 7
HACE treatment regulated the expression of tTG in glomeruli of rats with diabetic nephropathy. (a) The expression of tTG by immunohistochemistry. Bar = 100 μm. (b) The expression of tTG by Western blot. GAPDH was shown as a loading control. The relative expression was the ratio of tTG to GAPDH conducted by densitometric analysis. Con: nondiabetic control group; DN: streptozotocin-induced diabetic group; HACE-L: low-dose-HACE-treated group; HACE-H: high-dose-HACE-treated group; Bena: benazepril. ∗∗P < 0.01 versus Con; ▲▲P < 0.01 versus DN.

References

    1. Park C. W. Diabetic kidney disease: from epidemiology to clinical perspectives. Diabetes & Metabolism Journal. 2014;38(4):252–260. doi: 10.4093/dmj.2014.38.4.252. - DOI - PMC - PubMed
    1. Albers J. W., Pop-Busui R. Diabetic neuropathy: mechanisms, emerging treatments, and subtypes. Current Neurology and Neuroscience Reports. 2014;14(8, article 473) doi: 10.1007/s11910-014-0473-5. - DOI - PMC - PubMed
    1. de Boer I. H., Rue T. C., Hall Y. N., Heagerty P. J., Weiss N. S., Himmelfarb J. Temporal trends in the prevalence of diabetic kidney disease in the United States. Journal of the American Medical Association. 2011;305(24):2532–2539. doi: 10.1001/jama.2011.861. - DOI - PMC - PubMed
    1. Nentwich M. M., Ulbig M. W. Diabetic retinopathy—ocular complications of diabetes mellitus. World Journal of Diabetes. 2015;6(3):489–499. doi: 10.4239/wjd.v6.i3.489. - DOI - PMC - PubMed
    1. Tarquini R., Lazzeri C., Pala L., Rotella C. M., Gensini G. F. The diabetic cardiomyopathy. Acta Diabetologica. 2011;48(3):173–181. doi: 10.1007/s00592-010-0180-x. - DOI - PubMed

LinkOut - more resources