. 2018 Mar 15;10(3):1036-1052.
eCollection 2018.

Extracorporeal shock wave markedly alleviates radiation-induced chronic cystitis in rat

Affiliations

Extracorporeal shock wave markedly alleviates radiation-induced chronic cystitis in rat

Yen-Ta Chen et al. Am J Transl Res. .

Abstract

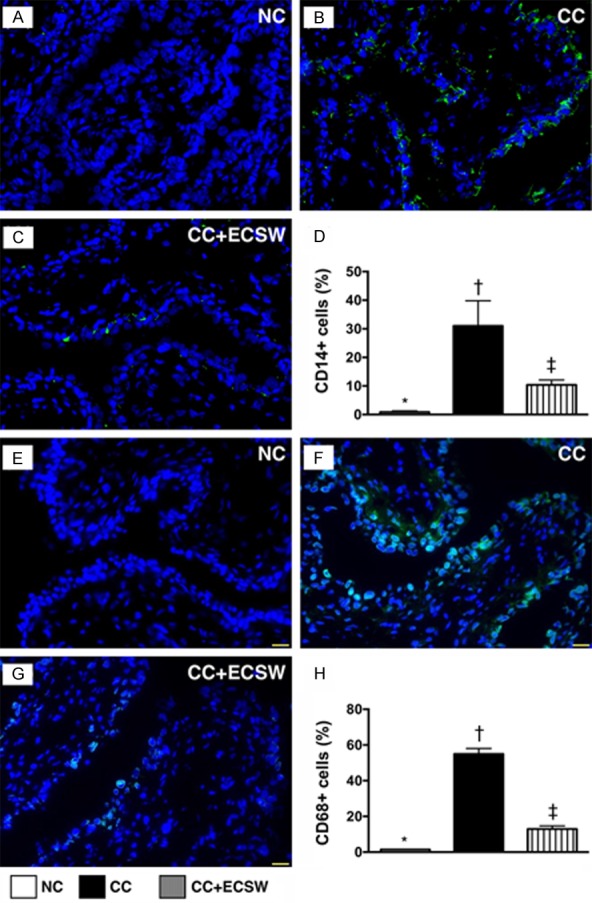
This study tested the hypothesis that extracorporeal shock wave (ECSW) treatment can effectively inhibit radiation-induced chronic cystitis (CC). Adult male Sprague-Dawley (SD) rats (n = 24) were randomly divided into group 1 (normal control), group 2 (CC induced by radiation with 300 cGy twice with a four-hour interval to the urinary bladder), group 3 [CC with ECSW treatment (0.2 mJ/mm2/120 impulses/at days 1, 7, and 14 after radiation)]. Bladder specimens were harvested by day 28 after radiation. By day 28 after radiation, the degree of detrusor contraction impairment was significantly higher in group 2 than that in groups 1 and 3, and significantly higher in group 3 than that in group 1 (P<0.0001). The urine albumin concentration expressed an opposite pattern compared to that of detrusor function among the three groups (P<0.0001). The bladder protein expressions of inflammatory (TLR-2/TLR-4/IL-6/IL-12/MMP-9/TNF-α/NF-κB/RANTES/iNOS) and oxidative-stress (NOX-1/NOX-2/oxidized protein) biomarkers exhibited a pattern identical to that of urine albumin in all groups (all P<0.0001). The cellular expressions of inflammatory (CD14+/CD68+/CD74+/COX-2/MIF+/substance P+) and cytokeratin (CK13+/HMW CK+/CK+17/CK+18/CK+19) biomarkers, and collagen-deposition/fibrotic areas as well as epithelial-damaged score displayed an identical pattern compared to that of urine albumin among the three groups (all P<0.0001). In conclusion, ECSW treatment effectively protected urinary bladder from radiation-induced CC.

Keywords: Chronic cystitis; extracorporeal shock wave; inflammation; oxidative stress; radiotherapy.


Conflict of interest statement

None.

Figures

Figure 1
Figure 1
Pilot study, albuminuria and inflammatory biomarkers in urine, and urodynamic test of bladder contraction by day 28 after CC induction. Upper panel: (A, B) For determining the suitable dosage of radiation energy, we initially utilized 600 cGy/twice with four h interval for each animal in CC (A) and CC + ECSW (B) groups (n = 3/each group). By day 28 after CC induction, the results showed that no detrusor contractility wave to be observed in either CC only or in CC + ECSW therapy animals. (C) Time courses of albumin concentration in 24-h urine: at day 1, *vs. other groups with different symbols (†, ‡), P<0.0001; at day 7, *vs. †, P<0.001; at day 14, *vs. other groups with different symbols (†, ‡), P<0.0001; at day 28, *vs. other groups with different symbols (†, ‡), P<0.0001. (D) ELISA result of interleukin (IL)-6 level in 24-h urine by day 28 after CC induction, *vs. other groups with different symbols (†, ‡), P<0.001. (E) ELISA result of tumor necrosis factor (TNF)-α level in 24-h urine by day 28 after CC induction, *vs. other groups with different symbols (†, ‡), P<0.001. Lower panel: (A-C) Illustrating the urodynamic patterns of bladder contraction in NC (A), CC (B) and CC-ECSW (C), respectively. significantly impaired detrusor contractility was identified in CC that was significantly reversed in animals with CC after receiving ECSW treatment. (D) Analytical result of detrusor contraction (mmHg) by day 28 after CC induction, *vs. other groups with different symbols (†, ‡), P<0.001. (E) Analytical result of mean time interval (second) of bladder contraction, *vs. †, P<0.001. All statistical analyses were performed by one-way ANOVA, followed by Bonferroni multiple comparison post hoc test (n = 6 for each group). Symbols (*, †, ‡) indicate significance at the 0.05 level. NC = normal control; CC = chronic cystitis; ECSW = extracorporeal shock wave.
Figure 2
Figure 2
Histopathological findings of urinary bladder at day 28 after CC induction. (A-C) H and E stain (400×) for identification of injury of epithelial layer. The integrity of epithelial layer in CC was destroyed (B) (green arrows) as compared with NC (A) that was preserved in CC after receiving ECSW therapy (C). (D) Analytical result of the injury score of epithelial layer by day 28 after CC induction, *vs. other groups with different symbols (†, ‡), P<0.001. (E-G) immunohistochemical staining (400×) demonstrating intensive expression of glycosaminoglycan (GAG) in epithelial layer of urinary bladder (pink color). (H) Quantitative analysis of GAG expression, *vs. other groups with different symbols (†, ‡), P<0.0001. (I) Quantification of vacuole formation (yellow arrows) in epithelial layer by day 28 after CC induction, solid square was the manifestation of dot-line square for identification of vacuole formation (yellow arrows), *vs. other groups with different symbols (†, ‡), P<0.0001. Scale bars in right lower corner represent 20 µm. All statistical analyses were performed by one-way ANOVA, followed by Bonferroni multiple comparison post hoc test (n = 6 for each group). Symbols (*, †, ‡) indicate significance at the 0.05 level. NC = normal control; CC = chronic cystitis; ECSW = extracorporeal shock wave.
Figure 3
Figure 3
CD14+ and CD68+ cell expression in urinary bladder at day 28 after CC induction. A-C. Illustrating immunofluorescent (IF) microscopic finding (400×) for identification of CD14+ cells (green color) in urinary bladder tissue by day 28 after CC induction. D. Analytical result of number of CD14+ cells by day 28 after CC induction, *vs. other groups with different symbols (†, ‡), P<0.0001. E-G. Illustrating IF microscopic finding (400×) for identification of CD68+ cells (green color) in urinary bladder tissue by day 28 after CC induction. H. Analytical result of number of CD68+ cells by day 28 after CC induction, *vs. other groups with different symbols (†, ‡), P<0.0001. All statistical analyses were performed by one-way ANOVA, followed by Bonferroni multiple comparison post hoc test (n = 6 for each group). Symbols (*, †, ‡) indicate significance at the 0.05 level. NC = normal control; CC = chronic cystitis; ECSW = extracorporeal shock wave.
Figure 4
Figure 4
COX-2+ and MIF+ cell infiltration in urinary bladder at day 28 after CC induction. A-C. Illustrating immunofluorescent (IF) microscopic finding (400×) for identification of COX-2+ cells (green color) in urinary bladder by day 28 after CC induction. D. Analytical result of number of COX-2+ cells by day 28 after CC induction, *vs. other groups with different symbols (†, ‡), P<0.0001. E-G. Illustrating IF microscopic finding (400×) for identification of macrophage migration inhibitor factor (MIF)+ cells (green color) in urinary bladder by day 28 after CC induction. H. Analytical result of number of MIF+ cells by day 28 after CC induction, *vs. other groups with different symbols (†, ‡), P<0.0001. All statistical analyses were performed by one-way ANOVA, followed by Bonferroni multiple comparison post hoc test (n = 6 for each group). Symbols (*, †, ‡) indicate significance at the 0.05 level. NC = normal control; CC = chronic cystitis; ECSW = extracorporeal shock wave.
Figure 5
Figure 5
Expressions of cytokeratin (CK)13+ and CK17+ cells in urinary bladder at day 28 after CC induction. A-C. Illustrating microscopic finding (400×) of immunohistochemical (IHC) staining for assessing the expression of CK13+ cells infiltrated in bladder (brown color) in urinary bladder by day 28 after CC induction. D. Analytical results of number of CK13+ cells by day 28 after CC induction, *vs. other groups with different symbols (†, ‡), P<0.0001. E-G. Microscopic finding (400×) of IHC staining for identification of the expression of CK17+ cells infiltrated in bladder (brown color) in urinary bladder by day 28 after CC induction. H. Analytical results of number of CK17+ cells by day 28 after CC induction, *vs. other groups with different symbols (†, ‡), P<0.0001. Scale bars in right lower corner represent 20 µm. All statistical analyses were performed by one-way ANOVA, followed by Bonferroni multiple comparison post hoc test (n = 6 for each group). Symbols (*, †, ‡) indicate significance at the 0.05 level. NC = normal control; CC = chronic cystitis; ECSW = extracorporeal shock wave.
Figure 6
Figure 6
Expressions of cytokeratin (CK)18+ and CK19+ cells in urinary bladder at day 28 after CC induction. A-C. Illustrating microscopic finding (400×) of immunohistochemical (IHC) staining for assessing the expression of CK18+ cells infiltrated in bladder (brown color) in urinary bladder by day 28 after CC induction. D. Analytical results of number of CK18+ cells by day 28 after CC induction, *vs. other groups with different symbols (†, ‡), P<0.0001. E-G. Microscopic finding (400×) of IHC staining for identification of the expression of CK19+ cells infiltrated in bladder (brown color) in urinary bladder by day 28 after CC induction. H. Analytical results of number of CK19+ cells by day 28 after CC induction, *vs. other groups with different symbols (†, ‡), P<0.0001. Scale bars in right lower corner represent 20 µm. All statistical analyses were performed by one-way ANOVA, followed by Bonferroni multiple comparison post hoc test (n = 6 for each group). Symbols (*, †, ‡) indicate significance at the 0.05 level. NC = normal control; CC = chronic cystitis; ECSW = extracorporeal shock wave.
Figure 7
Figure 7
Cellular expressions of DNA-damaged and inflammatory biomarkers in urinary bladder at day 28 after CC induction. A-C. Illustrating microscopic finding (400×) of immunofluorescent staining for assessing the expression of γ-H2AX+ cells infiltrated in bladder (pink color) in urinary bladder by day 28 after CC induction. D. Analytical results of number of γ-H2AX+ cells by day 28 after CC induction, *vs. other groups with different symbols (†, ‡), P<0.0001. E-G. Microscopic finding (400×) of Giemsa staining for identification of the expression of mast cells infiltrated in bladder (deep-blue color) by day 28 after CC induction. H. Analytical results of number of mast cells by day 28 after CC induction, *vs. other groups with different symbols (†, ‡), P<0.0001. Scale bars in right lower corner represent 20 µm. All statistical analyses were performed by one-way ANOVA, followed by Bonferroni multiple comparison post hoc test (n = 6 for each group). Symbols (*, †, ‡) indicate significance at the 0.05 level. NC = normal control; CC = chronic cystitis; ECSW = extracorporeal shock wave.
Figure 8
Figure 8
Condensed collagen-deposition and fibrotic areas in urinary bladder at day 28 after CC Induction. A-C. Illustrating the microscopic finding (400×) of Sirius stain for identification of condensed collagen-deposition area in urinary bladder (pink color) in urinary bladder by day 28 after CC induction. D. Analytical result of microscopic finding by day 28 after CC induction, *vs. other groups with different symbols (†, ‡), P<0.0001. E-G. Showing the microscopic finding (400×) of Masson’s trichrome stain for identification of fibrotic area in urinary bladder (blue color) in urinary bladder by day 28 after CC induction. H. Analytical result of microscopic finding by day 28 after CC induction, *vs. other groups with different symbols (†, ‡), P<0.0001. Scale bars in right lower corner represent 20 µm. All statistical analyses were performed by one-way ANOVA, followed by Bonferroni multiple comparison post hoc test (n = 6 for each group). Symbols (*, †, ‡) indicate significance at the 0.05 level. NC = normal control; CC = chronic cystitis; ECSW = extracorporeal shock wave.
Figure 9
Figure 9
Protein and cellular expressions of inflammatory biomarkers in urinary bladder at day 28 after CC Induction. A. Protein expression of interleukin (IL)-6 in urinary bladder by day 28 after CC induction, *vs. other groups with different symbols (†, ‡), P<0.001. B. Protein expression of IL-12 in urinary bladder by day 28 after CC induction, *vs. other groups with different symbols (†, ‡), P<0.001. C. Protein expression of matrix metalloproteinase (MMP)-9 in urinary bladder by day 28 after CC induction, *vs. other groups with different symbols (†, ‡), P<0.001. D. Protein expression of tumor necrosis factor (TNF)-α in urinary bladder by day 28 after CC induction, *vs. other groups with different symbols (†, ‡), P<0.001. E. Protein expression of nuclear factor (NF)-κB in urinary bladder by day 28 after CC induction, *vs. other groups with different symbols (†, ‡), P<0.001. F. Protein expression of RANTES in urinary bladder by day 28 after CC induction, *vs. other groups with different symbols (†, ‡), P<0.0001. G. Protein expression of inducible nitric oxide synthase (iNOS) in urinary bladder by day 28 after CC induction, *vs. other groups with different symbols (†, ‡), P<0.001. H-J. Illustrating IF microscopic finding (400x) for identification of substance P (SP)+ cells (green color) in urinary bladder by day 28 after CC induction. K. Analytical result of number of substance P+ cells by day 28 after CC induction, *vs. other groups with different symbols (†, ‡), P<0.0001. Scale bars in right lower corner represent 20 µm. All statistical analyses were performed by one-way ANOVA, followed by Bonferroni multiple comparison post hoc test (n = 6 for each group). Symbols (*, †, ‡) indicate significance at the 0.05 level. NC = normal control; CC = chronic cystitis; ECSW = extracorporeal shock wave.
Figure 10
Figure 10
Protein expressions of oxidative stress, tall-like receptor and apoptotic, fibrotic and anti-apoptotic biomarkers in urinary bladder at day 28 after CC Induction. Upper panel: A. Protein expression of NOX-1 in urinary bladder by day 28 after CC induction, *vs. other groups with different symbols (†, ‡), P<0.0001. B. Protein expression of NOX-2 in urinary bladder by day 28 after CC induction, *vs. other groups with different symbols (†, ‡), P<0.001. C. Oxidized protein expression in urinary bladder by day 28 after CC induction, * vs. other groups with different symbols (†, ‡), P<0.001. (Note: left and right lanes shown on the upper panel represent protein molecular weight marker and control oxidized molecular protein standard, respectively). M.W = molecular weight; DNP = 1-3 dinitrophenylhydrazone. D. Protein expression of tall-like receptor (TLR)-2 in urinary bladder by day 28 after CC induction, *vs. other groups with different symbols (†, ‡), P<0.001. E. Protein expression of TLR-4 in urinary bladder by day 28 after CC induction, * vs. other groups with different symbols (†, ‡), P<0.001. All statistical analyses were performed by one-way ANOVA, followed by Bonferroni multiple comparison post hoc test (n = 6 for each group). Symbols (*, †, ‡) indicate significance at the 0.05 level. NC = normal control; CC = chronic cystitis; ECSW = extracorporeal shock wave. Lower panel: A. Protein expression of mitochondrial Bax (mit-Bax) in urinary bladder by day 28 after CC induction, *vs. other groups with different symbols (†, ‡), P<0.001. B. Protein expression of cleaved caspase 3 (c-Casp 3) in urinary bladder by day 28 after CC induction, *vs. other groups with different symbols (†, ‡), P<0.001. C. Protein expression of cleaved poly (ADP-ribose) polymerase (c-PARP) in urinary bladder by day 28 after CC induction, *vs. other groups with different symbols (†, ‡), P<0.001. D. Protein expression of transforming growth factor (TGF)-ß in urinary bladder by day 28 after CC induction, * vs. other groups with different symbols (†, ‡, §), P<0.001. E. Protein expression of phosphorylated (p)-Smad3 in urinary bladder by day 28 after CC induction, *vs. other groups with different symbols (†, ‡), P<0.001. F. Protein expression of p-Smad1/5 in urinary bladder by day 28 after CC induction, *vs. other groups with different symbols (†, ‡), P<0.001. G. Protein expression of bone morphogenesis protein (BMP)-2 in urinary bladder by day 28 after CC induction, *vs. other groups with different symbols (†, ‡), P<0.001. All statistical analyses were performed by one-way ANOVA, followed by Bonferroni multiple comparison post hoc test (n = 6 for each group). Symbols (*, †, ‡) indicate significance at the 0.05 level. NC = normal control; CC = chronic cystitis; ECSW = extracorporeal shock wave.

References

    1. Stewart B, Wild C. World cancer report. Lyon CEDEX, France: 2014. Chap 5.12. 465-481.
    1. Alesawi AM, El-Hakim A, Zorn KC, Saad F. Radiation-induced hemorrhagic cystitis. Curr Opin Support Palliat Care. 2014;8:235–240. - PubMed
    1. Grellety T, Houede N, Hoepffner JL, Riviere J, Merino C, Lieutenant V, Gross-Goupil M, Richaud P, Dupin C, Sargos P, Roubaud G. Hemorrhagic cystitis in patients treated with cabazitaxel: a radiation recall syndrome? Ann Oncol. 2014;25:1248–1249. - PubMed
    1. Mendenhall WM, Henderson RH, Costa JA, Hoppe BS, Dagan R, Bryant CM, Nichols RC, Williams CR, Harris SE, Mendenhall NP. Hemorrhagic radiation cystitis. Am J Clin Oncol. 2015;38:331–336. - PubMed
    1. Payne H, Adamson A, Bahl A, Borwell J, Dodds D, Heath C, Huddart R, McMenemin R, Patel P, Peters JL, Thompson A. Chemical- and radiation-induced haemorrhagic cystitis: current treatments and challenges. BJU Int. 2013;112:885–897. - PMC - PubMed

LinkOut - more resources