. 2018 Mar 1;8(3):366-386.
eCollection 2018.

Anticancer efficacies of arsenic disulfide through apoptosis induction, cell cycle arrest, and pro-survival signal inhibition in human breast cancer cells

Affiliations

Anticancer efficacies of arsenic disulfide through apoptosis induction, cell cycle arrest, and pro-survival signal inhibition in human breast cancer cells

Yuxue Zhao et al. Am J Cancer Res. .

Abstract

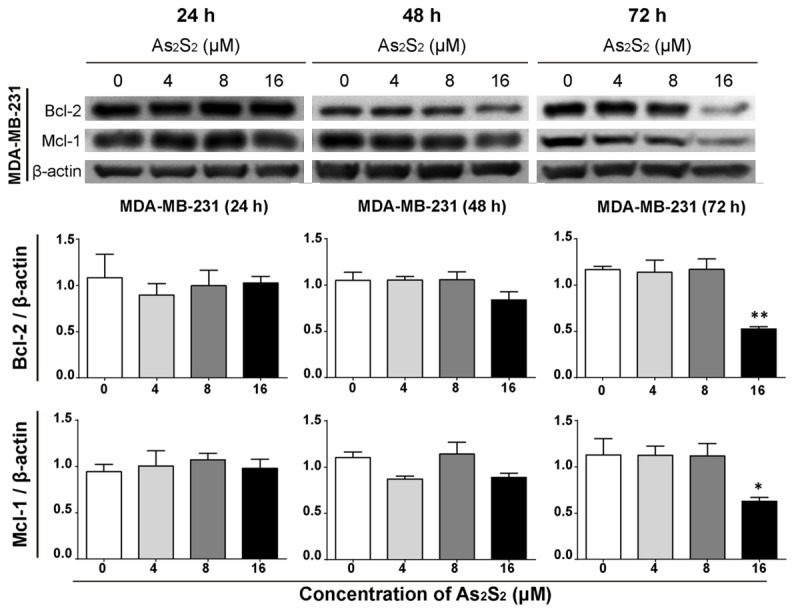
Arsenic disulfide, a major effective component of realgar, has been investigated for its anti-cancer potential and shown to have therapeutic efficacies in hematological and some solid tumors. However, its effect against breast cancer is rarely reported. In this study, we investigated the anti-cancer effects of As2S2 in human breast cancer cell lines MCF-7 and MDA-MB-231, and further elucidated its underlying mechanisms. As2S2 significantly inhibited cell viabilities, induced apoptosis, and led to cell cycle arrest in both cell lines with a dose- and time-dependent manner. As2S2 upregulated pro-apoptotic proteins like p53 and PARP in MCF-7 cells. Besides, As2S2 downregulated anti-apoptotic proteins like Bcl-2 and Mcl-1, as well as cell cycle-related proteins cyclin A2 and cyclin D1 in both cell lines. Of note, the expression level of cyclin B1 was downregulated in MCF-7 cells, whereas, upregulated in MDA-MB-231 cells. Moreover, As2S2 significantly inhibited the pro-survival signals in PI3K/Akt pathway in both cell lines. In conclusion, As2S2 inhibited cell viabilities, induced apoptosis and cell cycle arrest in both MCF-7 and MDA-MB-231 cell lines by regulating the expression of key proteins involved in related pathways. These results provide fundamental insights into the clinical application of As2S2 for treatment of patients with breast cancer.

Keywords: Arsenic disulfide; MCF-7; MDA-MB-231; apoptosis; cell cycle; cell viability.


Conflict of interest statement

None.

Figures

Figure 1
Figure 1
Effects of As2S2 on the viability of breast cancer cells. (A) MCF-7 and (B) MDA-MB-231 cells were treated with various concentrations of As2S2 (0, 4, 8, 12, 16, 20 and 24 µM) for 24 h (●), 48 h (□) and 72 h (▲), respectively, and the cell viability was assessed by CCK-8 assay procedures. All of the data were expressed as the mean ± SEM (n ≥ 3). Asterisks indicate significant differences between the control and the drug treatment groups (*P < 0.05, **P < 0.01, ***P < 0.001 and ****P < 0.0001).
Figure 2
Figure 2
Assessment of cell viability by calcein-AM staining. MCF-7 and MDA-MB-231 cells were seeded at the density of 5,000 cells per well. Cells were treated with a serial concentrations of As2S2 (0, 4, 8, 12 and 16 µM) for 24, 48 and 72 h, respectively. Viable cells exposed to calcein-AM showed bright green fluorescence. Images were taken and analyzed by a fluorescence Micro-plate reader (Operetta CLS, PerkinElmer, Japan) with 10 × objective (original magnifications 100 ×).
Figure 3
Figure 3
As2S2 triggers cell cycle arrest in MCF-7 cells. (A) MCF-7 cells were treated with various concentrations of As2S2 (0, 4, 8, 12 and 16 µM) for 24, 48 and 72 h. The peaks in the figure represent the G0/G1, S, and G2/M phases in the cell cycle, respectively. (B) The percentages of cell numbers in the cell cycle of MCF-7 cells after 24 h, (C) 48 h, and (D) 72 h of drug treatment. All data were expressed as the mean ± SEM (n ≥ 3). Asterisks indicate significant differences between the control (0 µM) and the drug treatment groups (*P < 0.05, **P < 0.01).
Figure 4
Figure 4
As2S2 triggers cell cycle arrest in MDA-MB-231 cells. (A) MDA-MB-231 cells were treated with serial concentrations of As2S2 (0, 4, 8, 12 and 16 µM) for 24, 48 and 72 h. The peaks in the figure represent the G0/G1, S, and G2/M phases in the cell cycle, respectively. (B) The percentages of cell numbers in the cell cycle of MDA-MB-231 cells after 24 h, (C) 48 h, and (D) 72 h of drug treatment. All data were expressed as the mean ± SEM (n ≥ 3). Asterisks indicate significant differences between the control (0 µM) and the drug treatment groups (*P < 0.05, **P < 0.01).
Figure 5
Figure 5
Effects of As2S2 on cell cycle regulators in MCF-7 cells. MCF-7 cells were cultured with various concentrations of As2S2 (0, 4, 8 and 16 µM) for 24, 48 and 72 h, and Western blot assays were carried out to examine the effects of As2S2 on the expressions of key proteins cyclin A2, cyclin B1 and cyclin D1 in MCF-7 cells after 24, 48 and 72 h of drug treatment. Protein β-actin was used as internal control. All images are representative of three independent analyses from three independent cellular preparations. Asterisks indicate significant differences between the control (0 µM) and the drug treatment groups (*P < 0.05, **P < 0.01).
Figure 6
Figure 6
Effects of As2S2 on cell cycle regulators in MDA-MB-231 cells. MDA-MB-231 cells were cultured with serial concentrations of As2S2 (0, 4, 8 and 16 µM) for 24, 48 and 72 h. Western blot assays were carried out to examine the effects of As2S2 on the expressions of key proteins cyclin A2, cyclin B1 and cyclin D1 in MDA-MB-231 cells after 24, 48 and 72 h of drug treatment. Protein β-actin was used as internal control. All images are representative of three independent analyses from three independent cellular preparations. Asterisks indicate significant differences between the control (0 µM) and the drug treatment groups (*P < 0.05, **P < 0.01).
Figure 7
Figure 7
As2S2 induces apoptosis in breast cancer cells. (A) MCF-7 and (B) MDA-MB-231 cells were treated with different concentrations of As2S2 (0, 4, 8, 12 and 16 µM) for 24, 48 and 72 h, followed by staining with Annexin V/PI, and then analyzed by flow cytometry. The cells were assessed for total apoptotic cells composed by early apoptotic (Annexin V+/PI-) and late apoptotic (Annexin V+/PI+) cells. The apoptotic index was defined as the ratio of total apoptotic cell percentages between As2S2 treatment groups (with concentrations of As2S2 as 4, 8, 12 and 16 µM) and the control (As2S2 as 0 µM). All data were expressed as the mean ± SEM (n ≥ 3). Asterisks indicate significant differences between the control and the drug treatment groups (*P < 0.05, **P < 0.01).
Figure 8
Figure 8
Effects of As2S2 on the expression levels of pro-apoptotic proteins in MCF-7 cells. MCF-7 cells were treated with different concentrations of As2S2 (0, 4, 8 and 16 µM) for 24, 48 and 72 h. Western blot assays were carried out to examine the effects of As2S2 on the expressions of pro-apoptotic proteins p53 and PARP in MCF-7 cells after 24, 48 and 72 h of drug treatment. Protein β-actin was used as internal control. All images are representative of three independent analyses from three independent cellular preparations. Asterisks indicate significant differences between the control (0 µM) and the drug treatment groups (*P < 0.05, **P < 0.01).
Figure 9
Figure 9
Effects of As2S2 on the expression levels of pro-apoptotic proteins in MDA-MB-231 cells. MDA-MB-231 cells were treated with different concentrations of As2S2 (0, 4, 8 and 16 µM) for 24, 48 and 72 h. Western blot assays were carried out to examine the effects of As2S2 on the expressions of pro-apoptotic proteins p53 and PARP in MDA-MB-231 cells after 24, 48 and 72 h of drug treatment. Protein β-actin was used as internal control. All images are representative of three independent analyses from three independent cellular preparations.
Figure 10
Figure 10
Effects of As2S2 on the expression levels of anti-apoptotic proteins in MCF-7 cells. MCF-7 cells were treated with different concentrations of As2S2 (0, 4, 8 and 16 µM) for 24, 48 and 72 h. Western blot assays were carried out to examine the effects of As2S2 on the expressions of anti-apoptotic proteins Bcl-2 and Mcl-1 in MCF-7 cells after 24, 48 and 72 h of drug treatment. Protein β-actin was used as internal control. All images are representative of three independent analyses from three independent cellular preparations. Asterisks indicate significant differences between the control (0 µM) and the drug treatment groups (*P < 0.05, **P < 0.01).
Figure 11
Figure 11
Effects of As2S2 on the expression levels of anti-apoptotic proteins in MDA-MB-231 cells. MDA-MB-231 cells were treated with different concentrations of As2S2 (0, 4, 8 and 16 µM) for 24, 48 and 72 h. Western blot assays were carried out to examine the effects of As2S2 on the expressions of anti-apoptotic proteins Bcl-2 and Mcl-1 in MDA-MB-231 cells after 24, 48 and 72 h of drug treatment. Protein β-actin was used as internal control. All images are representative of three independent analyses from three independent cellular preparations. Asterisks indicate significant differences between the control (0 µM) and the drug treatment groups (*P < 0.05, **P < 0.01).
Figure 12
Figure 12
Effects of As2S2 on the expression levels of pro-survival proteins in MCF-7 cells. MCF-7 cells were cultured with various concentrations of As2S2 (0, 4, 8 and 16 µM) for 24, 48 and 72 h. Western blot assays were carried out to examine the effects of As2S2 on the expressions of key proteins PI3K and Akt in MCF-7 cells after 24, 48 and 72 h of drug treatment. Protein β-actin was used as internal control. All images are representative of three independent analyses from three independent cellular preparations. Asterisks indicate significant differences between the control (0 µM) and the drug treatment groups (*P < 0.05, **P < 0.01).
Figure 13
Figure 13
Effects of As2S2 on the expression levels of pro-survival proteins in MDA-MB-231 cells. MDA-MB-231 cells were cultured with serial concentrations of As2S2 (0, 4, 8 and 16 µM) for 24, 48 and 72 h. Western blot assays were carried out to examine the effects of As2S2 on the expressions of key proteins PI3K and Akt in MDA-MB-231 cells after 24, 48 and 72 h of drug treatment. Protein β-actin was used as internal control. All images are representative of three independent analyses from three independent cellular preparations. Asterisks indicate significant differences between the control (0 µM) and the drug treatment groups (*P < 0.05, **P < 0.01).

Similar articles

Cited by

References

    1. Kamangar F, Dores GM, Anderson WF. Patterns of cancer incidence, mortality, and prevalence across five continents: defining priorities to reduce cancer disparities in different geographic regions of the world. J. Clin. Oncol. 2006;24:2137–2150. - PubMed
    1. Siegel R, Naishadham D, Jemal A. Cancer statistics, 2013. CA Cancer J Clin. 2013;63:11–30. - PubMed
    1. Liedtke C, Mazouni C, Hess KR, André F, Tordai A, Mejia JA, Symmans WF, Gonzalez-Angulo AM, Hennessy B, Green M, Cristofanilli M, Hortobagyi GN, Pusztai L. Response to neoadjuvant therapy and long-term survival in patients with triple-negative breast cancer. J. Clin. Oncol. 2008;26:1275–1281. - PubMed
    1. Huober J, von Minckwitz G, Denkert C, Tesch H, Weiss E, Zahm DM, Belau A, Khandan F, Hauschild M, Thomssen C, Högel B, Darb-Esfahani S, Mehta K, Loibl S. Effect of neoadjuvant anthracycline-taxane-based chemotherapy in different biological breast cancer phenotypes: overall results from the GeparTrio study. Breast Cancer Res Treat. 2010;124:133–140. - PubMed
    1. Emadi A, Gore SD. Arsenic trioxide-an old drug rediscovered. Blood Rev. 2010;24:191–199. - PMC - PubMed

LinkOut - more resources