. 2018 Feb 7;2(1):e000180.
doi: 10.1136/bmjpo-2017-000180. eCollection 2018.

Who perpetrates violence against children? A systematic analysis of age-specific and sex-specific data

Affiliations

Who perpetrates violence against children? A systematic analysis of age-specific and sex-specific data

Karen Devries et al. BMJ Paediatr Open. .

Abstract

Objective: The epidemiology of violence against children is likely to differ substantially by sex and age of the victim and the perpetrator. Thus far, investment in effective prevention strategies has been hindered by lack of clarity in the burden of childhood violence across these dimensions. We produced the first age-specific and sex-specific prevalence estimates by perpetrator type for physical, sexual and emotional violence against children globally.

Design: We used random effects meta-regression to estimate prevalence. Estimates were adjusted for relevant quality covariates, variation in definitions of violence and weighted by region-specific, age-specific and sex-specific population data to ensure estimates reflect country population structures.

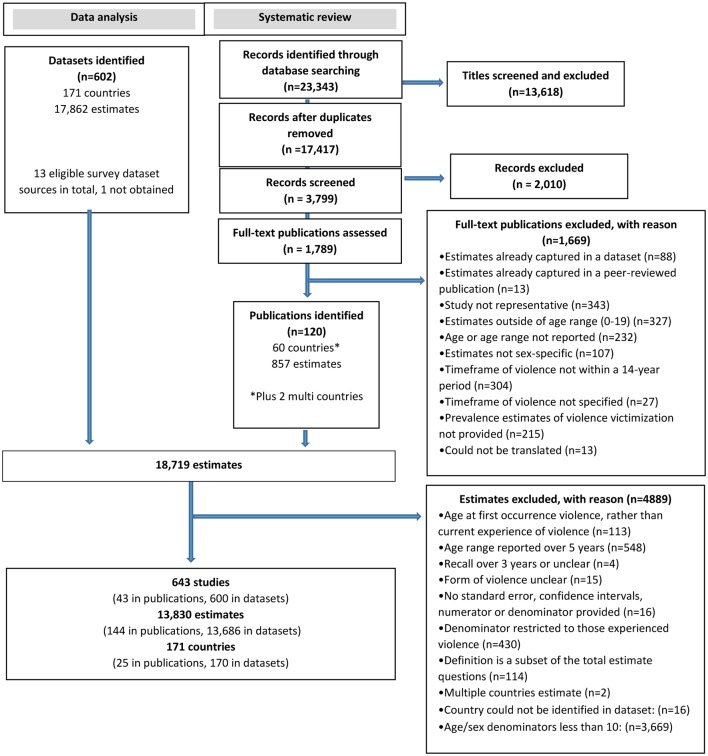
Data sources: Secondary data from 600 population or school-based representative datasets and 43 publications obtained via systematic literature review, representing 13 830 estimates from 171 countries.

Eligibility criteria for selecting studies: Estimates for recent violence against children aged 0-19 were included.

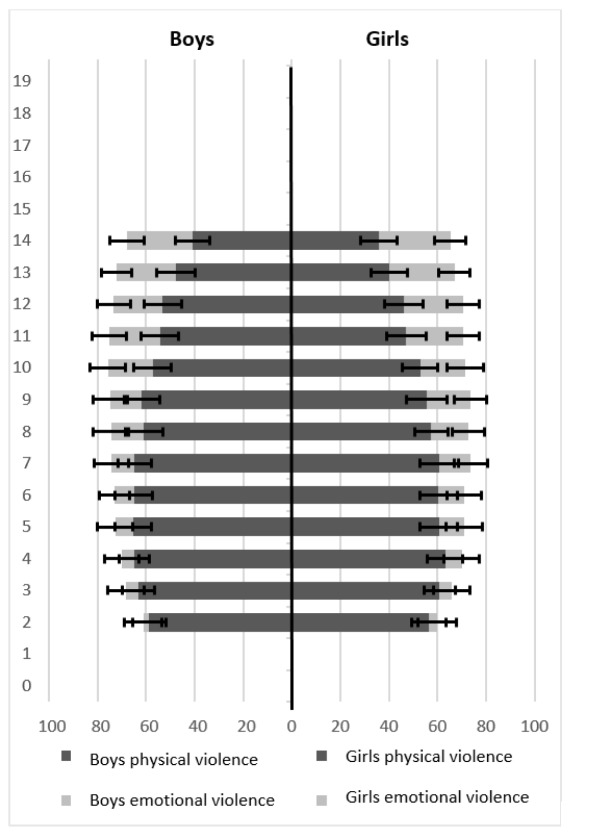
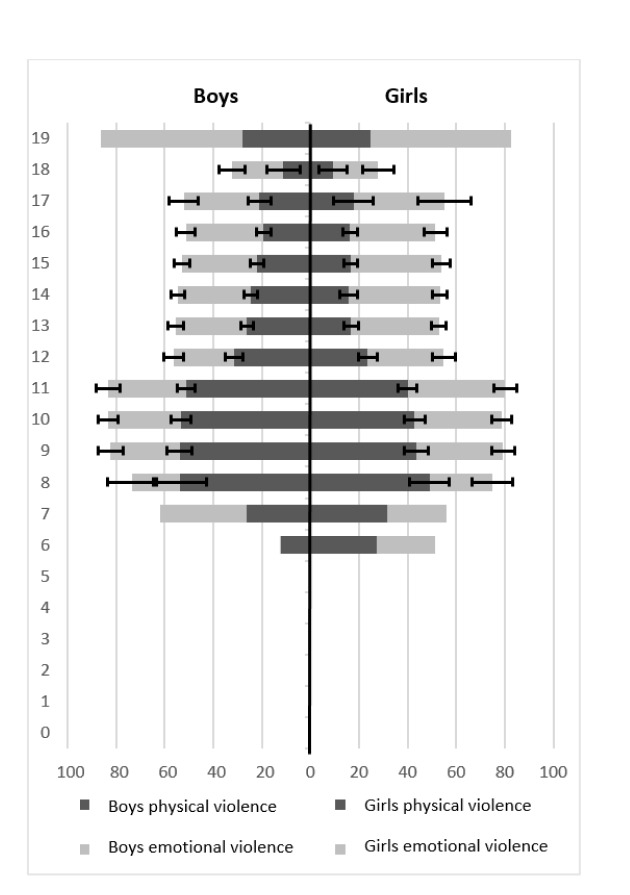
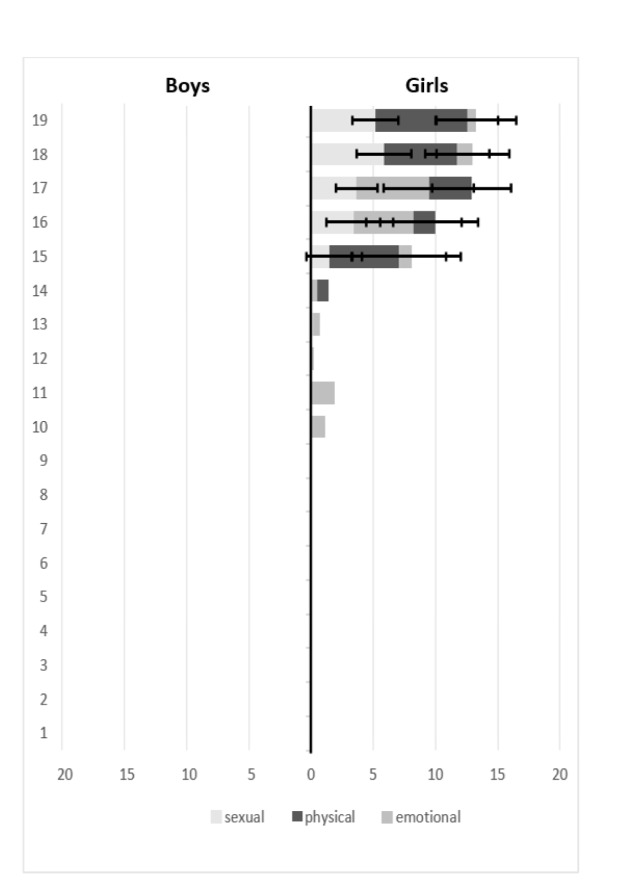
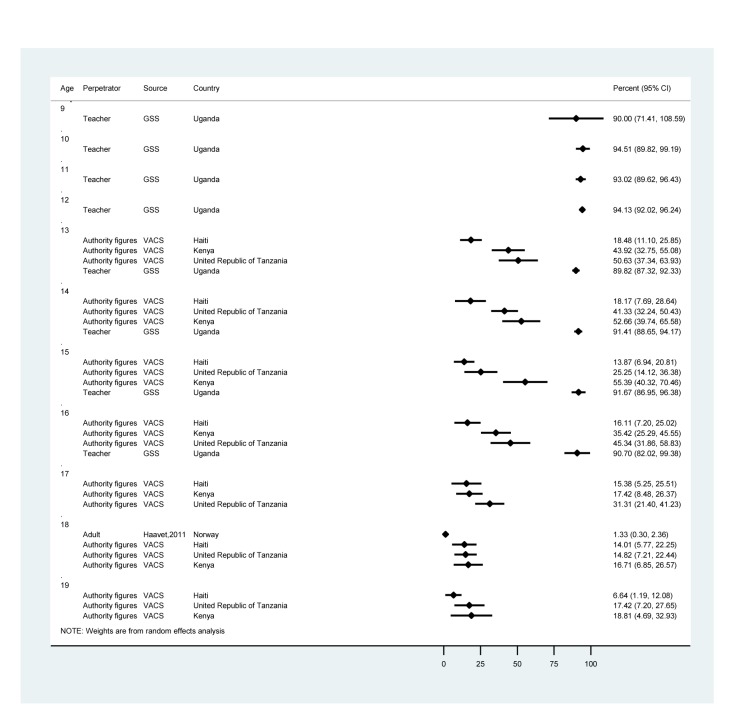
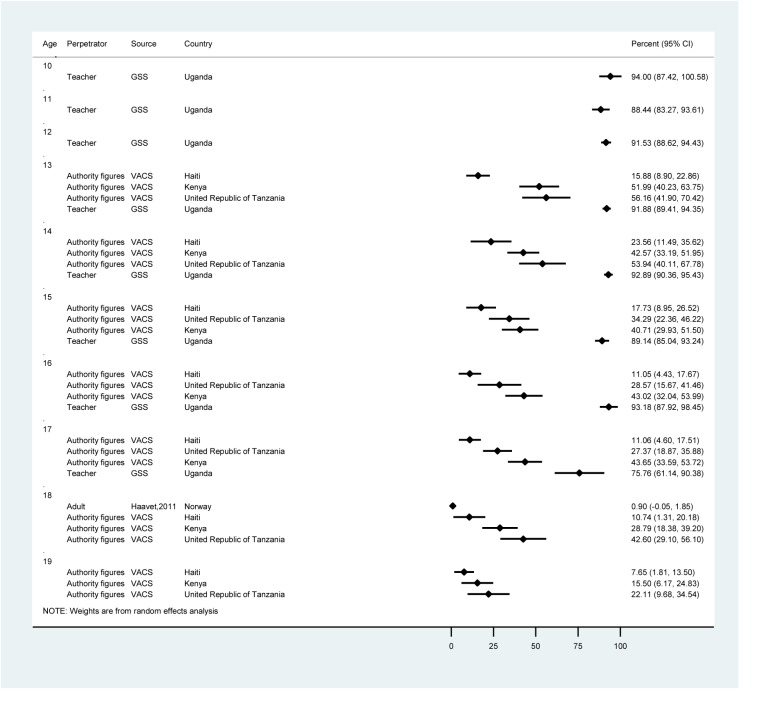
Results: The most common perpetrators of physical and emotional violence for both boys and girls across a range of ages are household members, with prevalence often surpassing 50%, followed by student peers. Children reported experiencing more emotional than physical violence from both household members and students. The most common perpetrators of sexual violence against girls aged 15-19 years are intimate partners; however, few data on other perpetrators of sexual violence against children are systematically collected internationally. Few age-specific and sex-specific data are available on violence perpetration by schoolteachers; however, existing data indicate high prevalence of physical violence from teachers towards students. Data from other authority figures, strangers, siblings and other adults are limited, as are data on neglect of children.

Conclusions: Without further investment in data generation on violence exposure from multiple perpetrators for boys and girls of all ages, progress towards Sustainable Development Goals 4, 5 and 16 may be slow. Despite data gaps, evidence shows violence from household members, peers in school and for girls, from intimate partners, should be prioritised for prevention.

Trial registration number: PROSPERO 2015: CRD42015024315.

Keywords: bullying; child abuse; intimate partner violence; school violence; violence against children.


Conflict of interest statement

Competing interests: None declared.

Figures

Figure 1
Figure 1
Flow chart describing data inclusion.
Figure 2
Figure 2
Prevalence of recent physical and emotional violence perpetrated by household members. Data sources: MICS, DHS. Model shows caregivers reports of physical aggression by household members. Definitions are provided in online supplementary annex 3 and exact prevalence numbers are provided in supplementary annex 5. To read bar graph: age of the child is on the y-axis; prevalence of each form of violence is on the x-axis. Prevalence corresponds to the distance of the bar along the x-axis for boys (to the left) and girls (to the right). Forms of violence are overlaid; and the black bars are a 95% CI. For example, for girls aged 2 years, the prevalence of physical violence is 56% (95% CI 49% to 63%), and the prevalence of emotional violence is 60% (95% CI 52% to 68%). DHS, Demographic and Health Surveys; MICS, Multiple Indicator Cluster Surveys.
Figure 3
Figure 3
Prevalence of physical and emotional violence perpetrated by students against boys and girls in the past 12 months. Data sources: GSHS, HBSC, PIRLS, TIMSS and systematic review publications. Model shows children’s self-reported exposure. Definitions are provided in online supplementary annex 3 and exact prevalence number are provided in online supplementary annex 5. Pooled prevalence estimates at ages 6, 7 and 19 years are from unadjusted meta-analyses, all others are adjusted meta-regression estimates. To read bar graph: age of the child is on the y-axis; prevalence of each form of violence is on the x-axis. Prevalence corresponds to the distance of the bar along the x-axis for boys (to the left) and girls (to the right). Forms of violence are overlaid; and the black bars are a 95% CI. For example, for boys aged 8 years, the prevalence of physical violence is 54% (95% CI 43 to 65) and the prevalence of emotional violence is 74% (95% CI 63% to 84%). Note that these estimates are for the entire population, not just school-attending boys and girls. GSHS, Global Student Health Surveys; HBSC, Health Behaviour in School-Aged Children; PIRLS, Progress in International Reading Literacy Study; TIMSS, Trends in International Mathematics and Science Study.
Figure 4
Figure 4
Prevalence of physical, emotional and sexual violence perpetrated by intimate or dating partners against boys and girls in the past 12 months. Data sources: DHS, WHO VAW, RHS, GSS and VACS (for physical violence only) and systematic review publications. Model shows children’s self-reported exposure. Definitions are provided in supplementary annex 3 and exact prevalence number are provided in online supplementary annex 5. Pooled prevalence estimates at ages 10, 11, 13 and 14 years are from unadjusted meta-analyses all others are adjusted meta-regression estimates. To read bar graph: age of the child is on the y-axis; prevalence of each form of violence is on the x-axis. Prevalence corresponds to the distance of the bar along the x-axis for boys (to the left) and girls (to the right). Forms of violence are overlaid; and the black bars are a 95% CI. For example, for girls aged 19 years, the prevalence of sexual violence is 5.2% (95% CI 3.3% to 7.0%); the prevalence of physical violence is 12.6% (95% CI 10.1% to 15.0%); and the prevalence of emotional violence is 13.24% (95% CI 10.01% to 16.47%). Note that these estimates are for the entire population, not just ever-partnered boys and girls. DHS, Demographic and Health Surveys; GSHS, Global Student Health Surveys; GSS, Good Schools Study; HBSC, Health Behaviour in School-Aged Children; RHS, Reproductive Health Surveys; VACS, Violence Against Children Surveys; WHO VAW, WHO Multi-Country Study on Women’s Health and Domestic Violence against Women.
Figure 5
Figure 5
Prevalence of physical violence perpetrated by teachers, other authority figures and other adults against girls in the past 12 months. Estimates are children’s self-reported exposure. Definitions are provided in online supplementary annex 3. To read the forest plot: for each year of age, perpetrator, data source and country are described along the y-axis. Along the x-axis, prevalence estimates from each are represented by a dot, with a bar drawn through to represent the 95% CI. GSS, Good Schools Study; VACS, Violence Against Children Surveys.
Figure 6
Figure 6
Prevalence of recent physical violence perpetrated by teachers, other authority figures and other adults against boys in the past 12 months. Estimates are children’s self-reported exposure. Definitions are provided in online supplementary annex 3. To read the forest plot: for each year of age, perpetrator, data source and country are described along the y-axis. Along the x-axis, prevalence estimates from each are represented by a dot, with a bar drawn through to represent the 95% CI. GSS, Good Schools Study; VACS, Violence Against Children Surveys.

References

    1. Hillis S, Mercy J, Amobi A, et al. . Global prevalence of past-year violence against children: a systematic review and minimum estimates. Pediatrics 2016;137:e20154079 doi:10.1542/peds.2015-4079 - DOI - PMC - PubMed
    1. Pereda N, Guilera G, Forns M, et al. . The international epidemiology of child sexual abuse: a continuation of Finkelhor (1994). Child Abuse Negl 2009;33:331–42. doi:10.1016/j.chiabu.2008.07.007 - DOI - PubMed
    1. Stoltenborgh M, van Ijzendoorn MH, Euser EM, et al. . A global perspective on child sexual abuse: meta-analysis of prevalence around the world. Child Maltreat 2011;16:79–101. doi:10.1177/1077559511403920 - DOI - PubMed
    1. De Bellis MD, Hooper SR, Sapia JL. Early trauma exposure and the brain., 2005.
    1. Andersen SL, Tomada A, Vincow ES, et al. . Preliminary evidence for sensitive periods in the effect of childhood sexual abuse on regional brain development. J Neuropsychiatry Clin Neurosci 2008;20:292–301. doi:10.1176/jnp.2008.20.3.292 - DOI - PMC - PubMed

LinkOut - more resources