

Stacked generalization: an introduction to super learning
- PMID: 29637384
- PMCID: PMC6089257
- DOI: 10.1007/s10654-018-0390-z
Stacked generalization: an introduction to super learning
Abstract
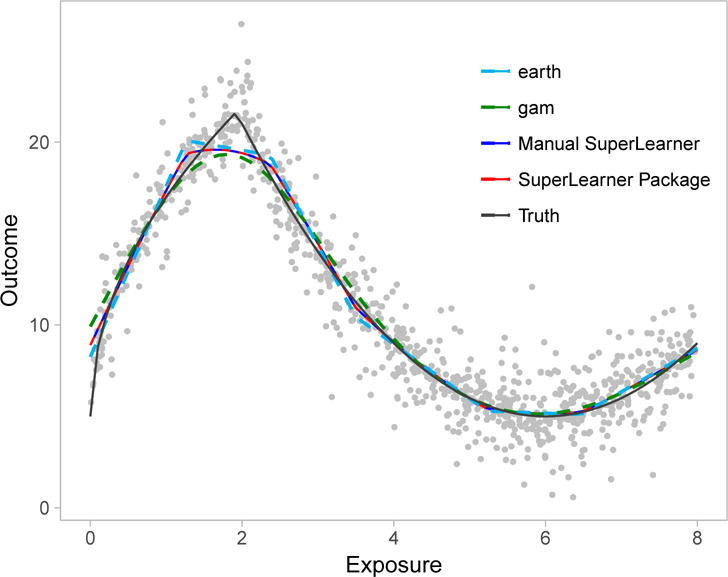
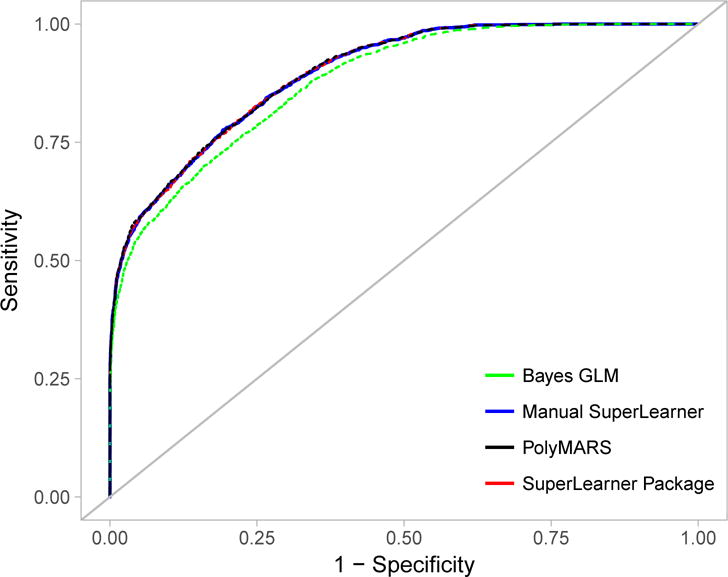
Stacked generalization is an ensemble method that allows researchers to combine several different prediction algorithms into one. Since its introduction in the early 1990s, the method has evolved several times into a host of methods among which is the "Super Learner". Super Learner uses V-fold cross-validation to build the optimal weighted combination of predictions from a library of candidate algorithms. Optimality is defined by a user-specified objective function, such as minimizing mean squared error or maximizing the area under the receiver operating characteristic curve. Although relatively simple in nature, use of Super Learner by epidemiologists has been hampered by limitations in understanding conceptual and technical details. We work step-by-step through two examples to illustrate concepts and address common concerns.
Keywords: Ensemble learning; Machine learning; Stacked generalization; Stacked regression; Super Learner.
Conflict of interest statement
Conflicts of Interest: None
Figures
Similar articles
-
Optimal Spatial Prediction Using Ensemble Machine Learning.Int J Biostat. 2016 May 1;12(1):179-201. doi: 10.1515/ijb-2014-0060. Int J Biostat. 2016. PMID: 27130244
-
Super learner.Stat Appl Genet Mol Biol. 2007;6:Article25. doi: 10.2202/1544-6115.1309. Epub 2007 Sep 16. Stat Appl Genet Mol Biol. 2007. PMID: 17910531
-
Constrained binary classification using ensemble learning: an application to cost-efficient targeted PrEP strategies.Stat Med. 2018 Jan 30;37(2):261-279. doi: 10.1002/sim.7296. Epub 2017 Apr 6. Stat Med. 2018. PMID: 28384841 Free PMC article.
-
Predicting inflation component drivers in Nigeria: a stacked ensemble approach.SN Bus Econ. 2023;3(1):9. doi: 10.1007/s43546-022-00384-2. Epub 2022 Dec 9. SN Bus Econ. 2023. PMID: 36531599 Free PMC article. Review.
-
You are smarter than you think: (super) machine learning in context.Eur J Epidemiol. 2018 May;33(5):437-440. doi: 10.1007/s10654-018-0405-9. Epub 2018 May 9. Eur J Epidemiol. 2018. PMID: 29744711 Free PMC article. Review.
Cited by
-
Prediction of persistent acute kidney injury in postoperative intensive care unit patients using integrated machine learning: a retrospective cohort study.Sci Rep. 2022 Oct 12;12(1):17134. doi: 10.1038/s41598-022-21428-5. Sci Rep. 2022. PMID: 36224308 Free PMC article.
-
Differential Patterns of Delayed Emotion Circuit Maturation in Abused Girls With and Without Internalizing Psychopathology.Am J Psychiatry. 2021 Nov;178(11):1026-1036. doi: 10.1176/appi.ajp.2021.20081192. Epub 2021 Aug 19. Am J Psychiatry. 2021. PMID: 34407623 Free PMC article.
-
SpiderLearner: An ensemble approach to Gaussian graphical model estimation.Stat Med. 2023 Jun 15;42(13):2116-2133. doi: 10.1002/sim.9714. Epub 2023 Apr 2. Stat Med. 2023. PMID: 37004994 Free PMC article.
-
Machine learning-based strategies for improving healthcare data quality: an evaluation of accuracy, completeness, and reusability.Front Artif Intell. 2025 Jul 21;8:1621514. doi: 10.3389/frai.2025.1621514. eCollection 2025. Front Artif Intell. 2025. PMID: 40761812 Free PMC article.
-
New research progress on 18F-FDG PET/CT radiomics for EGFR mutation prediction in lung adenocarcinoma: a review.Front Oncol. 2023 Nov 29;13:1242392. doi: 10.3389/fonc.2023.1242392. eCollection 2023. Front Oncol. 2023. PMID: 38094613 Free PMC article. Review.
References
-
- Wolpert D. Stacked generalization. Neural Networks. 1992;5:241–59.
-
- Breiman L. Stacked regressions. Machine Learning. 1996;24:49–64.
-
- van der Laan M, Dudoit S. Technical Report 30. Division of Biostatistics, University of California; Berkeley: 2003. Unified Cross-Validation Methodology For Selection Among Estimators and a General Cross-Validated Adaptive Epsilon-Net Estimator: Finite Sample Oracle Inequalities and Example.
-
- van der Laan M, Dudoit S, van der Vaart AW. The cross-validated adaptive epsilon-net estimator. Statistics & Decision. 2006;24:373.
-
- van der Laan MJ, Polley EC, Hubbard AE. Super learner. Statistical Applications in Genetics and Molecular Biology. 2007;6 Article 25. - PubMed
Publication types
MeSH terms
Grants and funding
LinkOut - more resources
Full Text Sources
Other Literature Sources
