. 2018 Aug;98(4):e21464.
doi: 10.1002/arch.21464. Epub 2018 Apr 10.

Overexpression of antimicrobial peptides contributes to aging through cytotoxic effects in Drosophila tissues

Affiliations

Overexpression of antimicrobial peptides contributes to aging through cytotoxic effects in Drosophila tissues

Marziyeh Badinloo et al. Arch Insect Biochem Physiol. 2018 Aug.

Abstract

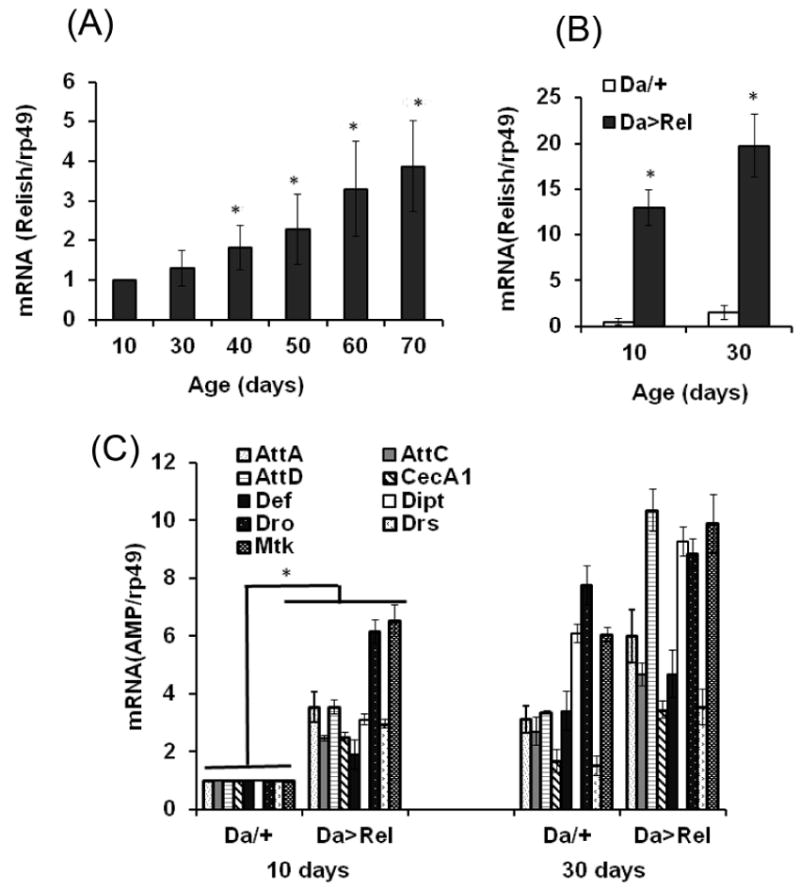
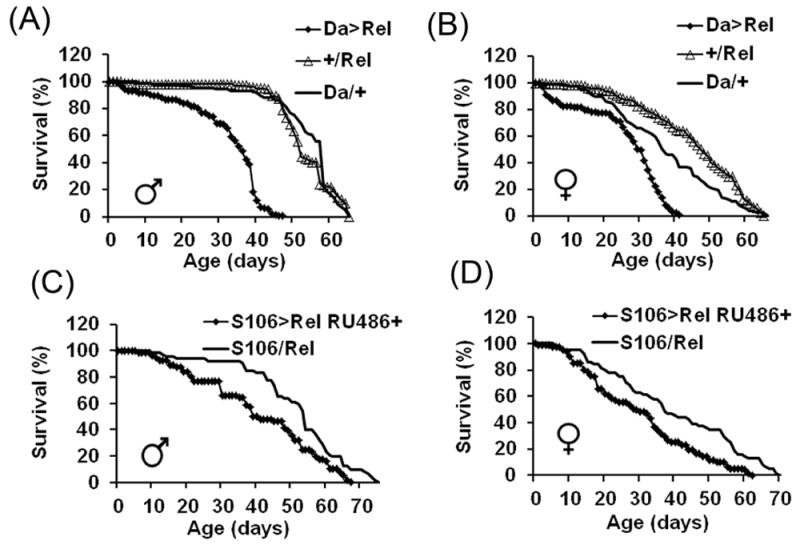
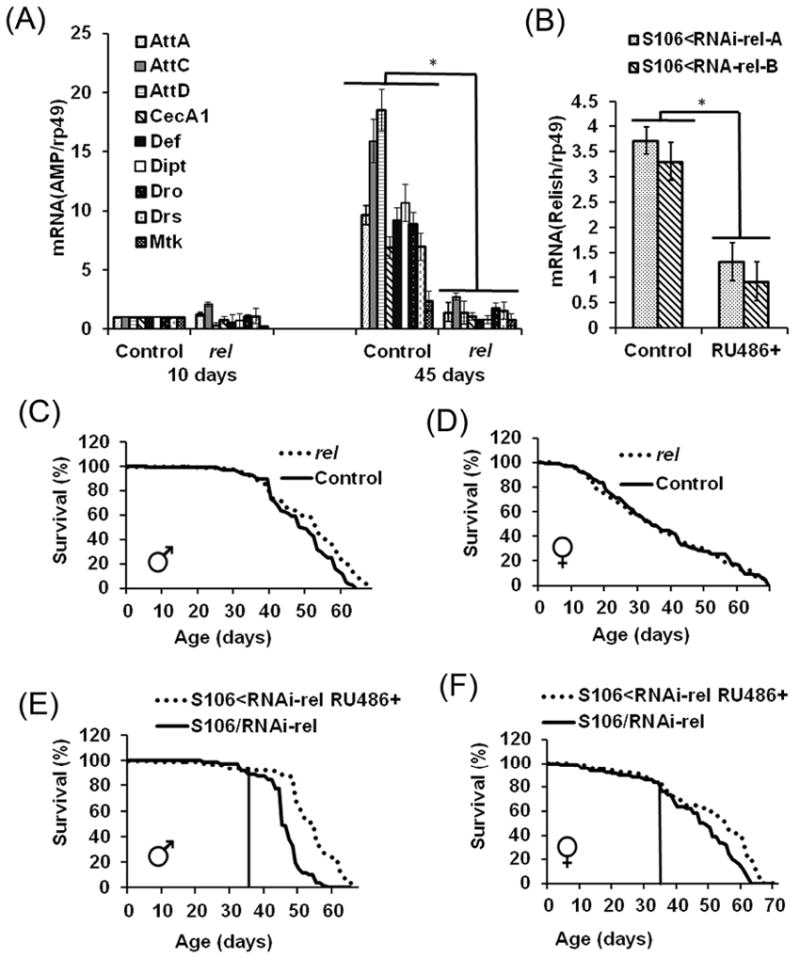
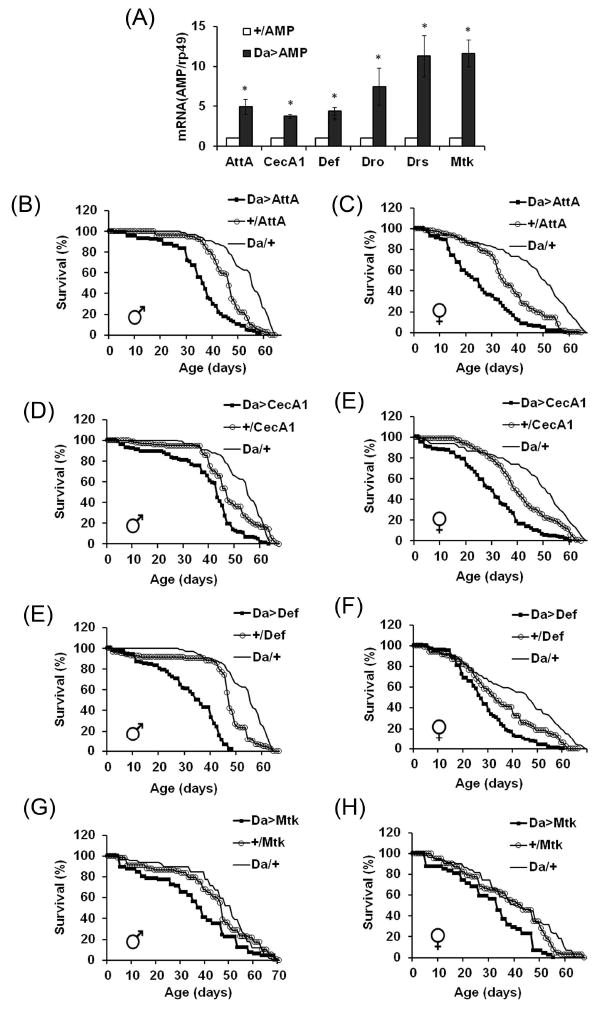
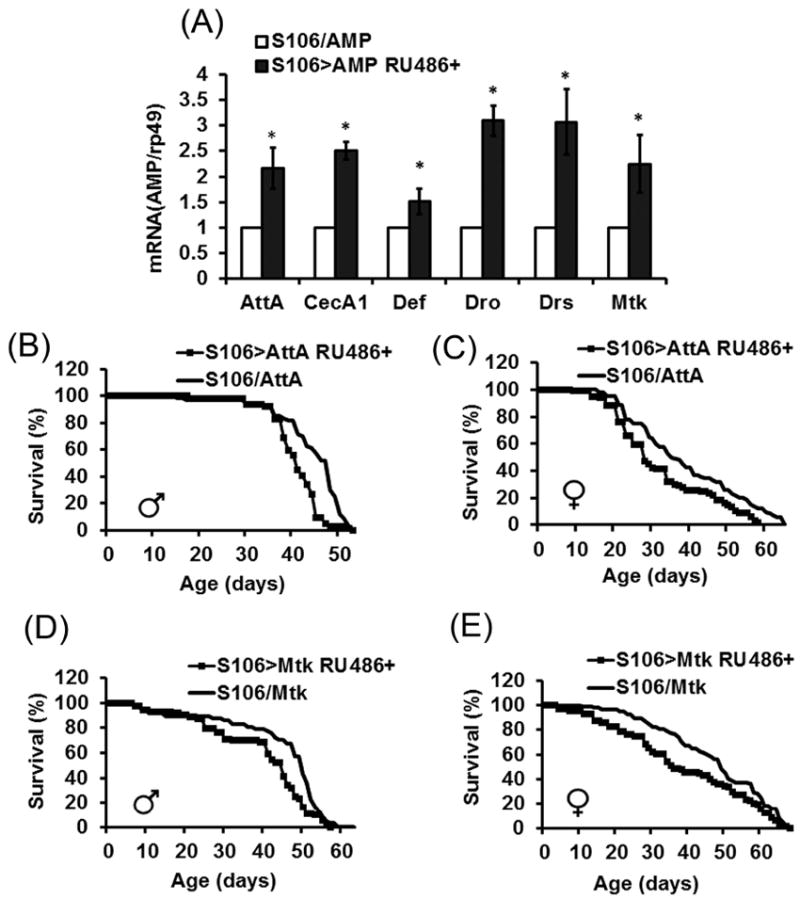
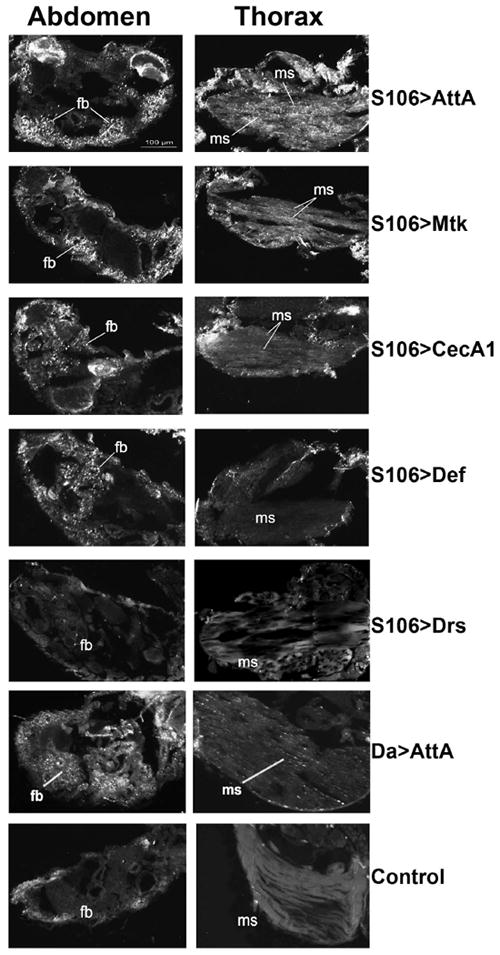
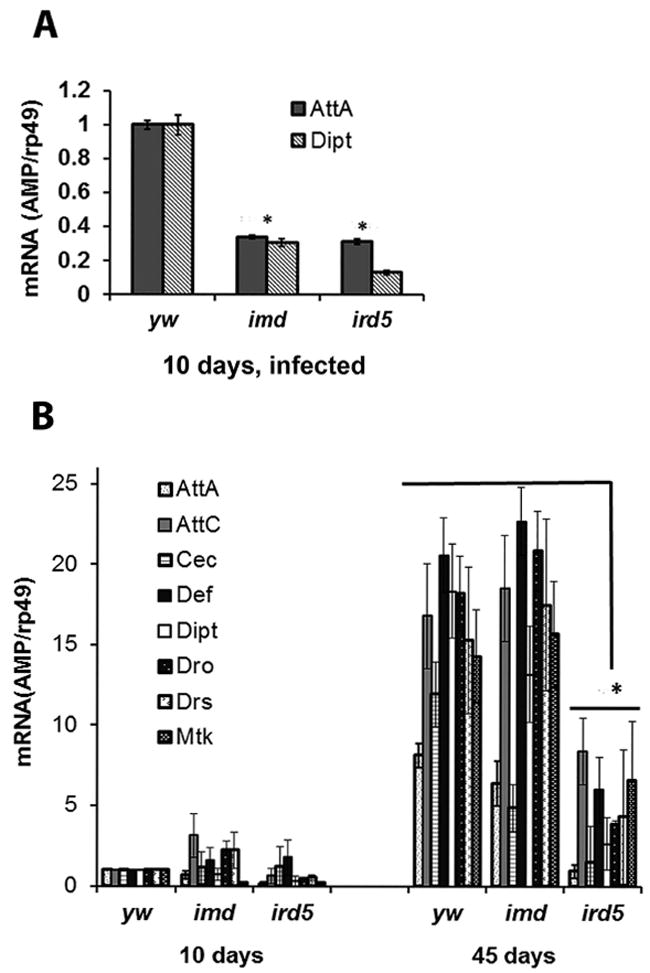
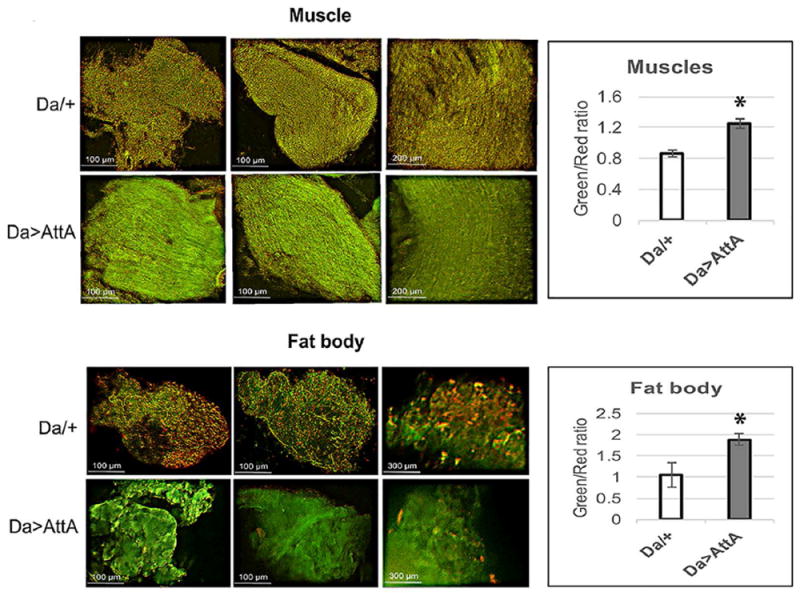
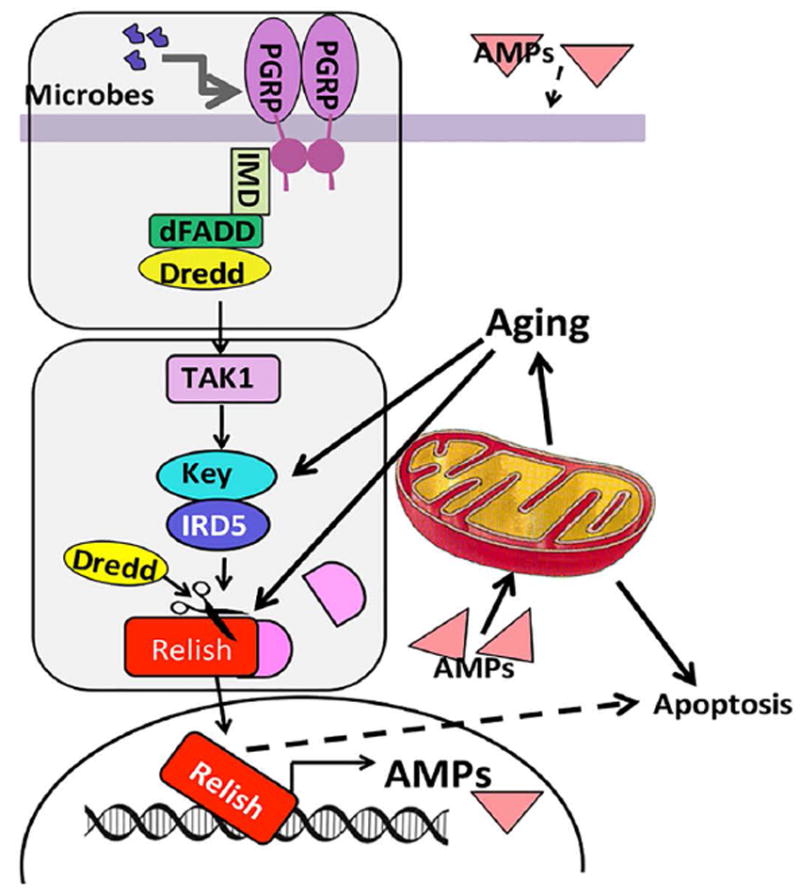
The innate immune response tends to become hyperactive and proinflammatory in older organisms. We investigated connections between activity of the immune-related genes and aging using the Drosophila model. A hallmark of Drosophila immunity is the production of antimicrobial peptides (AMP), whose expression is triggered via activation of the Toll and Imd immune pathways and regulated by NF-ĸB-like transcription factors, Dif/Dorsal and Relish. It was previously shown that overexpression of the upstream component of the immune pathways shortens lifespan via activation of the Relish-dependent immune response. Here we show that direct overexpression of the Relish target AMP genes broadly at high levels or in the fat body induced apoptosis, elicited depolarization of the mitochondria and significantly shortened lifespan. Underexpression of Relish in the fat body beginning in the second half of lifespan prevented overactivation of AMPs and extended longevity. Unlike infection-induced responses, the age-related increase in AMPs does not require the upstream recognition/transduction module of the Imd pathway. It does however require downstream elements, including Relish and Ird5, a component of the downstream IKK complex. Together, these results established causal links between high-level production of antimicrobial peptides and longevity.

Keywords: Drosophila; aging; antimicrobial peptide; cytotoxicity; immunity.


Figures

FIGURE 1
FIGURE 1. Analysis of expression of Relish during aging and its effects on immune response
A: mRNA levels of Relish were examined in y w flies by qRT-PCR analysis. The ratios of signals obtained with Relish primers to signals obtained with rp49 primers are shown on the Y axis, normalized to a value of 1.0 at 10 d. Results are means ± SD (n=6). Statistically significant differences were observed between 10 da-old flies and flies > 40 da-old (*P < 0.05), as indicated by asterisks. B: Relish mRNA levels were determined by qRT-PCR in 10 da and 30 da-old Relish over-expressing flies and controls. Da/+ — Da-GAL4 driver control; Da>Rel—flies overexpressing His-tagged Relish using the Da-GAL4 driver. Analysis was conducted in triplicate for each biological replicate. Shown are means ± SEM (n = 6). Asterisks denote statistically significant differences (*P < 0.05). C: qRT-PCR analysis of AMP expression in young (10 da) and old (30 da) flies overexpressing Relish. Da/+ — Da-GAL4 driver control; Da>Rel—flies overexpressing Relish-His using the Da-GAL4 driver. AttA—attacin A; AttC—attacin C; AttD—attacin D; CecA1—cecropin A1; Def—defensin, Dipt—diptericin, Dro—drosocin, Drs—drosomycin, and Mtk—metchnikowin. Analysis was conducted in triplicate for each biological replicate. Shown are means ± SEM (n = 6). Asterisks denote statistically significant differences (*P < 0.05). P values for individual AMPs, as well as statistical differences between the age and genotype groups, obtained by multiple t tests with Tukey’s multiple comparisons are presented in Suppl. Table 1. All analyses were performed with male flies.
FIGURE 2
FIGURE 2. Effects of overexpression of Relish on fly life spans
A-B: Da/+ and +/Rel —driver and transgene controls; Da>Rel—experimental flies overexpressing Relish-His with the Da-GAL4 driver. Shown are representative data of two replicate experiments, summarized in Table 1A. Each survival curve represents ~100 flies. Statistically significant differences were observed between Da>Rel and driver and transgene controls (P < 0.05) in both sexes, as determined by the log-rank test. C-D: effects of the fat body-specific overexpression of Relish on life span. Food containing mifepristone (+RU486) was introduced when flies were 2 days old. Data are representative of 2 replicate experiments summarized in Table 1B. Statistically significant differences were observed between controls (S106/Rel) and experimentals (S106>Rel RU486+) (P < 0.05) in both sexes, as determined by the log-rank test.
FIGURE 3
FIGURE 3. Effects of Relish underexpression on immune response and life span
A: qRT-PCR analysis of AMP expression in young (10 da) and old (45 da) male flies. Control—y w control; rel— relE20 mutant. Analysis was conducted with 2 independent cohorts of flies and in triplicate for each cohort. Shown are means ± SEM (n = 6). Asterisks denote statistically significant differences (*P < 0.05). Shown are changes in mRNA levels relative to levels in 10 da-old controls for each AMP gene. P values for individual AMPs are presented in Suppl. Table 2. B: Levels of Relish mRNA in RNAi fly lines. Downregulation of Relish was achieved by crossing two different UAS-RNAi-rel fly lines (A and B) to the GeneSwitch-S106 driver. Controls were GeneSwitch-S106/RNAi-rel flies fed ethanol; experimentals were flies fed with mifepristone (+ RU486). Shown are means ± SEM (n = 3). *P < 0.05. Shown is analysis performed with 10 da old male flies. Analysis of female flies is shown in Fig. S6. C-D: Life span of relE20 male and female mutants. Shown are representative data of two replicate experiments, summarized in Table 2A. Each survival curve represents ~100 flies. E-F: effects of the fat body-specific downregulation of Relish on life span. Food containing mifepristone (+RU486) was introduced when flies were 34-37 days, or at the onset of a rapid death, as shown by a vertical line. Data are representative of 3 replicate experiments with one of the transgenic RNAi lines (RNAi-rel-A), summarized in Table 2B. Similar results were obtained with fly line RNAi-rel-B. Statistically significant differences were observed between controls and experimentals (P < 0.05) in both sexes, as determined by the log-rank test.
FIGURE 4
FIGURE 4. Effects of global overexpression of AMPs on fly life span
A: qRT-PCR analysis of mRNA levels of different AMPs. Controls (+/AMP) were obtained by crossing UAS transgene lines to y w flies; Da>AMP—experimental flies expressing attacin A (AttA), cecropin A1 (CecA1), defensin (Def), drosocin (Dro), drosomycin (Drs) or metchnikowin (Mtk) with the Da-GAL4 driver. Analysis was conducted in triplicate for each group. Shown are means ± SEM (n = 3). Asterisks denote statistically significant differences (*P < 0.05). B-H: Life spans of flies overexpressing AMPs with the Da-GAL4 driver. Each survival curve represents 100–125 flies; similar results were obtained in replicate experiments. Mean ages and statistical analysis are indicated in Table 3. Da/+—driver control; +/AttA, +/CecA1, +/Def, +/MtK—transgene controls; Da>AMP-experimentals overexpressing different AMPs.
FIGURE 5
FIGURE 5. Effects of overexpression of AMPs in the fat body on fly life span
A: qRT-PCR analysis of mRNA levels of different AMPs. Upregulation of AMPs was achieved by crossing the UAS-AMP fly lines to GeneSwitch-S106 driver. Shown are means ± SEM (n = 6). Asterisks denote statistically significant differences (*P < 0.05). B-E: life spans of flies overexpressing AMPs in the fat body. Each survival curve represents 100–125 flies. Similar results were obtained in replicate experiments (Table 4).
FIGURE 6
FIGURE 6. TUNEL analysis of cell death in flies overexpressing AMPs
Representative images of DNA fragmentation in cryosections made from 25-day-old flies overexpressing AMPs in the fat body (with S106 driver) or globally (with Da driver). Shown are selected abdominal and thoracic regions, where differences in DNA fragmentation were detected. Apoptotic cells in muscles (ms) and the fat body tissue (fb) are indicated by arrows. No apoptotic changes were detected in flies overexpressing Drs (S106>Drs), as well as control flies fed with ethanol, as demonstrated on the bottom image with S106/AttA control. The displayed scale bar is applied to all images.
FIGURE 7
FIGURE 7. Analysis of mitochondrial membrane potential in whole-mount preparations made from flies over-expressing attacin
A. Fluorescent microscopy images of thoracic muscle and the fat body tissues stained with the JC-1 dye. Regions of high mitochondrial polarization fluoresce red due to accumulation of JC-aggregates within the mitochondria while JC-1 monomer leaks into the cytoplasm when mitochondrial membrane potential dissipates and fluoresces green. Three representative images are shown for each tissue. Preparations were made from 10 da old driver control (Da/+) and experimental flies overexpressing AttA (Da>AttA). A prominent decrease in the red/green fluorescence intensity ratio, an indicator of depolarized mitochondrial membrane, was observed in tissues of flies overexpressing AttA. The intensity of green and red fluorescence was analyzed using ImajeJ software, and the ratio of green and red fluorescence is presented in the graphs shown on the right.
FIGURE 8
FIGURE 8. Analysis of AMP levels in flies underexpressing Ird5 and Imd
qRT-PCR analysis of AMP expression in young (10 da) flies infected with E. coli (A) and in young (10 da) and old (45 da) flies in the absence of infection (B). Analysis was conducted with 2 independent cohorts of control y w flies and imd and ird5 mutants, in triplicate for each cohort. Shown are means ± SEM (n = 6). Asterisks denote statistically significant differences (*P < 0.05). P values for individual AMPs are presented in Suppl. Table 3. All analyses were performed with male flies.
FIGURE 9
FIGURE 9. The relationship between Relish-dependent signaling, AMP levels and aging
Shown are key players in Imd/Relish signaling (Kleino and Silverman, 2014). In response to infection, peptidoglycan recognition proteins (PGRPs) recognize the microbial patterns and signal through immune deficiency (Imd) and the cascade of kinases, culminating in activation of the NF-kappaB-like factor Relish and transcription of its target genes, AMPs. The IKK complex is composed of Kenny and Ird5 subunits and the Imd protein is a part of the upstream module required for activation of Relish in response to infection. The age-related increase in AMP levels does not require the upstream recognition/Imd module but requires activity of Ird5, suggesting that signaling via the IKK/Relish module is triggered by a different activator. High-level production of AMPs leads to changes in the mitochondrial membrane potential and promotes apoptosis in the fly muscle and fat body tissues. The dotted lines represent links that are yet to be established.

References

    1. Bangi E. Drosophila at the intersection of infection, inflammation, and cancer. Front Cell Infect Microbiol. 2013;3:103. - PMC - PubMed
    1. Bosco-Drayon V, Poidevin M, Boneca IG, Narbonne-Reveau K, Royet J, Charroux B. Peptidoglycan sensing by the receptor PGRP-LE in the Drosophila gut induces immune responses to infectious bacteria and tolerance to microbiota. Cell Host Microbe. 2012;12:153–65. - PubMed
    1. Broderick NA, Buchon N, Lemaitre B. Microbiota-induced changes in drosophila melanogaster host gene expression and gut morphology. MBio. 2014;5:e01117–14. - PMC - PubMed
    1. Brummel T, Ching A, Seroude L, Simon AF, Benzer S. Drosophila lifespan enhancement by exogenous bacteria. Proc Natl Acad Sci U S A. 2004;101:12974–9. - PMC - PubMed
    1. Bulet P, Hetru C, Dimarcq JL, Hoffmann D. Antimicrobial peptides in insects; structure and function. Dev Comp Immunol. 1999;23:329–44. - PubMed

MeSH terms

Substances

LinkOut - more resources