

High-density genetic map using whole-genome resequencing for fine mapping and candidate gene discovery for disease resistance in peanut
- PMID: 29637729
- PMCID: PMC6181220
- DOI: 10.1111/pbi.12930
High-density genetic map using whole-genome resequencing for fine mapping and candidate gene discovery for disease resistance in peanut
Abstract
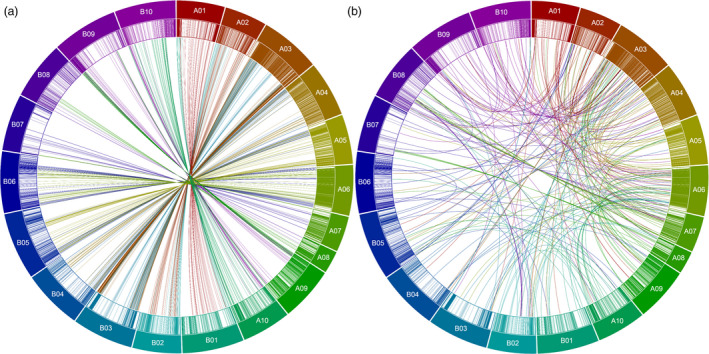
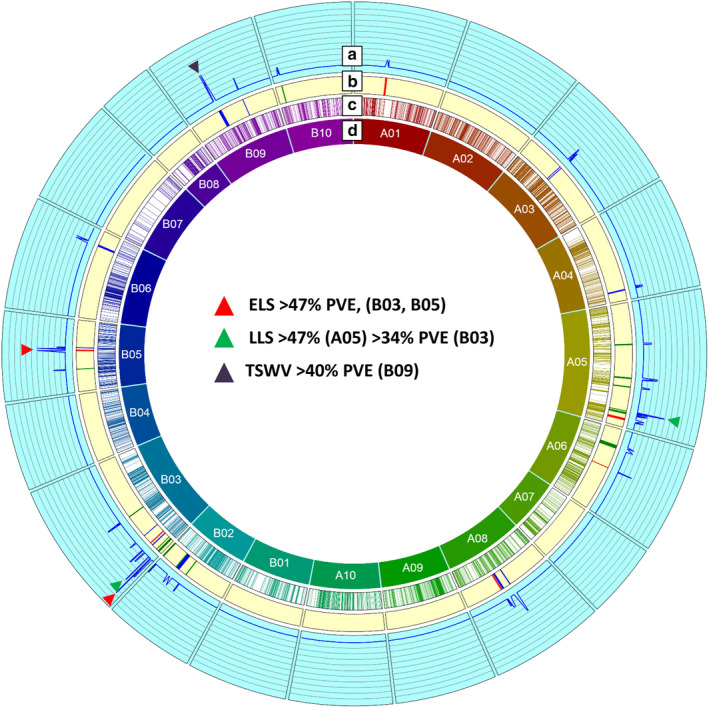
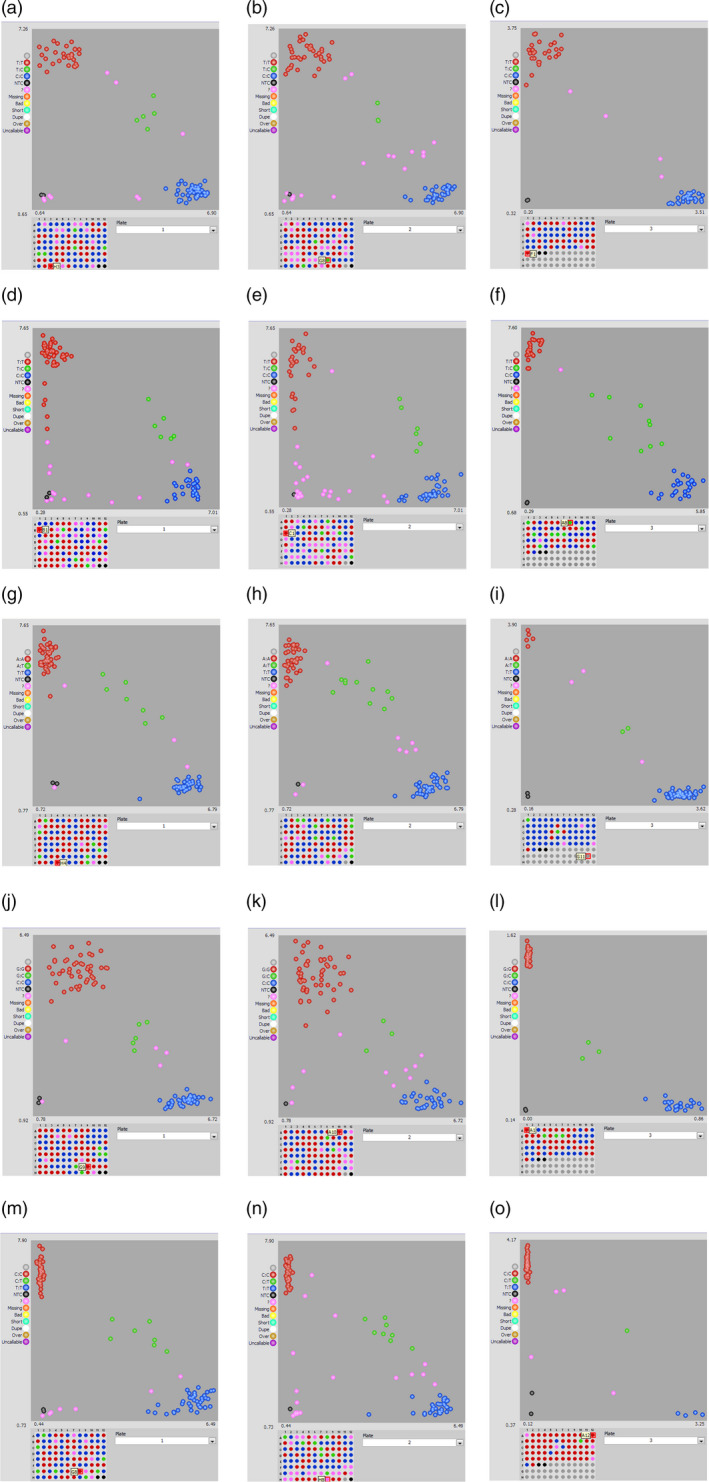
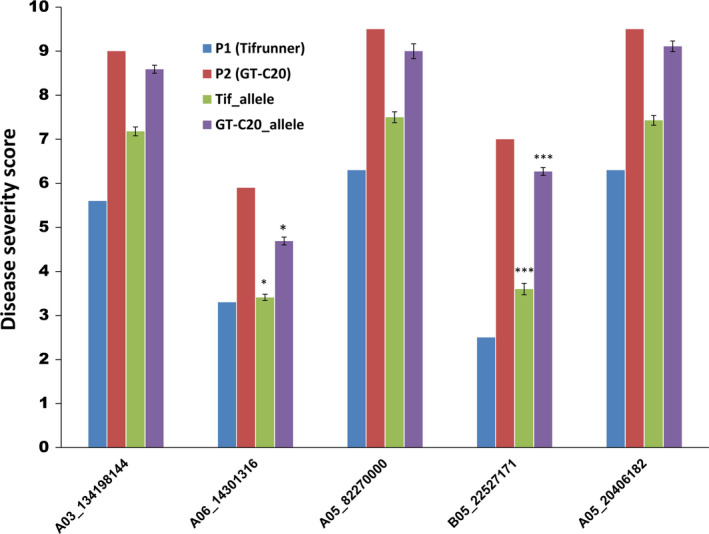
Whole-genome resequencing (WGRS) of mapping populations has facilitated development of high-density genetic maps essential for fine mapping and candidate gene discovery for traits of interest in crop species. Leaf spots, including early leaf spot (ELS) and late leaf spot (LLS), and Tomato spotted wilt virus (TSWV) are devastating diseases in peanut causing significant yield loss. We generated WGRS data on a recombinant inbred line population, developed a SNP-based high-density genetic map, and conducted fine mapping, candidate gene discovery and marker validation for ELS, LLS and TSWV. The first sequence-based high-density map was constructed with 8869 SNPs assigned to 20 linkage groups, representing 20 chromosomes, for the 'T' population (Tifrunner × GT-C20) with a map length of 3120 cM and an average distance of 1.45 cM. The quantitative trait locus (QTL) analysis using high-density genetic map and multiple season phenotyping data identified 35 main-effect QTLs with phenotypic variation explained (PVE) from 6.32% to 47.63%. Among major-effect QTLs mapped, there were two QTLs for ELS on B05 with 47.42% PVE and B03 with 47.38% PVE, two QTLs for LLS on A05 with 47.63% and B03 with 34.03% PVE and one QTL for TSWV on B09 with 40.71% PVE. The epistasis and environment interaction analyses identified significant environmental effects on these traits. The identified QTL regions had disease resistance genes including R-genes and transcription factors. KASP markers were developed for major QTLs and validated in the population and are ready for further deployment in genomics-assisted breeding in peanut.
Keywords: Tomato spotted wilt virus; early leaf spot; high-density genetic map; late leaf spot; quantitative trait loci; whole-genome resequencing.
© 2018 The Authors. Plant Biotechnology Journal published by Society for Experimental Biology and The Association of Applied Biologists and John Wiley & Sons Ltd.
Conflict of interest statement
The authors declare that there is no conflict of interests.
Figures
References
-
- Baldessari, J. J. (2008) Genetics of Tomato Spotted Wilt Virus Resistance in Peanut (Arachis hypogaea L.). Gainesville, FL: University of Florida.
-
- Bertioli, D.J. , Cannon, S.B. , Froenicke, L. , Huang, G. , Farmer, A.D. , Ethalinda, K.S.C. , Xin, L. et al. (2016) The genome sequences of Arachis duranensis and Arachis ipaensis, the diploid ancestors of cultivated peanut. Nat. Genet. 48, 438–446. - PubMed
-
- Chiteka, Z.A. , Gorbet, D.W. , Knauft, D.A. , Shokes, F.M. and Kucharek, T.A. (1988) Components of resistance to late leaf spot in peanut. II. Correlations among components and their significance in breeding for resistance. Peanut Sci. 15, 76–81.
Publication types
MeSH terms
Grants and funding
LinkOut - more resources
Full Text Sources
Other Literature Sources
Miscellaneous
