. 2018 Apr 11:7:e35069.
doi: 10.7554/eLife.35069.

An efficient and scalable pipeline for epitope tagging in mammalian stem cells using Cas9 ribonucleoprotein

Affiliations

An efficient and scalable pipeline for epitope tagging in mammalian stem cells using Cas9 ribonucleoprotein

Pooran Singh Dewari et al. Elife. .

Abstract

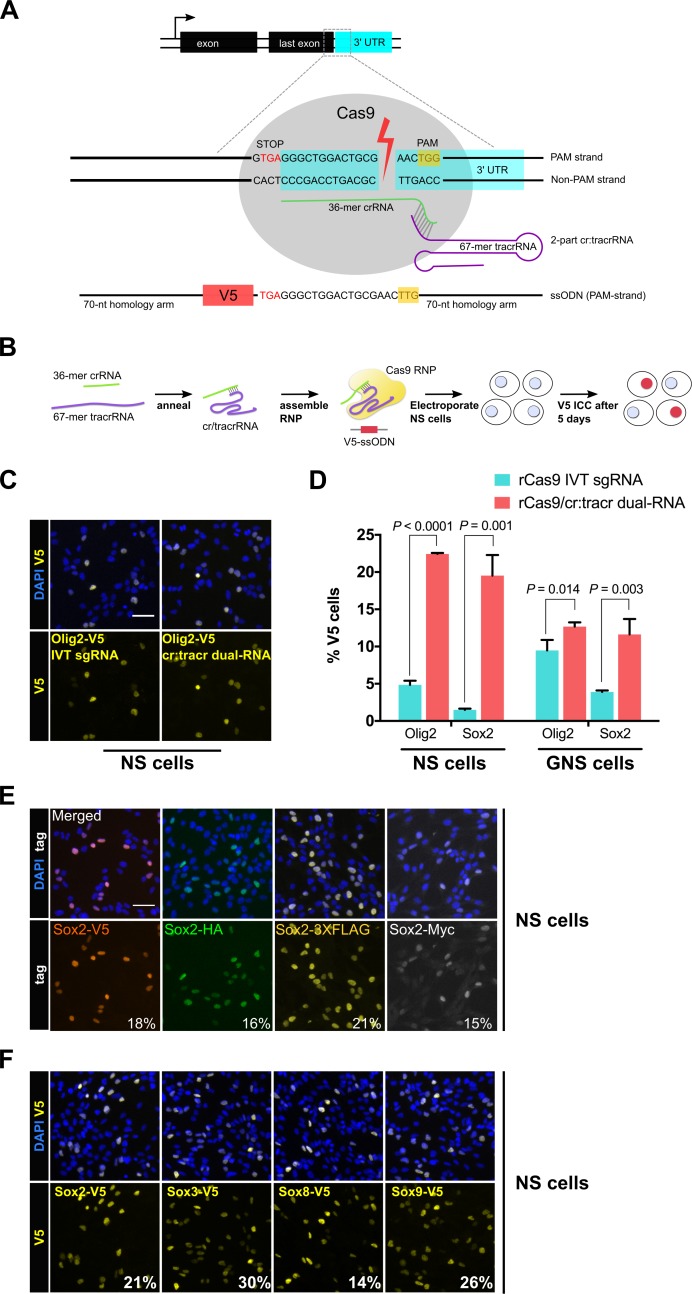
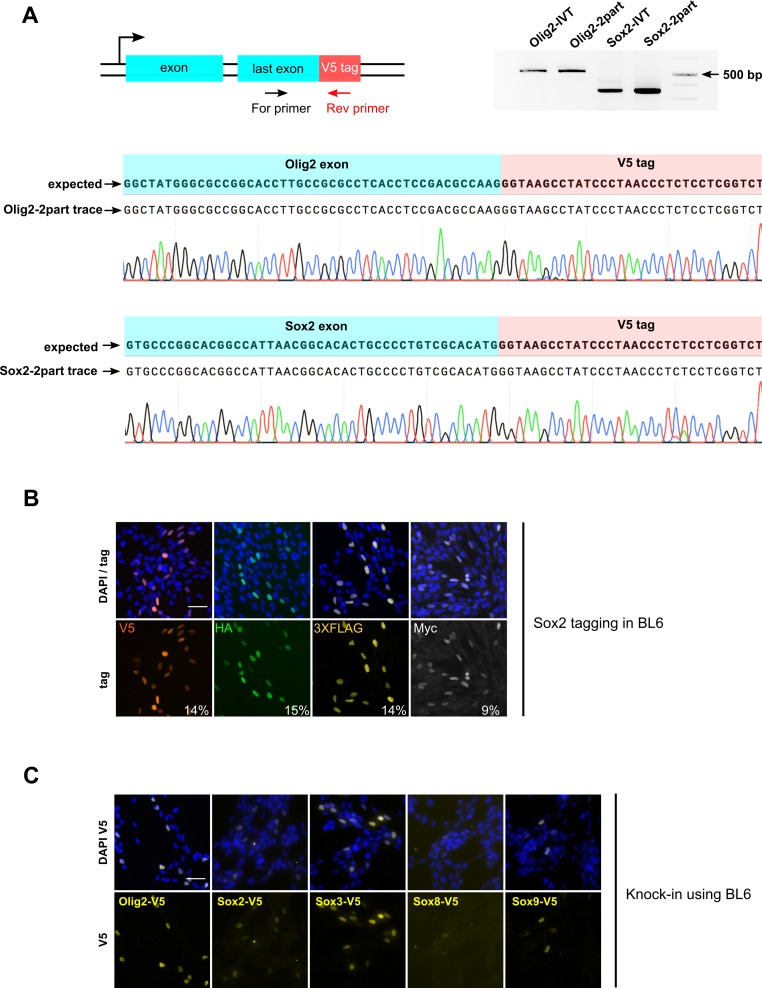
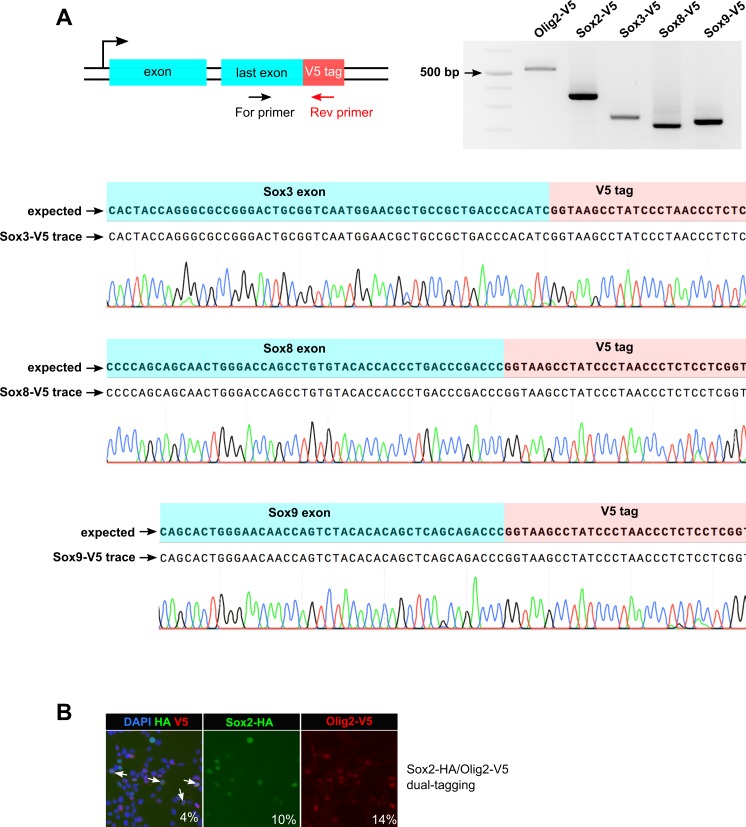
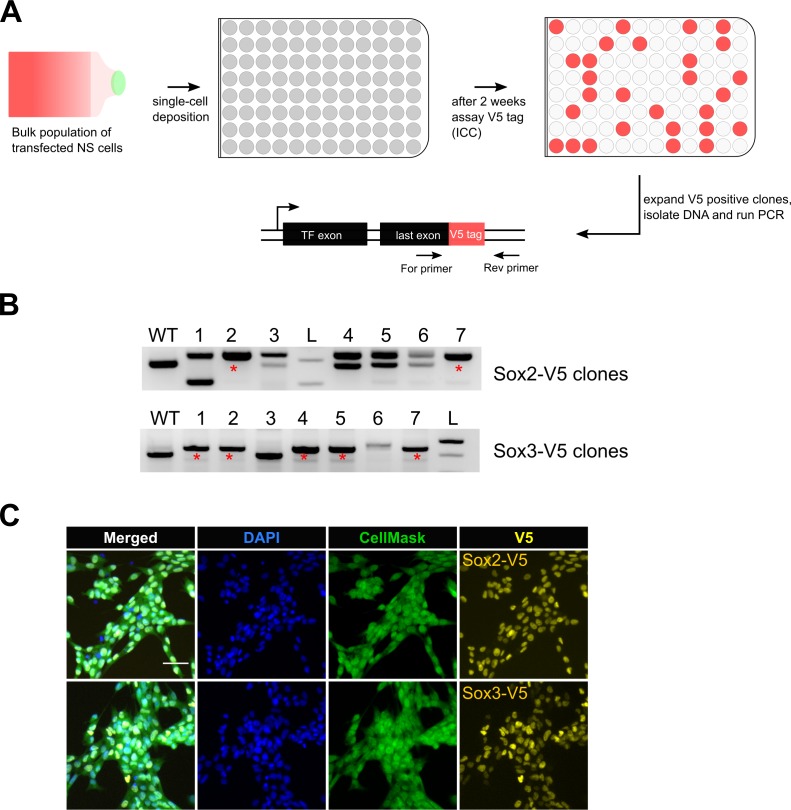
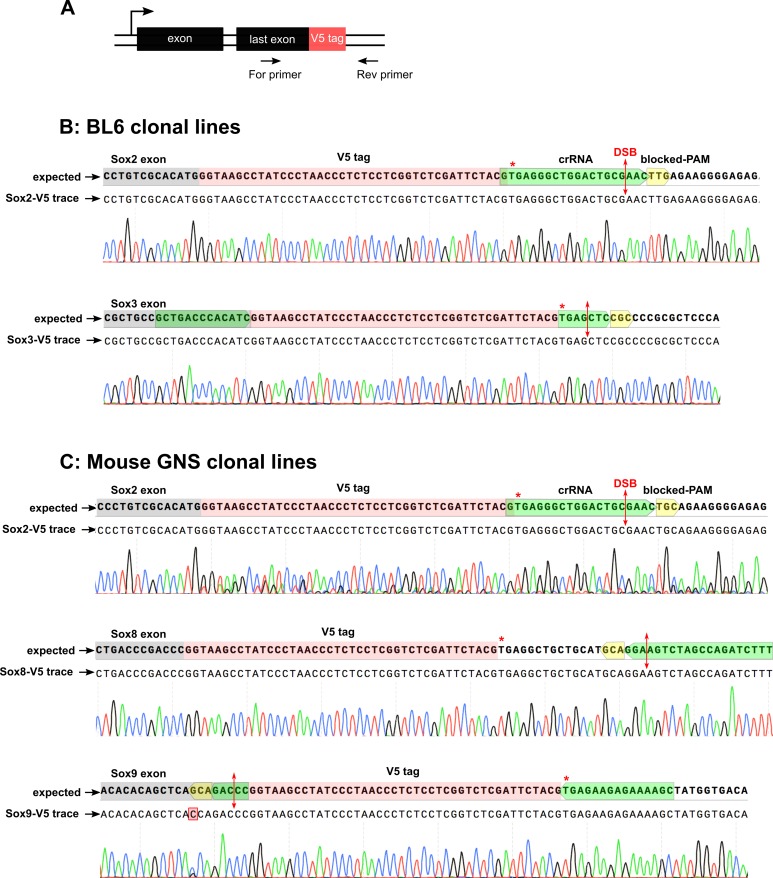
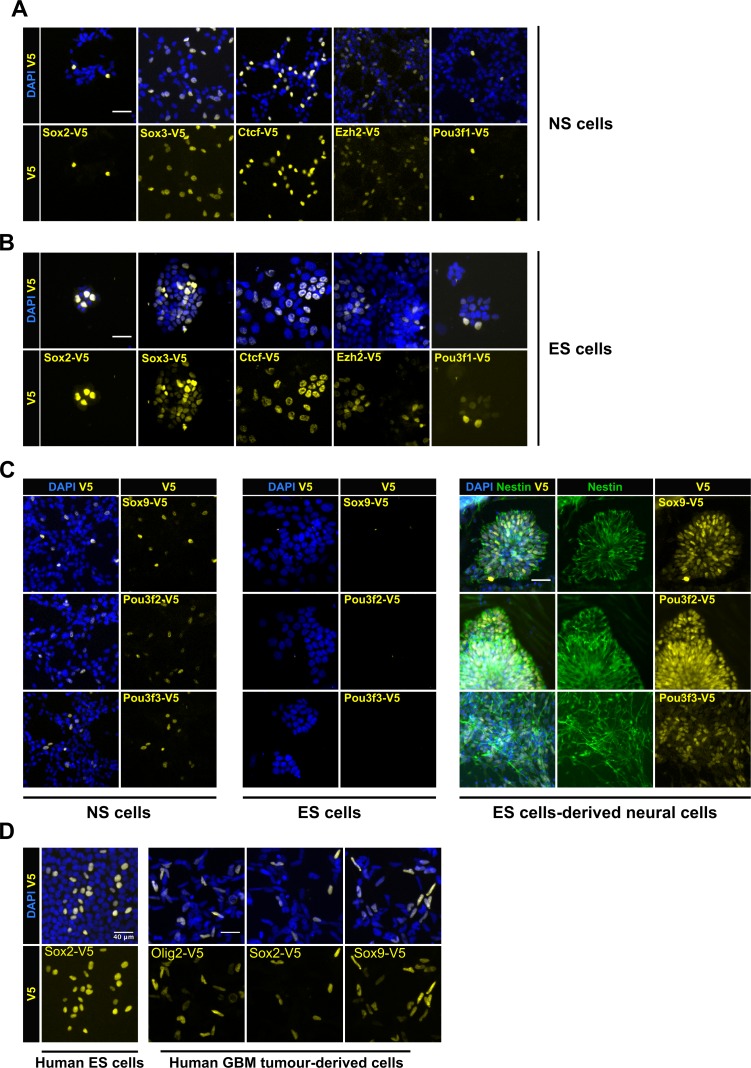
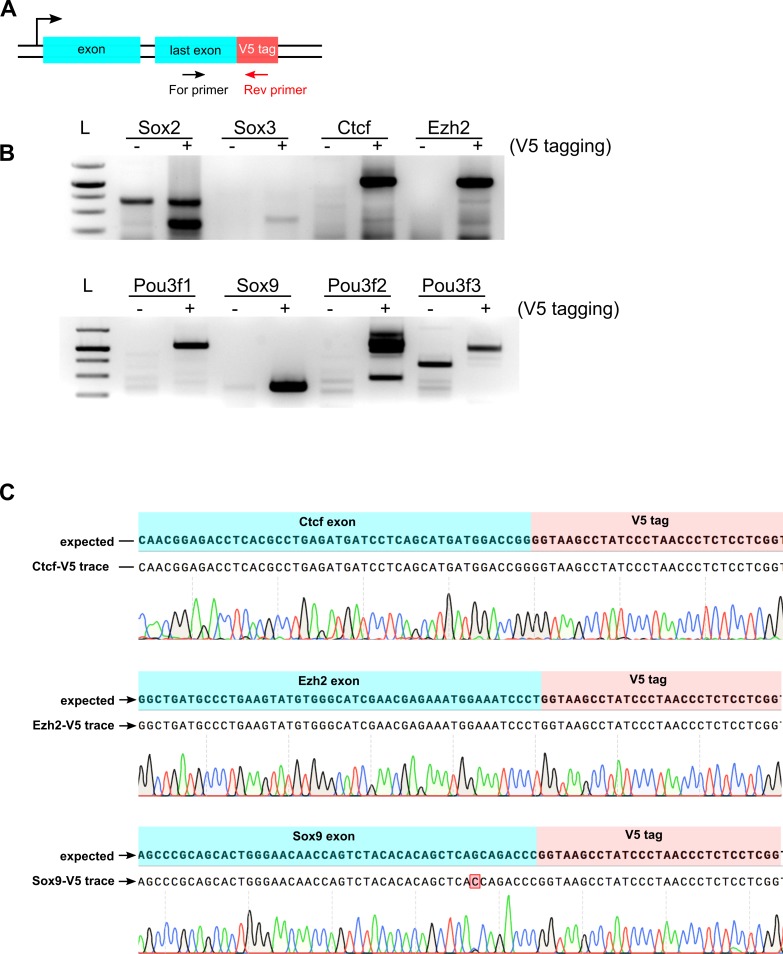
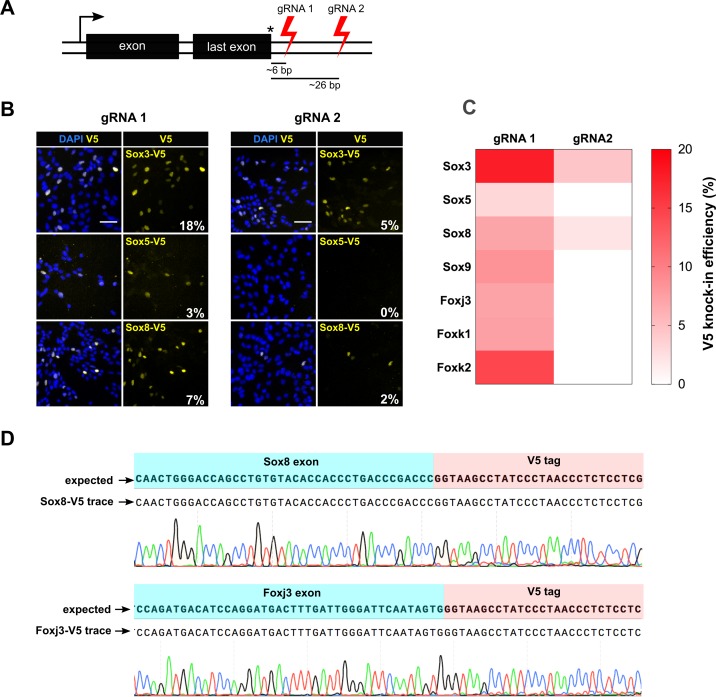
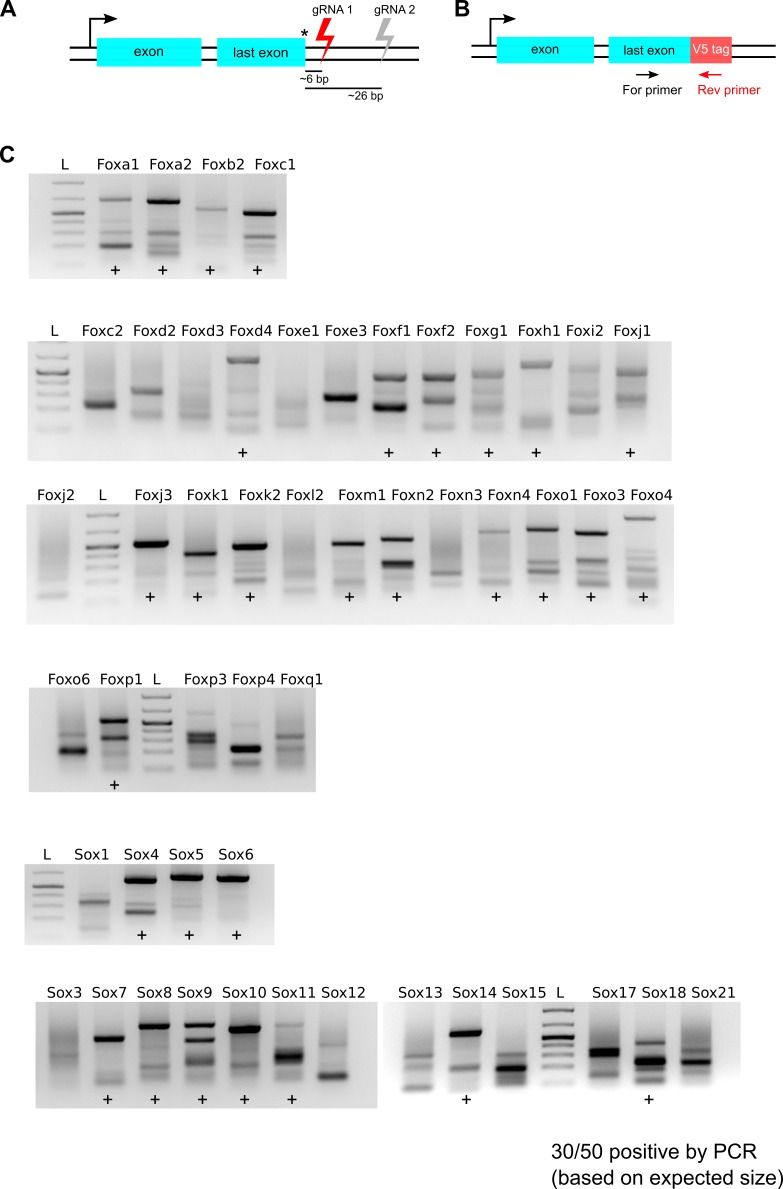
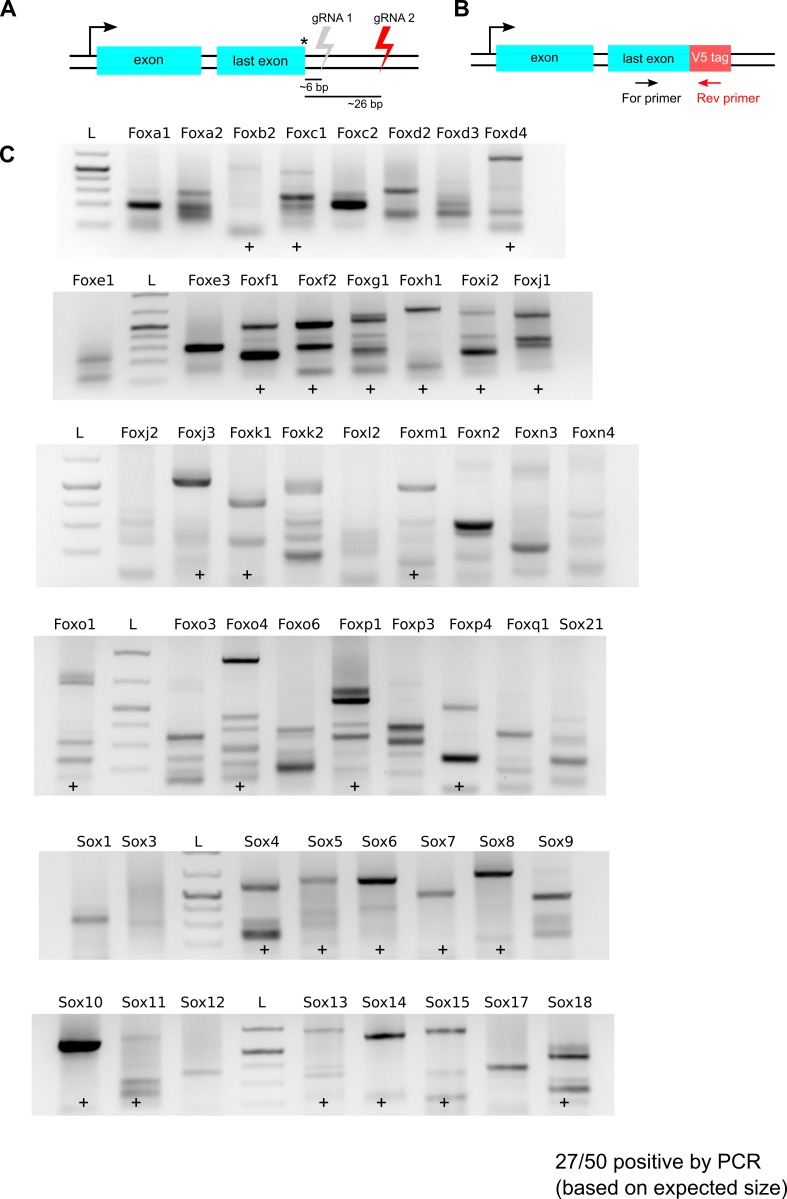
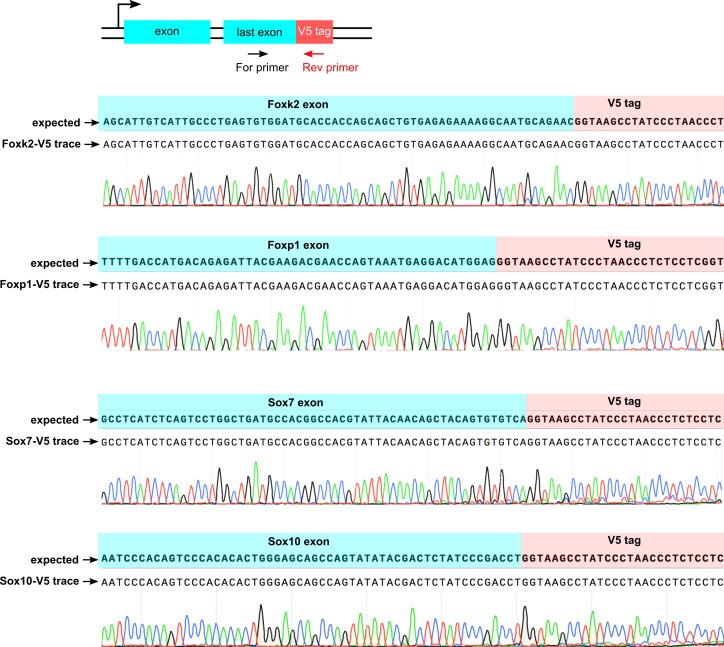
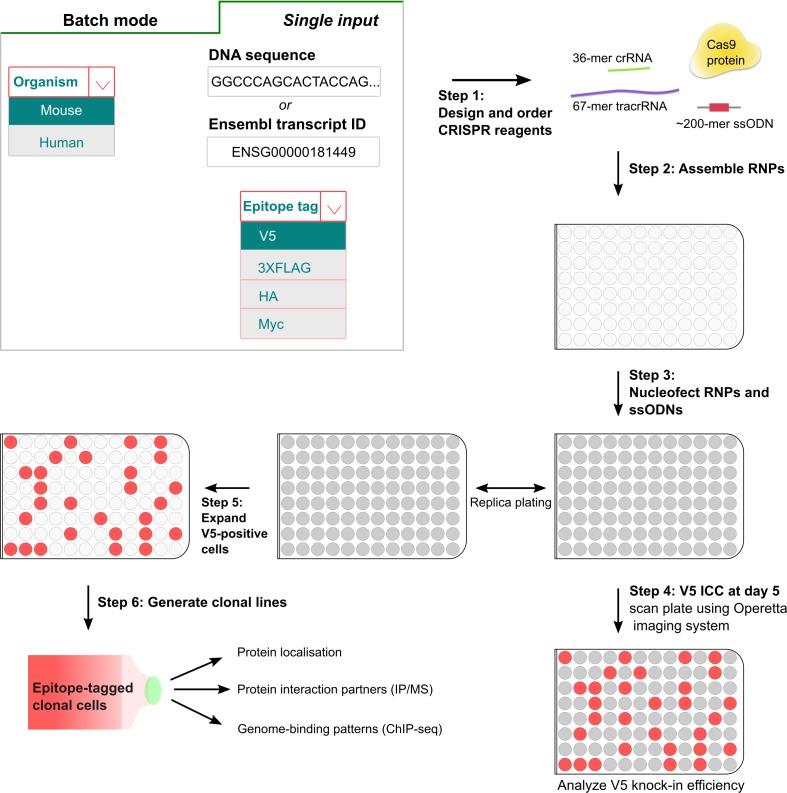
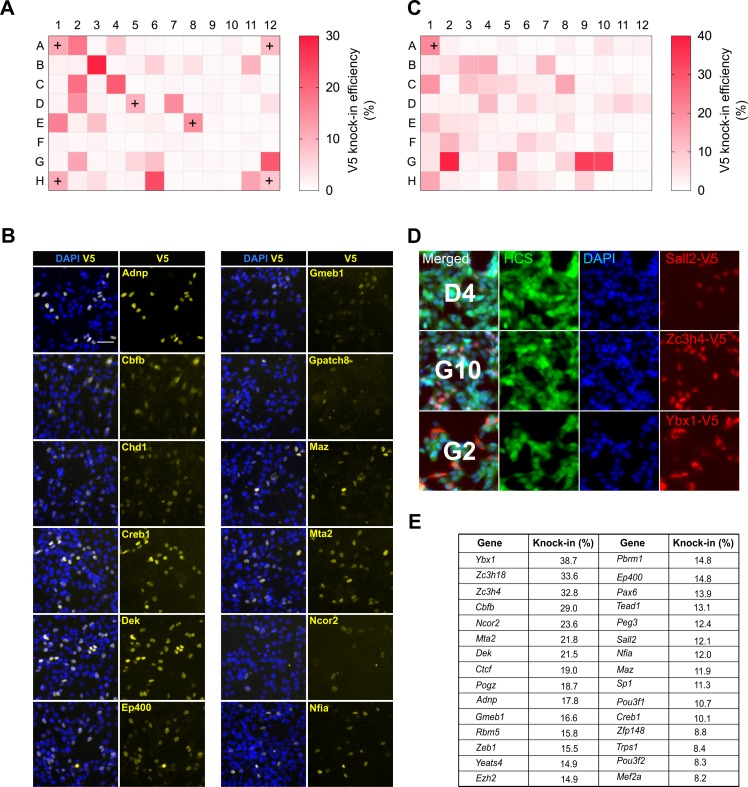
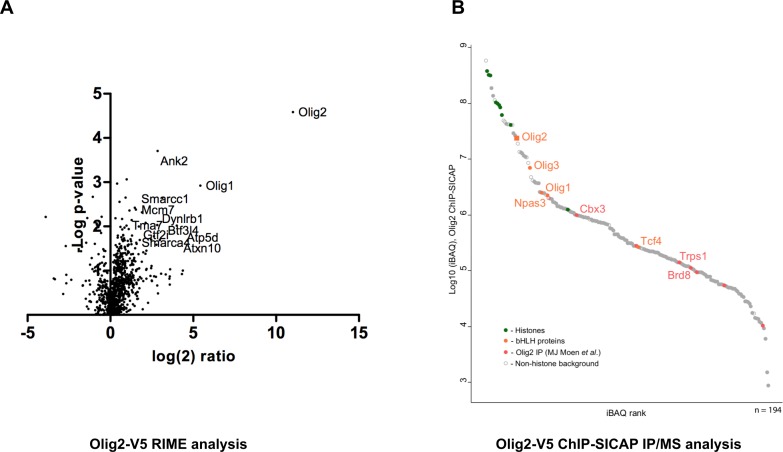
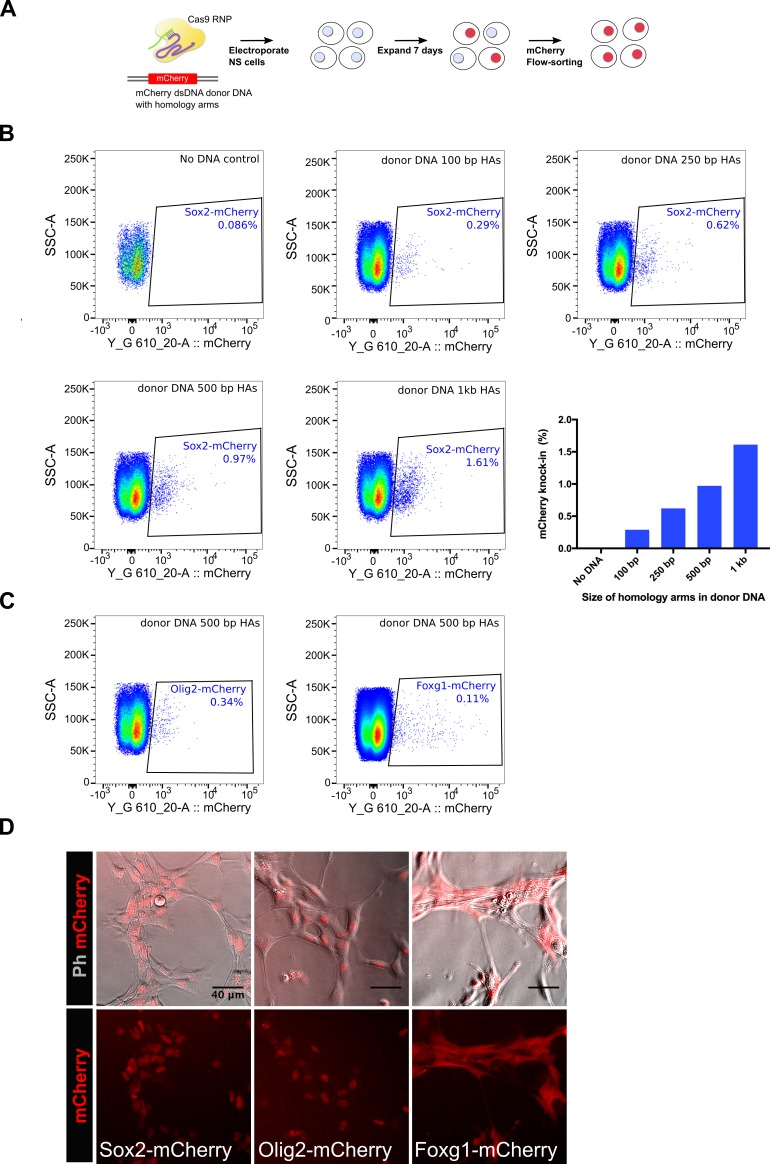
CRISPR/Cas9 can be used for precise genetic knock-in of epitope tags into endogenous genes, simplifying experimental analysis of protein function. However, Cas9-assisted epitope tagging in primary mammalian cell cultures is often inefficient and reliant on plasmid-based selection strategies. Here, we demonstrate improved knock-in efficiencies of diverse tags (V5, 3XFLAG, Myc, HA) using co-delivery of Cas9 protein pre-complexed with two-part synthetic modified RNAs (annealed crRNA:tracrRNA) and single-stranded oligodeoxynucleotide (ssODN) repair templates. Knock-in efficiencies of ~5-30%, were achieved without selection in embryonic stem (ES) cells, neural stem (NS) cells, and brain-tumor-derived stem cells. Biallelic-tagged clonal lines were readily derived and used to define Olig2 chromatin-bound interacting partners. Using our novel web-based design tool, we established a 96-well format pipeline that enabled V5-tagging of 60 different transcription factors. This efficient, selection-free and scalable epitope tagging pipeline enables systematic surveys of protein expression levels, subcellular localization, and interactors across diverse mammalian stem cells.

Keywords: CRISPR; cell biology; developmental biology; epitope tagging; genome editing; human; mouse; neural stem cell; stem cells; transcription factors.


Conflict of interest statement

PD, BS, KM, GM, EO, NQ, AT, ML, CP, MK, CB, RF, RB, GM, Av, ST, JK, SP No competing interests declared, AJ employed by Integrated DNA Technologies (IDT), who sells reagents similar to some described herein. IDT is, however, not a publicly traded company and the authors do not own any shares or equity in IDT. No other authors have any financial interests or relationships with IDT; nor do they own any shares or equity, MB Mark A Behlke: employed by Integrated DNA Technologies (IDT), who sells reagents similar to some described herein. IDT is, however, not a publicly traded company and the authors do not own any shares or equity in IDT. No other authors have any financial interests or relationships with IDT; nor do they own any shares or equity

Figures

Figure 1.
Figure 1.. Cas9 protein in complex with synthetic cr/tracrRNAs enables highly efficient knock-in of biochemical tags in mouse neural and glioma stem cells.
(A) Schematic representation of epitope knock-in strategy. A crRNA was designed against the 3’UTR of each target gene. Target site with double-stranded break is shown with Cas9 RNP (grey), PAM in yellow box, and single-stranded donor DNA that harbours PAM-blocking mutations and V5 tag coding sequence flanked by 70-mer homology arms on both sides. (B) Cas9 RNP complexes were assembled in vitro by incubation of recombinant Cas9 protein with either IVT sgRNA or synthetic two-part cr:tracrRNA and electroporated into NS cells. V5 ICC was used to quantify knock-in. (C) Representative ICC images for the detection of Olig2-V5 fusion protein in the bulk populations of transfected cells. (D) HDR-mediated insertion of V5 tag was determined by scoring V5-positive cells (%) in the bulk populations of transfected cells. Results from three independent experiments are shown for Sox2 and Olig2 V5 tagging using mouse neural stem (NS) and glioma-initiating neural stem (GNS) cells. Error bars indicate standard deviation values based on a minimum of two experiments, p-values were derived using unpaired t test. (E) ICC for Sox2 gene epitope tagging at the C-terminus with V5, HA, 3XFLAG, or Myc epitope. Numbers represent percentage of tagged cells in the bulk population for each tagging experiment. (F) Representative bulk population V5 ICC images for Sox2, Sox3, Sox8, and Sox9 V5 knock-in are shown. Average knock-in efficiency from two independent experiments is shown at the bottom (numbers in white).
Figure 1—figure supplement 1.
Figure 1—figure supplement 1.. PCR genotyping and Sanger sequencing of V5 knock-in bulk populations show error-free insertion of the tag-encoding sequence.
Schematic of genotyping strategy. Agarose gel on the right. Gene name and guide RNA source (IVT or synthetic two-part gRNA) are indicated on the top of each lane in the gel. (A) Sequencing traces from the respective PCR amplicons were aligned with the expected TF-V5 chimeric sequence, Olig2-V5 and Sox2-V5 are shown. (B) Sox2 gene tagged independently with four different epitope tags in mouse NS BL6 cells, bulk population ICC images for each epitope tag are shown. (C) Mouse BL6 were transfected with RNPs and V5-encoding ultramers for V5 epitope tagging of indicated genes. Representative bulk population V5 ICC images for each TF are shown.
Figure 1—figure supplement 2.
Figure 1—figure supplement 2.. PCR genotyping and Sanger sequencing of V5 knock-in bulk populations show error-free insertion of the tag-encoding sequence.
(A) synthetic two-part gRNA system was used to knock-in V5 tag at the indicated genes in mouse NS cells. Sequence alignment of Sox3-V5, Sox8-V5, and Sox9-V5 sequencing traces with the expected sequences are shown. (B) GNS cells were nucleofected with Sox2-HA and Olig2-V5 ssODNs in a combined reaction (dual-epitope tagging). Transfected cells were analysed for V5 and HA knock-in by ICC; 4% cells were positive for both the tags (marked with arrows in the first panel).
Figure 2.
Figure 2.. Bi-allelic knock-in clonal lines can be readily generated.
(A) Experimental workflow for generating clonal lines. Cells from the bulk population cultures were single-cell deposited to 96-well plates using flow cytometry. Two weeks later, V5-positive clones were selected by ICC assay and confirmed by PCR genotyping. (B) Representative agarose gel pictures for Sox2-V5 and Sox3-V5 PCR genotyping are shown. Wild-type unedited cells (control) are marked with WT; 1 kb+ DNA ladder is marked with L; bi-allelic clones are marked with red asterisks. (C) ICC images of bi-allelic V5 knock-in clones are shown for Sox2 and Sox3 TFs. Nuclear stain DAPI (blue), entire cell stain CellMask HCS (green), and V5 tag (yellow) are shown.
Figure 2—figure supplement 1.
Figure 2—figure supplement 1.. Sanger sequencing of V5 knock-in clonal lines.
(A) Schematics shows the PCR amplification of HDR-edited loci using a primer pair flanking the V5 tag sequence. (B) Sequencing traces for the V5 clonal knock-in lines were aligned with the expected TF-V5 chimeric sequence; Sox2 and Sox3 V5 traces for BL6 clonal lines are shown. Red asterisks denote stop codon, the crRNA is highlighted in green, PAM with blocking mutations in yellow, the cut-site is marked with a double-headed arrow in red. (C) Sequencing trace alignment for V5 knock-in using mouse GNS clonal lines (IENS); Sox2, Sox8, and Sox9 V5 knock-in sequencing traces are shown.
Figure 3.
Figure 3.. | Variety of cell types can be epitope-tagged using RNP method.
Representative V5 ICC images are shown for V5 tagging of five TFs that are expressed in both mouse NS cells (A) and ES cells (B). V5 ICC images for the three neural-specific TFs Sox9, Pou3f2, and Pou3f3 in mouse NS cells (Figure C, left panel). Mouse ES cells were electroporated with similar three TF-reagents (Figure C, middle panel). Later, ES bulk populations of non-expressed TFs were differentiated into neural lineage and assayed for expression of TF-V5 fusion proteins by ICC (Figure C, right panel). Differentiation into neural stem progenitors was confirmed by Nestin ICC (in green), only V5-positive rossettes for each of the three genes are shown. (D) V5 ICC images for epitope tagging using human ES cells and GBM patient-derived cell lines.
Figure 3—figure supplement 1.
Figure 3—figure supplement 1.. PCR genotyping and sequence confirmation of V5 tagging in mouse ES cells.
(A) PCR strategy is shown, a V5 tag-specific reverse primer and a TF exon-specific forward primer were used to amplify HDR-edited alleles using bulk population of ES cells. (B) Agarose gel analysis of PCR products, gene names are indicated at the top of each lane, ‘- ‘refers to control unedited cells, ‘+’ refers to edited cells, 1kb + DNA ladder is marked with ‘L’. (C) Sequencing trace alignments for some of the edited genes from (b) are shown, Ctcf and Ezh2 genes are expressed in ES cells, Sox9 is expressed after differentiation of ES cells into neuronal lineage.
Figure 4.
Figure 4.. csRNP cutting proximal to insertion site is more efficient and allows knock-in at non-expressed genes.
(A) Schematic showing the relative position of guide RNAs in the 3’ UTR. The first set of gRNA (gRNA1) cuts proximal to the stop codon, the second set (gRNA 2) cuts distal. Average distance of cut site from the insertion site is shown for both sets of gRNAs against 50 TFs. (B) Representative V5 ICC images of Sox3, Sox5, and Sox8 V5 knock-in bulk populations obtained with gRNA 1 (left panels) and gRNA 2 (right panels) are shown; % V5 knock-in efficiency for each experiment is shown at the right bottom of V5 panels (numbers in white). (C) Heatmap representation of V5 knock-in efficiency obtained with gRNA1 and gRNA2 for different genes, color code is shown on the right. (D) Example of sequencing traces using the bulk populations of V5-tagged cells for Sox8 and Foxj3. Alignment with the expected TF-V5 chimeric sequence is shown.
Figure 4—figure supplement 1.
Figure 4—figure supplement 1.. V5 tag-specific PCR amplification of bulk populations gene-edited using first set of gRNAs.
(A) Schematics showing location of gRNAs, first set of gRNAs cut proximal to the stop codon and shown in red. (B) PCR strategy is shown, a V5 tag-specific reverse primer and a TF exon-specific forward primer were used to amplify HDR-edited regions for each of the 50 TFs. (C) Agarose gel analysis of PCR product. Gene names are indicated at the top of each lane, lanes marked with ‘+’ denote successful knock-in of the V5-encoding sequence at the target gene (based on the expected size of PCR products), 1kb + DNA ladder is marked ‘L’.
Figure 4—figure supplement 2.
Figure 4—figure supplement 2.. V5 tag-specific PCR amplification of bulk populations gene-edited using second set of gRNAs.
(A) Schematics showing location of gRNAs, second set of gRNAs cut distal to the stop codon and shown in red. (B) PCR strategy is shown, a V5 tag-specific reverse primer and a TF exon-specific forward primer were used to amplify HDR-edited regions for each of the 50 TFs. (C) Agarose gel analysis of PCR product. Gene names are indicated at the top of each lane, lanes marked with ‘+’ denote successful knock-in of the V5-encoding sequence at the target gene (based on the expected size of PCR products), 1kb + DNA ladder is marked ‘L’.
Figure 4—figure supplement 3.
Figure 4—figure supplement 3.. Sanger sequencing confirms error-free insertion of V5-encoding sequence at the C-terminus of expressed and non-expressed genes.
Schematics at the top shows the PCR amplification of HDR-edited loci using a TF exon-specific forward primer and a V5 tag-specific reverse primer. Sequencing traces from the respective PCR amplicons were aligned with the expected TF-V5 chimeric sequence.
Figure 5.
Figure 5.. A simple pipeline for high-throughput epitope knock-in using 96-well format.
In the first step, crRNAs and matched ssODNs are designed (either single input or batch processing) using the ‘Tag-IN’ bioinformatics tool. The tool picks top two crRNAs in the 3’UTR (within 8–15 bp from stop codon if high-quality crRNAs available) and designs an ssODN for each query based on user’s choice of the epitope tag. After the procurement of CRISPR ingredients from the supplier, the RNPs and matched ssODNs are assembled in vitro in 96-well plates (step 2) and transfected into stem cells using Amaxa shuttle system (step 3). Five days after the transfection, a replica plate is processed for V5 ICC and images are captured using high-content imaging system Operetta (step 4). V5-positive cells from the corresponding wells can be later expanded to derive clonal lines for downstream applications (step 5,6).
Figure 6.
Figure 6.. High-throughput epitope knock-in in a 96-well format.
(A) Heat map of V5 knock-in efficiency across the entire 96-well plate. The positive control Sox2 was included in six different wells (marked with ‘+’). (B) Representative ICC images of V5 knock-in from figure (a) are shown, nuclear stain DAPI (blue) and TF-V5 fusion protein (yellow) are shown. (C) A 96-well plate heatmap of V5 knock-in for another set of 96 TFs. (D) Representative V5 knock-in panels, as obtained from the Operetta system, for the 96-well plate from (C) are shown, well number is indicated in the merged panel of each TF. Nuclear stain DAPI (blue), entire cell stain CellMask HCS (green), and V5 tag (red) are shown. (E) Top 30 TFs with highest knock-in efficiency from (A) and (C).
Figure 7.
Figure 7.. Identification of Olig2 partners using V5 knock-in lines.
Mouse GNS Olig2-V5 cells were used for the identification of Olig2 interaction partners. (A) RIME analysis, volcano plot showing log(2) fold change plotted against −log(10) p value for endogenously V5-tagged Olig2 samples versus samples generated from an untagged parental cell line. (B) ChIP-SICAP analysis, proteins identified in the chromatin-bound complexes are ranked based on iBAQ score in the descending order.
Figure 8.
Figure 8.. Knock-in of mCherry reporter using Cas9 RNP delivery.
(A) Schematics of the mCherry knock-in experiment is shown. NS cells were electroplated with Cas9 RNP complex along with a dsDNA donor DNA, which was amplified using a vector plasmid that harbours mCherry encoding sequences flanked by promoter-less Sox2 homology arms. Cells were allowed to recover and expand for 7 days and then analysed by flow-cytometry for mCherry knock-in. (B) Flow-cytometry analysis of mCherry knock-in at Sox2 locus. Effect of variable length of homology arms was assessed, composite graph for all the panels is shown at the right bottom. (C) Flow-cytometry analysis of mCherry knock-in at Olig2 and Foxg1 loci, a donor DNA containing 500 bp homology arms was used for each gene. (D) Live-images of the mCherry-sorted populations are shown. Top panels show phase contrast and mCherry merged; bottom panels show mCherry alone.

References

    1. Aida T, Chiyo K, Usami T, Ishikubo H, Imahashi R, Wada Y, Tanaka KF, Sakuma T, Yamamoto T, Tanaka K. Cloning-free CRISPR/Cas system facilitates functional cassette knock-in in mice. Genome Biology. 2015;16:87. doi: 10.1186/s13059-015-0653-x. - DOI - PMC - PubMed
    1. Anderson EM, Haupt A, Schiel JA, Chou E, Machado HB, Strezoska Ž, Lenger S, McClelland S, Birmingham A, Vermeulen A, Smith A. Systematic analysis of CRISPR-Cas9 mismatch tolerance reveals low levels of off-target activity. Journal of Biotechnology. 2015;211:56–65. doi: 10.1016/j.jbiotec.2015.06.427. - DOI - PubMed
    1. Bhaya D, Davison M, Barrangou R. CRISPR-Cas systems in bacteria and archaea: versatile small RNAs for adaptive defense and regulation. Annual Review of Genetics. 2011;45:273–297. doi: 10.1146/annurev-genet-110410-132430. - DOI - PubMed
    1. Bialk P, Rivera-Torres N, Strouse B, Kmiec EB. Regulation of gene editing activity directed by single-stranded oligonucleotides and CRISPR/Cas9 systems. PLoS One. 2015;10:e0129308. doi: 10.1371/journal.pone.0129308. - DOI - PMC - PubMed
    1. Bressan RB, Dewari PS, Kalantzaki M, Gangoso E, Matjusaitis M, Garcia-Diaz C, Blin C, Grant V, Bulstrode H, Gogolok S, Skarnes WC, Pollard SM. Efficient CRISPR/Cas9-assisted gene targeting enables rapid and precise genetic manipulation of mammalian neural stem cells. Development. 2017;144:635–648. doi: 10.1242/dev.140855. - DOI - PMC - PubMed

Publication types

MeSH terms