. 2018 Apr 11;13(4):e0195850.
doi: 10.1371/journal.pone.0195850. eCollection 2018.

Use of capillary Western immunoassay (Wes) for quantification of dystrophin levels in skeletal muscle of healthy controls and individuals with Becker and Duchenne muscular dystrophy

Affiliations

Use of capillary Western immunoassay (Wes) for quantification of dystrophin levels in skeletal muscle of healthy controls and individuals with Becker and Duchenne muscular dystrophy

Chantal Beekman et al. PLoS One. .

Abstract

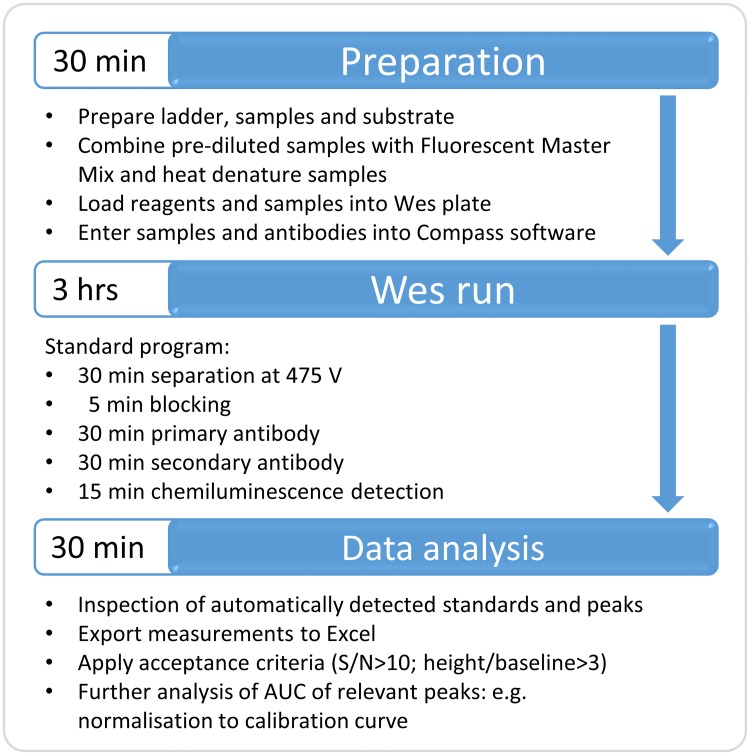
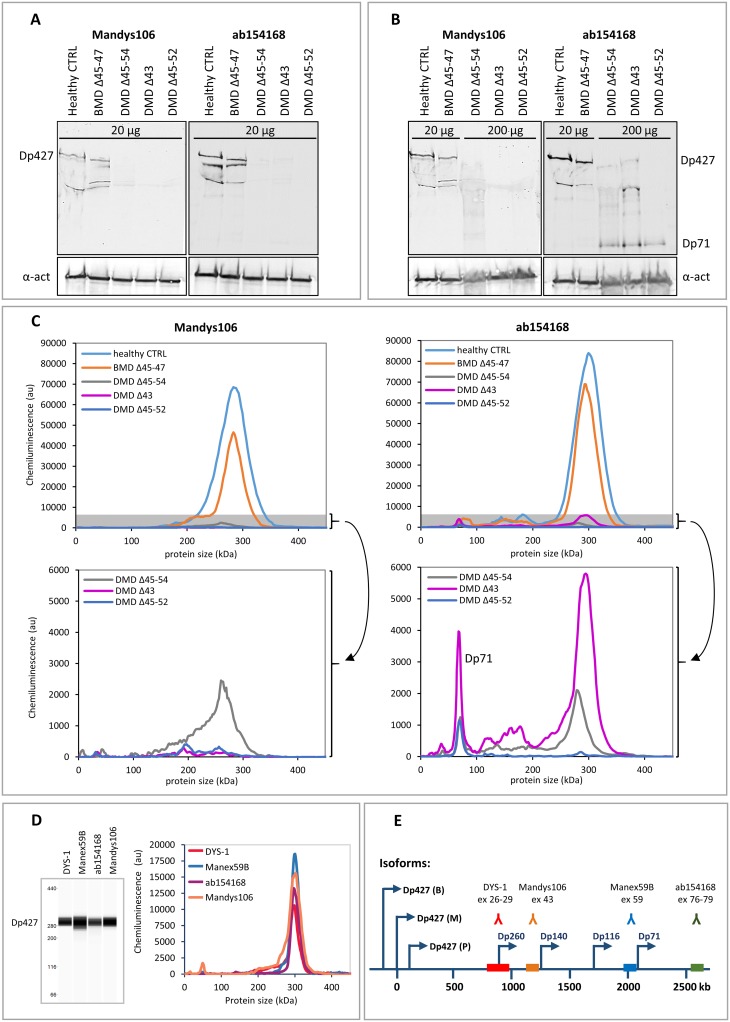
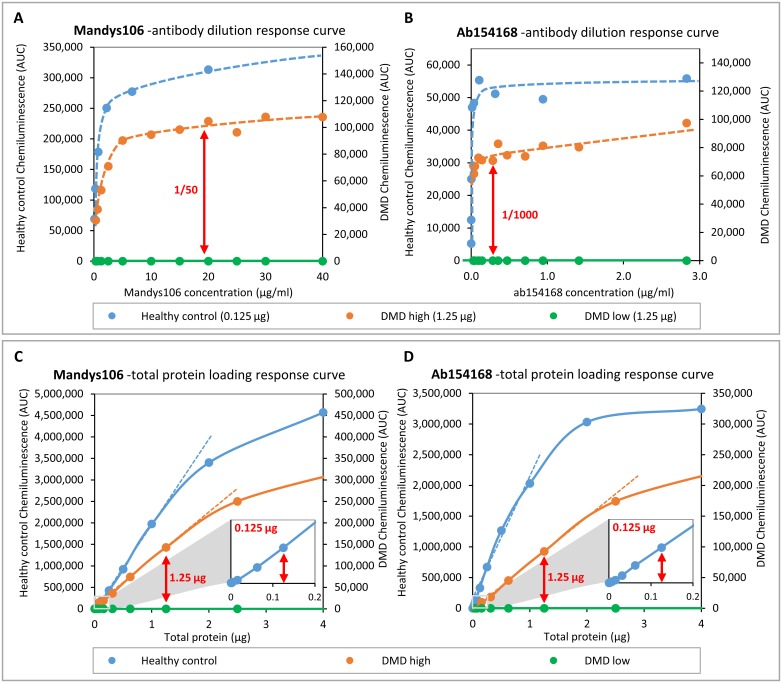
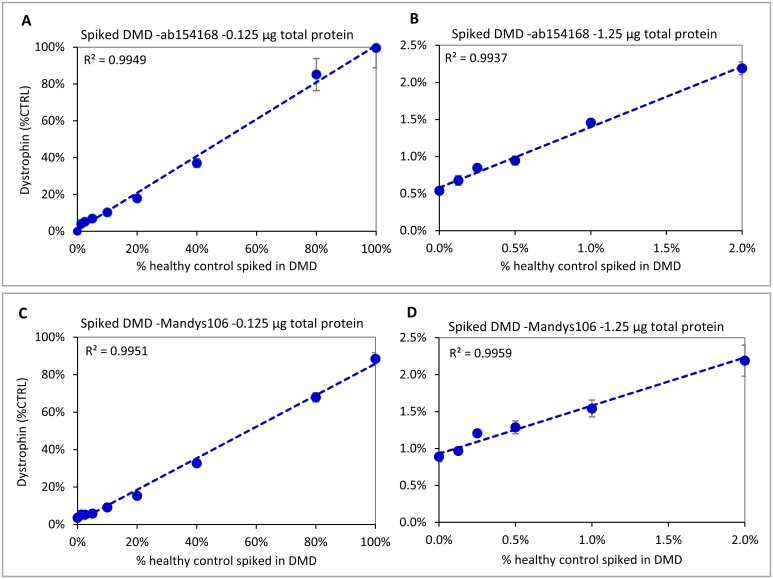
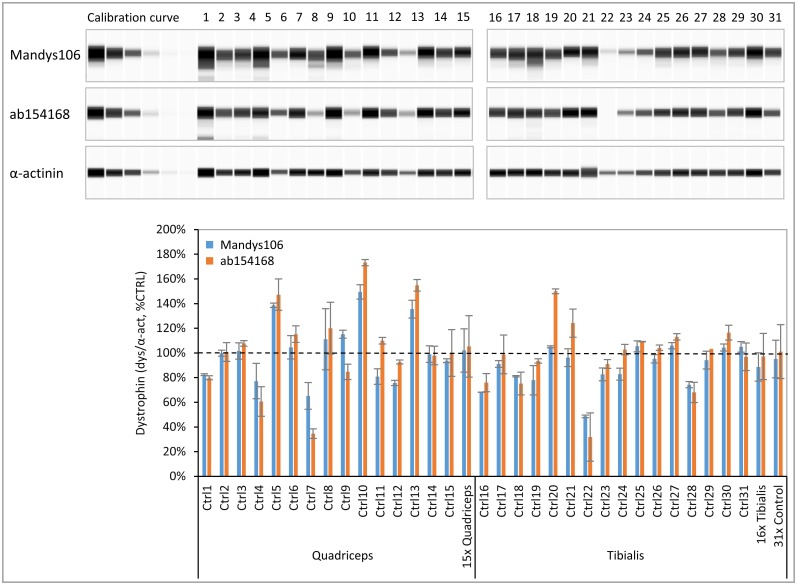
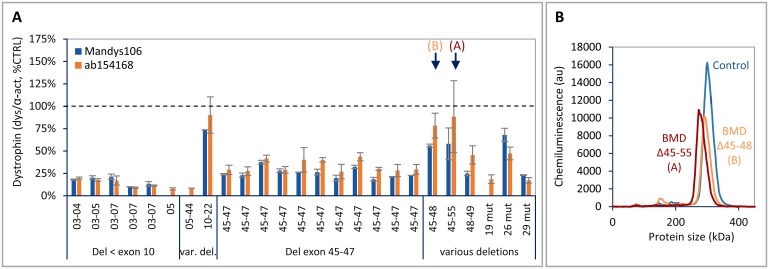
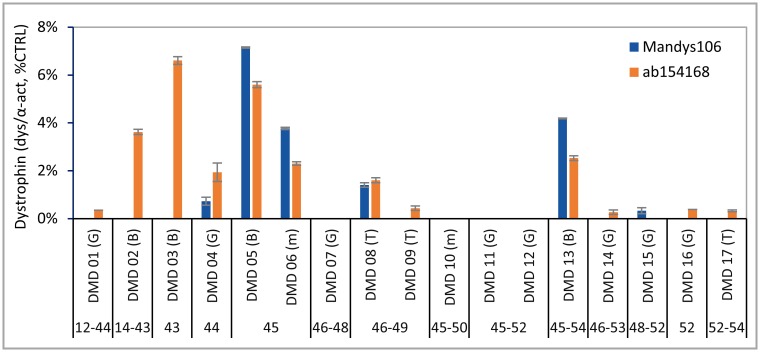
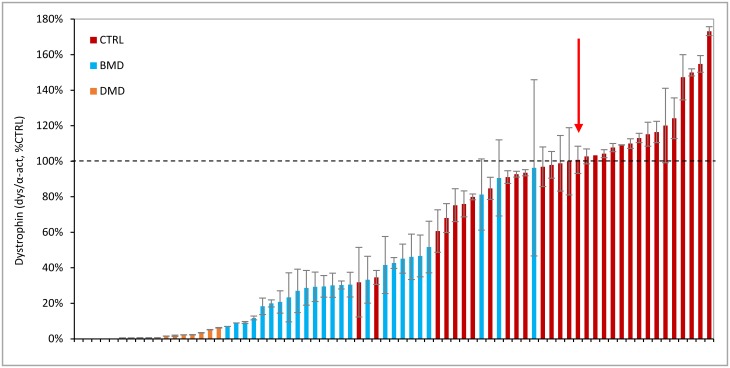
Duchenne muscular dystrophy (DMD) is a neuromuscular disease characterized by progressive weakness of the skeletal and cardiac muscles. This X-linked disorder is caused by open reading frame disrupting mutations in the DMD gene, resulting in strong reduction or complete absence of dystrophin protein. In order to use dystrophin as a supportive or even surrogate biomarker in clinical studies on investigational drugs aiming at correcting the primary cause of the disease, the ability to reliably quantify dystrophin expression in muscle biopsies of DMD patients pre- and post-treatment is essential. Here we demonstrate the application of the ProteinSimple capillary immunoassay (Wes) method, a gel- and blot-free method requiring less sample, antibody and time to run than conventional Western blot assay. We optimized dystrophin quantification by Wes using 2 different antibodies and found it to be highly sensitive, reproducible and quantitative over a large dynamic range. Using a healthy control muscle sample as a reference and α-actinin as a protein loading/muscle content control, a panel of skeletal muscle samples consisting of 31 healthy controls, 25 Becker Muscle dystrophy (BMD) and 17 DMD samples was subjected to Wes analysis. In healthy controls dystrophin levels varied 3 to 5-fold between the highest and lowest muscle samples, with the reference sample representing the average of all 31 samples. In BMD muscle samples dystrophin levels ranged from 10% to 90%, with an average of 33% of the healthy muscle average, while for the DMD samples the average dystrophin level was 1.3%, ranging from 0.7% to 7% of the healthy muscle average. In conclusion, Wes is a suitable, efficient and reliable method for quantification of dystrophin expression as a biomarker in DMD clinical drug development.


Conflict of interest statement

Competing Interests: CB, AAJ, AB, JCvD and NAD are employees (which includes contribution to patent [applications] and participation in stock-option plans) of BioMarin Nederland BV (formerly Prosensa Therapeutics BV) that sponsored this study. BioMarin is a company that develops and provides innovative therapeutics to patients with serious unmet medical needs. JCvD is inventor on several exon skipping patents for DMD. This does not alter the authors’ adherence to PLOS ONE policies on sharing data and materials.

Figures

Fig 1
Fig 1. Workflow of Wes procedure.
The required steps and time to complete a Wes run and analysis are indicated.
Fig 2
Fig 2. Comparison of dystrophin detection by Western blot and Wes in skeletal muscle samples from a healthy control, a BMD patient and 3 DMD patients.
Western blot analysis of a healthy control, a BMD and 3 DMD samples. Expected molecular weights: BMD del45-47: 410 kDa, DMD del45-54: 367 kDa, DMD del43: 422 kDa, DMD del45-52: 381 kDa. A) A dystrophin signal is visible of the expected size (427 kDa) in the healthy control and BMD samples when loading 20 μg per lane, but not for the DMD samples. B) Loading of 10x more material (200 μg per lane) results in a weak dystrophin signal for 2 out of the 3 DMD samples using ab154168 and no signal using Mandys106. The lower panel shows the α-actinin signal. Note that the middle DMD sample has a deletion of exon 43 (epitope for Mandys106), so it is not expected to produce a signal. The additional bands of lower molecular weight are either degradation products and/or dystrophin isoforms. C) Wes analysis of the same samples: At 1 μg total protein (5 μl of a 200 μg/ml dilution) clear signals are detected at 300 kDa for all but the lowest DMD sample using ab154168. The bottom graphs show the DMD data again, only with adjusted y-axes, to zoom in on the grey shaded areas of the upper graphs. D) Virtual blot and electropherogram representation of a typical full length dystrophin signal in a healthy control sample detected by Wes. The dystrophin signal is detected using 4 different antibodies: Dys-1 (1/25 antibody, loaded 0.04 μg protein), Manex59B (1/100 antibody, loaded 0.15 μg protein), ab154168 (1/1000 antibody, loaded 0.13 μg protein) and Mandys106 (1/50 antibody, loaded 0.13 μg protein). E) An overview of the dystrophin antibody epitopes recognised by the different antibodies and the exons coding for the epitopes. The arrows indicate the promotors of the different dystrophin isoforms (Dp427: brain (B), muscle (M) and Purkinje (P); Dp260, Dp140, Dp116 and Dp71).
Fig 3
Fig 3. Optimization of antibody dilution for Mandys106 and ab154168 and determining linearity of quantification.
Skeletal muscle samples from a healthy control and a DMD patient with high trace dystrophin and a DMD patient with low or complete absence of dystrophin were used for optimisation and to determine the linear range of quantification. A and B) Dystrophin detected in healthy control (25 μg/ml) and DMD (250 μg/ml) samples using different antibody dilutions. C and D) Dystrophin detected in different amounts of healthy muscle lysate, using the antibody concentrations established in -Aand B (Mandys106: 1/50; ab154168: 1/1000). The small squares at the bottom right of graphs C and D represent a zoomed-in section of the low protein concentration range, to show signal linearity between 0 and 0.2 μg total protein. The arrows indicate the dilutions/concentrations selected for further experiments.
Fig 4
Fig 4. Dynamic ranges for ab154168 and Mandys106 using different amounts of healthy control sample spiked into a DMD sample.
Both antibodies show good linearity from ~5%-100% of healthy control when loading 0.125 μg (A and C). When loading 1.25 μg (B and D), ab154168 shows good linearity down to 0.125% of healthy control, while for Mandys106 samples with dystrophin levels ≤0.5% of control become hard to distinguish, due to the higher aspecific background signal. Experiments were performed in triplicate.
Fig 5
Fig 5. Dystrophin levels in skeletal muscle samples derived from healthy controls.
A panel of 31 healthy human tibialis and quadriceps muscle samples was analysed for dystrophin using ab154168 and Mandys106 and normalized to α-actinin (n = 2). Protein loading was 0.125 μg. A) Virtual blot view of Wes result (lanes compiled from 2 runs) showing the dystrophin levels obtained with antibodies Mandys106 and ab154168 (top panels) and the α-actinin signal (lower panel). B) Dystrophin levels (divided by α-actinin) expressed as a percentage of the control (% CTRL). In addition to the individual sample values, the average dystrophin levels of all 15 quadriceps samples, the 16 tibialis samples and all 31 samples are displayed. The dashed line represents 100% of CTRL.
Fig 6
Fig 6. Dystrophin levels in skeletal muscle samples derived from BMD patients.
Panel of 25 tibialis samples from BMD patients, analysed for dystrophin using ab154168 and Mandys106 and normalized to α-actinin (n = 2). Protein loading was 0.125 μg. A) Dystrophin levels (divided by α-actinin) expressed as a percentage of healthy control (% CTRL). The 2 BMD samples indicated by an arrow are depicted in B. B) Electropherogram showing the molecular weight shift of the peaks for mutant dystrophin with different sizes derived from the 2 BMD samples (A and B) indicated by an arrow in A, compared to a control sample with full-length dystrophin. BMD A (del 45–55: calculated MW = 358 kDa, expected apparent MW on Wes is 279 kDa; BMD B (del 45–48): calculated MW = 401 kDa, expected apparent MW on Wes is 294 kDa.
Fig 7
Fig 7. Dystrophin levels in skeletal muscle samples derived from DMD patients.
Panel of 17 gastrocnemius, biceps and tibialis muscle samples from DMD patients, analysed for dystrophin using ab154168 and Mandys106 and normalized to α-actinin (n = 2). Protein loading was 1.25 μg. Muscle types are indicated between brackets: G = gastrocnemius; B = biceps; T = tibialis and M = miscellaneous.
Fig 8
Fig 8. Summary of dystrophin levels in all healthy control, BMD and DMD samples analysed by Wes.
Dystrophin levels obtained in all 31 healthy controls, 25 BMD and 17 DMD skeletal muscle samples using ab154168. The samples are normalized to α-actinin, expressed as a percentage of the standard control (% CTRL) and ranked from low to high dystrophin levels. DMD samples in orange, BMD in blue and healthy controls in red. The dashed line represents 100% CTRL; the red arrow shows the median of the healthy control samples, with a value of 101%.

Similar articles

Cited by

References

    1. Emery A. Duchenne muscular dystrophy. 2nd ed Oxford, England: Oxford University Press; 1993.
    1. Ryder S, Leadley R, Armstrong N, Westwood M, de Kock S, Butt T, et al. The burden, epidemiology, costs and treatment for Duchenne muscular dystrophy: an evidence review. Orphanet J Rare Dis. 2017;12: 79 doi: 10.1186/s13023-017-0631-3 - DOI - PMC - PubMed
    1. Muntoni F, Torelli S, Ferlini A. Dystrophin and mutations: one gene, several proteins, multiple phenotypes. Lancet Neurol. 2003;2: 731–740. - PubMed
    1. Abbs S, Tuffery-Giraud S, Bakker E, Ferlini A, Sejersen T, Mueller C. Best practice guidelines on molecular diagnostics in Duchenne/Becker muscular dystrophies. Neuromuscul Disord. 2010;20: 422–427. doi: 10.1016/j.nmd.2010.04.005 - DOI - PubMed
    1. Allen D, Whitehead N, Froehner S. Absence of dystrophin disrupts skeletal muscle signaling: Roles of Ca2+, reactive oxygen spcies, and nitric oxide in the development of muscular dystrophy. Physiol Rev. 2016;96: 253–305. doi: 10.1152/physrev.00007.2015 - DOI - PMC - PubMed

Publication types