. 2018 Apr 12;378(15):1396-1407.
doi: 10.1056/NEJMoa1801445.

Genetics and Pathogenesis of Diffuse Large B-Cell Lymphoma

Affiliations

Genetics and Pathogenesis of Diffuse Large B-Cell Lymphoma

Roland Schmitz et al. N Engl J Med. .

Abstract

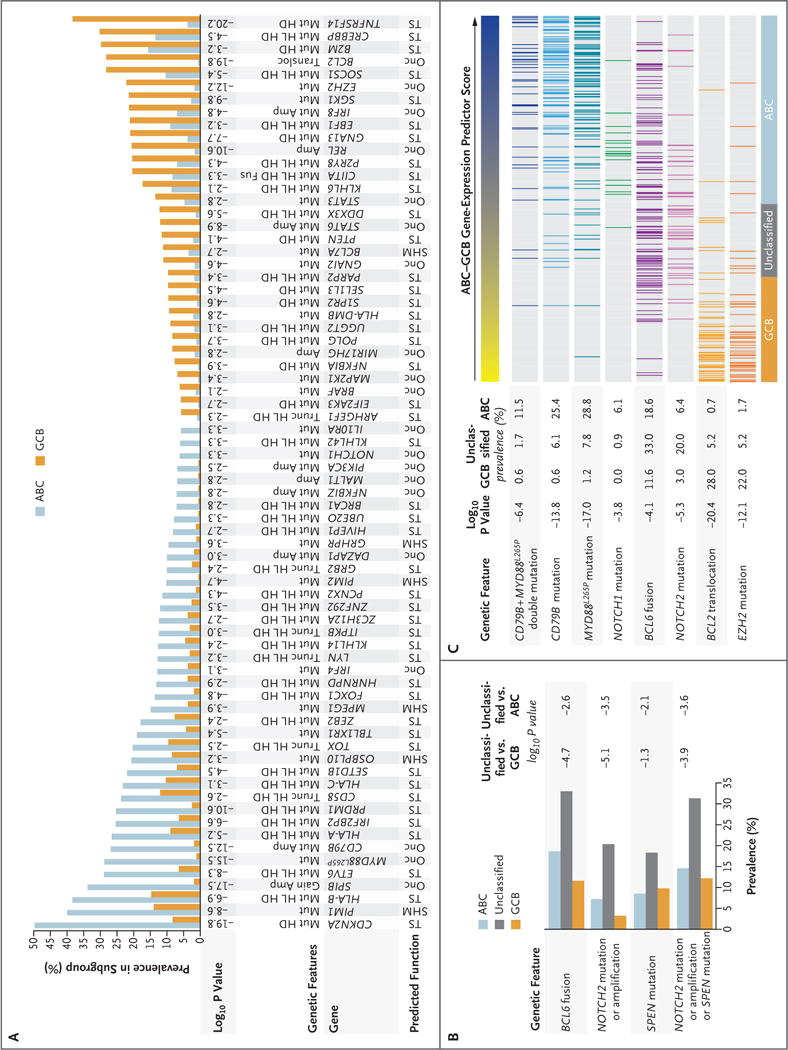
Background: Diffuse large B-cell lymphomas (DLBCLs) are phenotypically and genetically heterogeneous. Gene-expression profiling has identified subgroups of DLBCL (activated B-cell-like [ABC], germinal-center B-cell-like [GCB], and unclassified) according to cell of origin that are associated with a differential response to chemotherapy and targeted agents. We sought to extend these findings by identifying genetic subtypes of DLBCL based on shared genomic abnormalities and to uncover therapeutic vulnerabilities based on tumor genetics.

Methods: We studied 574 DLBCL biopsy samples using exome and transcriptome sequencing, array-based DNA copy-number analysis, and targeted amplicon resequencing of 372 genes to identify genes with recurrent aberrations. We developed and implemented an algorithm to discover genetic subtypes based on the co-occurrence of genetic alterations.

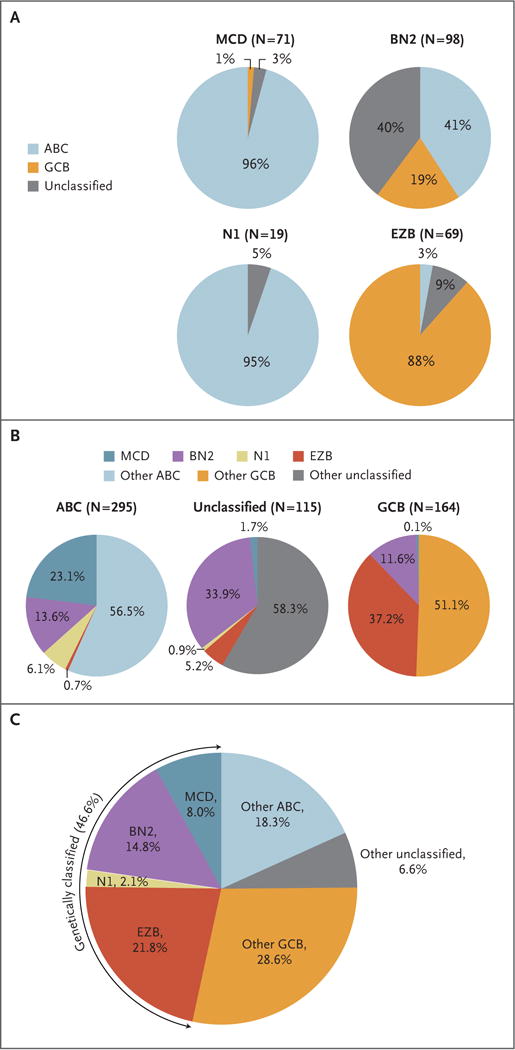
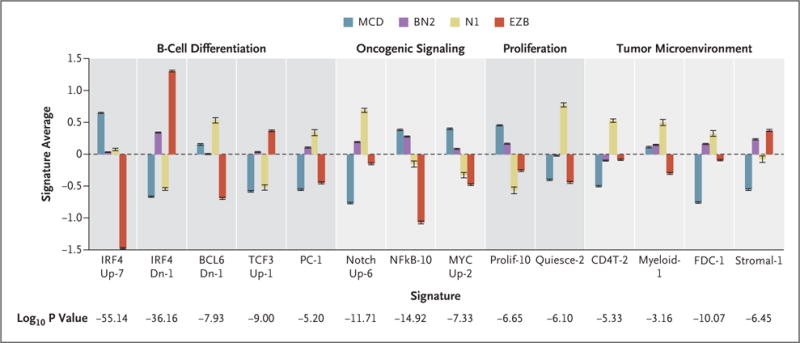
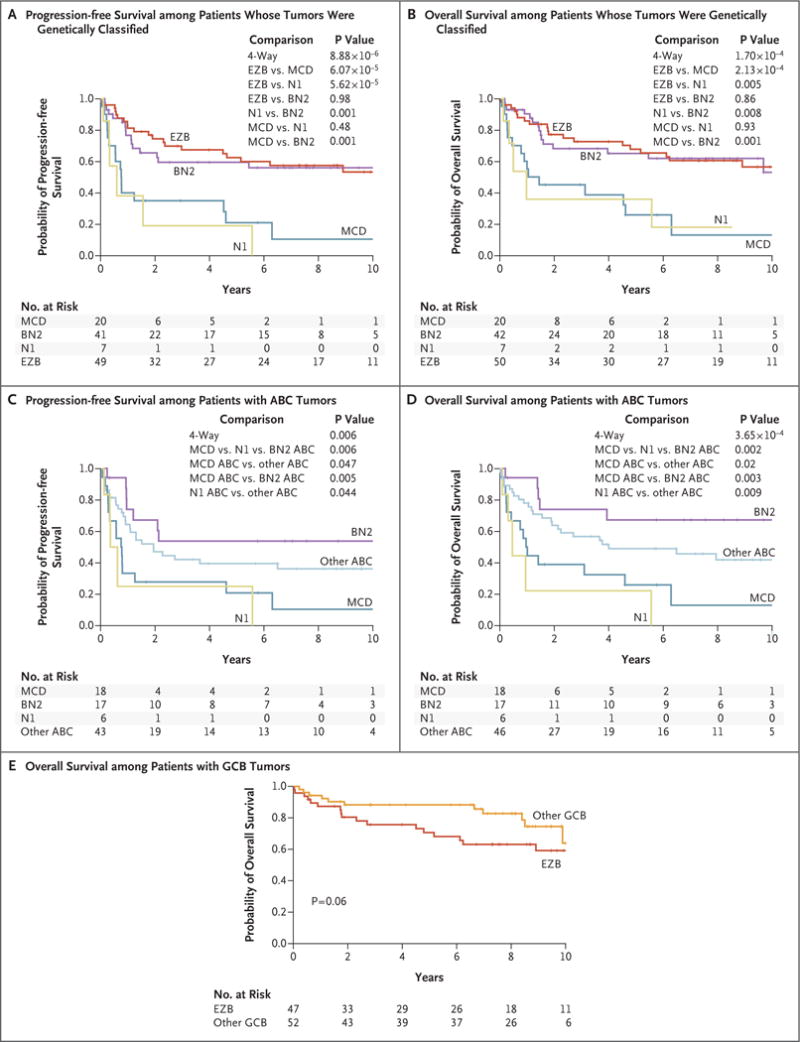
Results: We identified four prominent genetic subtypes in DLBCL, termed MCD (based on the co-occurrence of MYD88L265P and CD79B mutations), BN2 (based on BCL6 fusions and NOTCH2 mutations), N1 (based on NOTCH1 mutations), and EZB (based on EZH2 mutations and BCL2 translocations). Genetic aberrations in multiple genes distinguished each genetic subtype from other DLBCLs. These subtypes differed phenotypically, as judged by differences in gene-expression signatures and responses to immunochemotherapy, with favorable survival in the BN2 and EZB subtypes and inferior outcomes in the MCD and N1 subtypes. Analysis of genetic pathways suggested that MCD and BN2 DLBCLs rely on "chronic active" B-cell receptor signaling that is amenable to therapeutic inhibition.

Conclusions: We uncovered genetic subtypes of DLBCL with distinct genotypic, epigenetic, and clinical characteristics, providing a potential nosology for precision-medicine strategies in DLBCL. (Funded by the Intramural Research Program of the National Institutes of Health and others.).


Figures

Figure 1
Figure 1. (facing page). Relationship between Gene-Expression Subgroups and Genetic Alterations
Panel A shows genetic aberrations that distinguish the activated B-cell–like (ABC) and germinal-center B-cell–like (GCB) subgroups of diffuse large B-cell lymphoma (DLBCL). Shown is the prevalence of the indicated genetic abnormalities in 72 genes in ABC and GCB, along with the log10 P value for the difference in prevalence between the two subgroups. Putative assignment as an oncogene (Onc), tumor suppressor (TS), or target of aberrant somatic hypermutation (SHM) is shown. Amp denotes amplification, Fus gene fusion, Gain single-copy gain, HD homozygous deletion, HL heterozygous loss, Mut mutation, Transloc translocation, and Trunc proteintruncating mutation. Panel B shows genetic lesions that are associated with unclassified DLBCL. Shown is the prevalence of the indicated genetic aberrations in the gene-expression subgroups, along with the log10 P values for the differences between unclassified and either ABC or GCB. Panel C shows the correlation between genetic abnormalities and the ABC–GCB gene-expression predictor score. The ABC–GCB predictor score is a quantitative metric used to assign DLBCL cases to the indicated gene-expression subgroups. High values (blue) are on the ABC end of the spectrum, and low values (yellow) are on the GCB end of the spectrum. The log10 P value of the correlation between the predictor score and the presence of the indicated aberrations is shown.
Figure 2
Figure 2. Genetic Aberrations That Distinguish Genetic Subtypes of DLBCL
Panel A shows the distribution of gene-expression subgroups within genetic subtypes, termed MCD (based on the co-occurrence of MYD88L265P and CD79B mutations), BN2 (based on BCL6 fusions and NOTCH2 mutations), N1 (based on NOTCH1 mutations), and EZB (based on EZH2 mutations and BCL2 translocations). Panel B shows the distribution of genetic subtypes within gene-expression subgroups. In Panels A and B, the number of cases of DLBCL is shown in parentheses. Panel C shows the predicted prevalence of the indicated DLBCL subsets in a population-based cohort.
Figure 3
Figure 3. Gene-Expression Signatures That Distinguish the DLBCL Genetic Subtypes
The mean values of the indicated signature averages for cases assigned to each genetic subtype are shown. A full annotation of these signatures is available in Figure S3 in Supplementary Appendix 1 and at https://lymphochip.nih.gov/signaturedb/. P values were calculated with the use of an F-test. I bars indicate standard errors.
Figure 4
Figure 4. (facing page). Relationship between DLBCL Genetic Subtypes and Survival after R-CHOP Chemotherapy
Panels A and B show Kaplan–Meier models of progression-free survival and overall survival, respectively, according to DLBCL genetic subtype. Panels C and D show Kaplan–Meier models of progression-free survival and overall survival, respectively, among patients with ABC DLBCL according to genetic subtype and including patients with non-subtyped ABC cases as “other ABC.” Panel E shows a Kaplan–Meier model of overall survival among patients with GCB DLBCL cases belonging to the EZB subtype or not (“other GCB”). R-CHOP denotes rituximab, cyclophosphamide, doxorubicin, vincristine, and prednisone.
Figure 5
Figure 5. Genetic Aberrations Targeting Oncogenic Signaling Pathways in DLBCL
Shown is the prevalence of putative gain-of-function or loss-of-function genetic aberrations targeting genes in each indicated oncogenic signaling category. The prevalence of genetic aberrations is indicated by the color scale shown. Genetic aberrations included for each gene are indicated in Figure S5B in Supplementary Appendix 1. BCR denotes B-cell receptor, CBM complex CARD11–BCL10–MALT1 signaling adaptor complex, mRNA messenger RNA, and NF-κB nuclear factor κB.

Comment in

References

    1. Alizadeh AA, Eisen MB, Davis RE, et al. Distinct types of diffuse large B-cell lymphoma identified by gene expression profiling. Nature. 2000;403:503–11. - PubMed
    1. Rosenwald A, Wright G, Chan WC, et al. The use of molecular profiling to predict survival after chemotherapy for diffuse large-B-cell lymphoma. N Engl J Med. 2002;346:1937–47. - PubMed
    1. Lenz G, Wright G, Dave SS, et al. Stromal gene signatures in large-B-cell lymphomas. N Engl J Med. 2008;359:2313–23. - PMC - PubMed
    1. Wilson WH, Young RM, Schmitz R, et al. Targeting B cell receptor signaling with ibrutinib in diffuse large B cell lymphoma. Nat Med. 2015;21:922–6. - PMC - PubMed
    1. Shaffer AL, III, Young RM, Staudt LM. Pathogenesis of human B cell lymphomas. Annu Rev Immunol. 2012;30:565–610. - PMC - PubMed

Publication types