. 2018 Apr 10;23(2):442-458.
doi: 10.1016/j.celrep.2018.03.067.

FOXF1 Inhibits Pulmonary Fibrosis by Preventing CDH2-CDH11 Cadherin Switch in Myofibroblasts

Affiliations

FOXF1 Inhibits Pulmonary Fibrosis by Preventing CDH2-CDH11 Cadherin Switch in Myofibroblasts

Markaisa Black et al. Cell Rep. .

Abstract

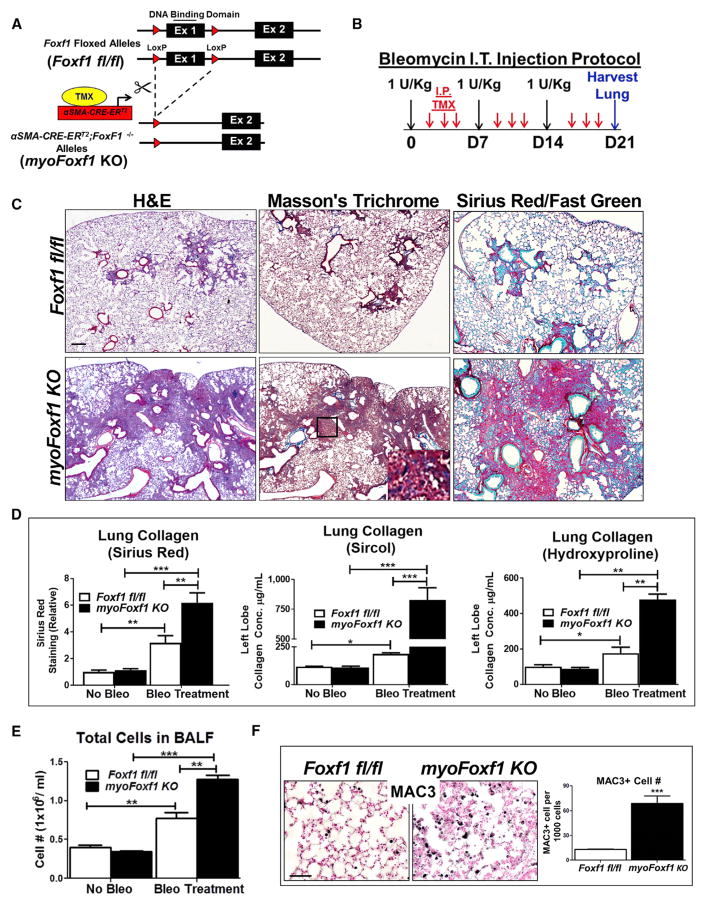
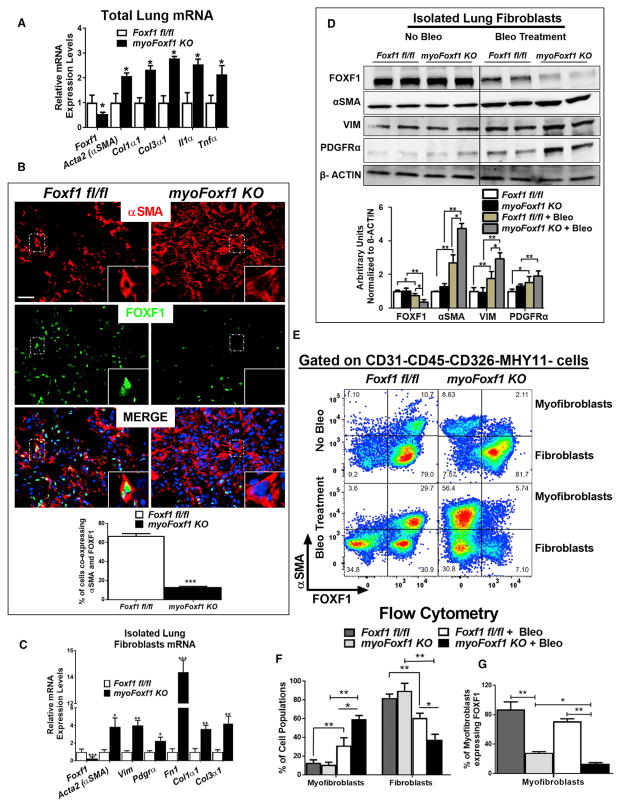
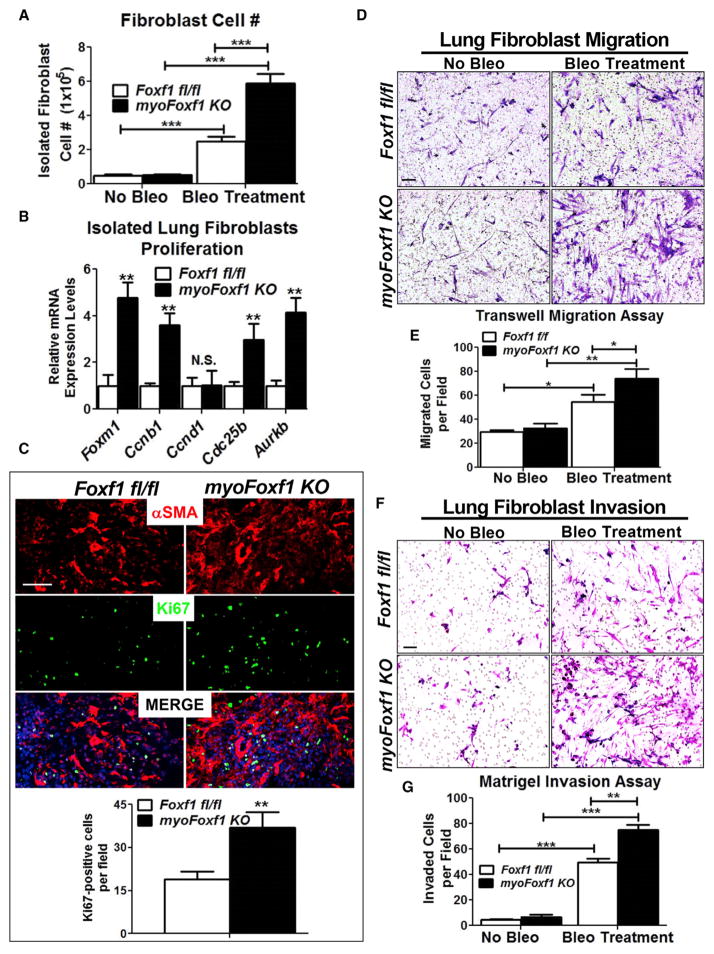
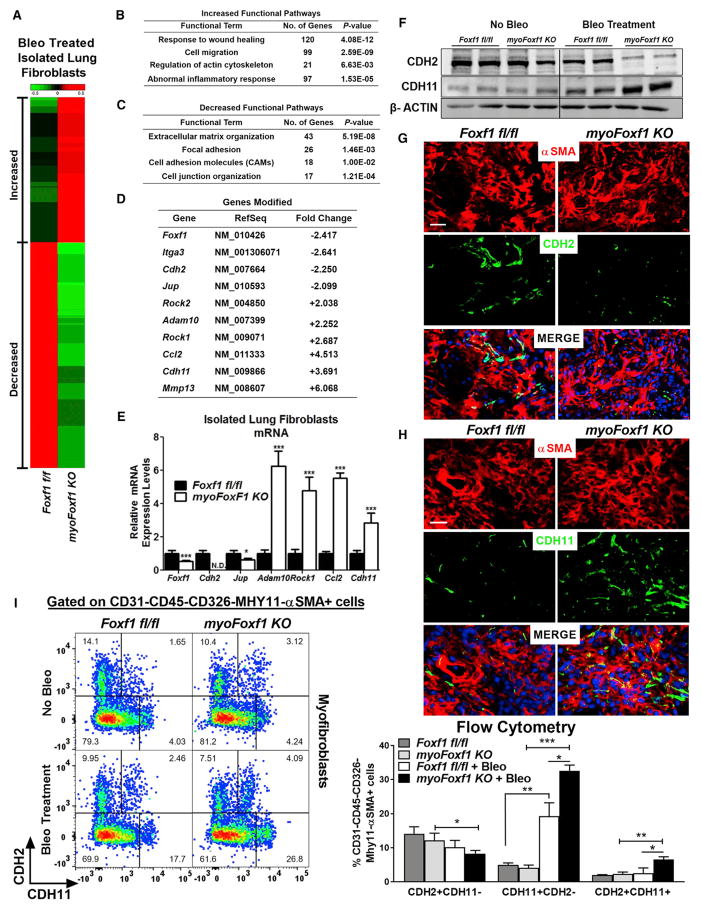
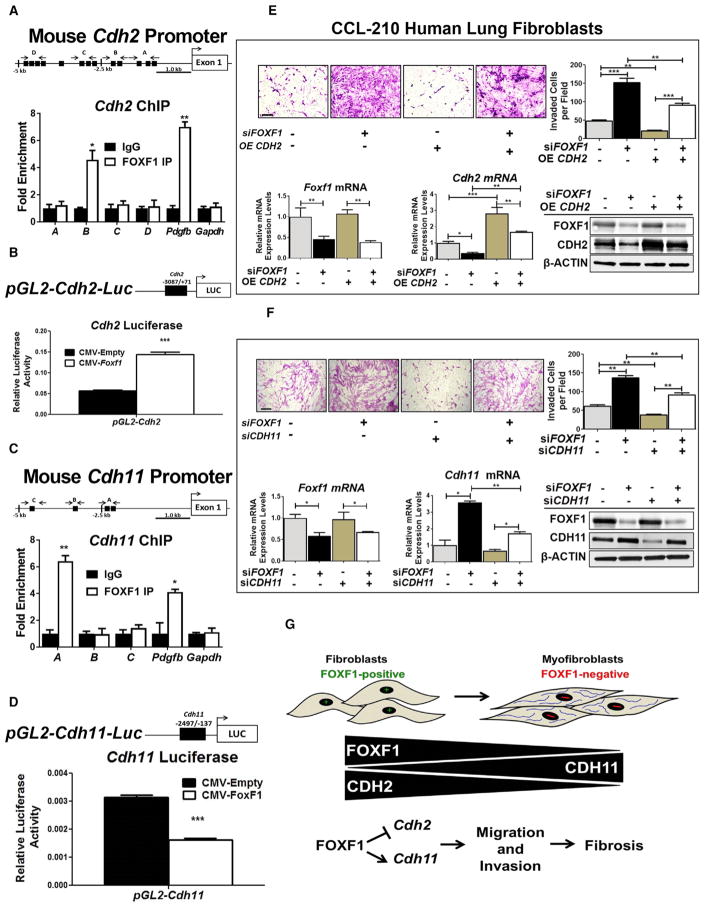
Idiopathic pulmonary fibrosis (IPF) is characterized by aberrant accumulation of collagen-secreting myofibroblasts. Development of effective therapies is limited due to incomplete understanding of molecular mechanisms regulating myofibroblast expansion. FOXF1 transcription factor is expressed in resident lung fibroblasts, but its role in lung fibrosis remains unknown due to the lack of genetic mouse models. Through comprehensive analysis of human IPF genomics data, lung biopsies, and transgenic mice with fibroblast-specific inactivation of FOXF1, we show that FOXF1 inhibits pulmonary fibrosis. FOXF1 deletion increases myofibroblast invasion and collagen secretion and promotes a switch from N-cadherin (CDH2) to Cadherin-11 (CDH11), which is a critical step in the acquisition of the pro-fibrotic phenotype. FOXF1 directly binds to Cdh2 and Cdh11 promoters and differentially regulates transcription of these genes. Re-expression of CDH2 or inhibition of CDH11 in FOXF1-deficient cells reduces myofibroblast invasion in vitro. FOXF1 inhibits pulmonary fibrosis by regulating a switch from CDH2 to CDH11 in lung myofibroblasts.

Keywords: CDH11; CDH2; FOXF1; cadherins; myofibroblasts; pulmonary fibrosis; transgenic mice.


Conflict of interest statement

DECLARATION OF INTERESTS

The authors declare no competing interests.

Figures

Figure 1
Figure 1. Decreased FOXF1 in Human IPF and Mouse Bleomycin-Treated Lungs
(A) FOXF1 mRNA is decreased in fibroblasts isolated from human IPF and normal lung tissues. Data obtained from GEO: GSE44723, GSE17978, and GSE1724. Data presented as mean ± SD. (B) Decreased FOXF1 protein in myofibroblasts of IPF fibrotic foci. Lung sections from human IPF patients (n = 7) and normal lung donors (n = 6) stained with H&E or costained with antibodies against FOXF1 and fibroblast markers. (C) Schematic of bleomycin-induced fibrosis in mice. Lungs from bleomycin-treated mice were harvested on day 14 for early fibrosis and day 28 for chronic fibrosis. (D) Lung collagen was quantified by Sircol collagen assay. (E) Foxf1 mRNA is decreased in isolated lung fibroblasts during lung fibrosis progression, shown by qRT-PCR. Data presented as mean ± SEM. (F) Intensity of FOXF1 staining in lung fibroblasts is decreased during progression of fibrosis, as shown by flow cytometry. Mean fluorescence intensity of FOXF1 was determined for the CD326−CD45−CD31− lung fibroblasts. (G) Percentage of FOXF1+ fibroblasts among CD326−CD45−CD31− lung fibroblasts in untreated and bleomycin-treated mice was determined by flow cytometry and presented as mean ± SD. See also Figure S1. (H) Lung tissue sections from normal and bleomycin-treated mice were stained with H&E or Masson’s trichrome, or costained with antibodies against FOXF1 and fibroblast markers. n = 5 mice/group in (D)–(H). All scale bars indicate 20 μm. *p < 0.05, **p < 0.01, ***p < 0.001 by Student’s t test. See also Figure S1.
Figure 2
Figure 2. Deletion of Foxf1 in αSMA-Expressing Myofibroblasts Accelerates Bleomycin-Induced Pulmonary Fibrosis
(A) Schematic of Foxf1 deletion in αSMA-CRE-ERT2;Foxf1fl/fl (myoFoxf1 KO) transgenic mice. (B) Schematic of bleomycin treatment to induce lung fibrosis. (C) Increased fibrosis and collagen deposition are shown with H&E, trichrome, and Sirius red and fast green stainings. (D) Collagen deposition was quantitated with Sirius red, Sircol, and hydroxyproline assays using control Foxf1fl/fl (n = 9) and myoFoxf1 KO (n = 11) mouse lungs at day 21 after first bleomycin treatment. (E) Increased number of cells in BALF from bleomycin-treated myoFoxf1 KO lungs. (F) Increased number of macrophages in bleomycin-treated myoFoxf1 KO lungs. The number of MAC3+ cells was counted and quantified per 1,000 cells using 10 random microscope fields. Representative images are shown for n = 9–11 mice. Data presented as mean ± SEM. *p < 0.05, **p < 0.01, ***p < 0.001 by Student’s t test. All scale bars indicate 20 μm. See also Figure S2.
Figure 3
Figure 3. Increased Myofibroblast Differentiation and Collagen Production in myoFoxf1 KO Lungs after Bleomycin
(A) Foxf1 depletion increased mRNAs of collagens and inflammatory cytokines. n = 9–11 mice per group. (B) Efficient FOXF1 deletion is shown by immunofluorescence costaining of αSMA and FOXF1 in fibrotic lesions of bleomycin-treated control and myoFoxf1 KO lungs. Percentage of αSMA+/FOXF1+ double-positive cells in control and myoFoxf1 KO mice was quantified and presented as mean ± SD. Scale bars indicate 20 μm. See also Figure S3. (C and D) FOXF1 deletion increased activated myofibroblasts markers in isolated lung fibroblasts from bleomycin-treated myoFoxf1 KO (n = 6) and control (n = 5) mice, shown by (C) qRT-PCR and (D) western blot. Total lung was used to isolate RNA and protein. Western blot data were quantified using densitometry and presented as mean ± SD. See also Figure S3. (E–G) FACS analysis shows an increase in the percentage of myofibroblasts (CD45−CD326−CD31−MHY11−αSMA+) and a decrease in the percentage of fibroblasts (CD45−CD326−CD31−MHY11−αSMA−) in bleomycin-treated myoFoxf1 KO lungs. (E) Representative dot plots and (F) quantification of the percentage of myofibroblasts and fibroblasts. Decreased percentage of FOXF1-positive lung myofibroblasts (CD45−CD326−CD31−MHY11−αSMA+) in myoFoxf1 KO mice (G) quantified by FACS analysis. n = 4 mice/group. Data presented as mean ± SEM. *p < 0.05, **p < 0.01, ***p < 0.001 by Student’s t test. See also Figure S4.
Figure 4
Figure 4. Deletion of Foxf1 Increases Fibroblast Migration and Invasion
(A) Increased numbers of fibroblast isolated from bleomycin-treated myoFoxf1 KO lungs. (B) Increased mRNAs of proliferation-specific genes in fibroblasts isolated from myoFoxf1 KO lungs are shown by qRT-PCR. n = 7–8 mice per group. (C) Ki-67 and αSMA costaining in bleomycin-treated lungs. The number of Ki-67+ cells was counted and quantified per image using 10 random microscope fields. n = 7–8 mice per group. (D) Increased migration of fibroblasts isolated from bleomycin-treated myoFoxf1 KO lungs was shown using transwell inserts. (E) Migrated cells were stained with crystal violet and counted. (F) Increased invasion of FOXF1-deficient fibroblasts was assessed using Matrigel-coated transwell inserts. (G) Invaded cells were stained with crystal violet and counted. n = 3 mice/group. Experiments were seeded in triplicates. Data presented as mean ± SEM. *p < 0.05, **p < 0.01, ***p < 0.001 by Student’s t test. All scale bars indicate 20 μm.
Figure 5
Figure 5. FOXF1 Regulates Genes Essential for Myofibroblast Differentiation and Functions
(A) Differentially expressed genes in bleomycin-treated myoFoxf1 KO lungs were identified using RNA-seq analysis. Heatmap of RNA-seq results showing 2,809 coding genes significantly upregulated (red) or downregulated (green) between isolated fibroblasts from bleomycin-treated Foxf1fl/fl and those from myoFoxf1 KO lungs. Samples from three mice per genotype were pooled for RNA-seq analysis. (B and C) Increased (B) and decreased (C) functional pathways influenced by Foxf1 deletion were identified using the ToppGene Suite (https://toppgene.cchmc.org/). The statistical significance of each functional pathway was presented using negative log2 transformation of the p value. (D) Fold changes in mRNA for several genes from the RNA-seq mapped in (A). (E) qRT-PCR validation of several genes found to be differentially expressed by RNA-seq analysis. n = 7–8 mice per genotype. See also Figure S5. (F) FOXF1 regulates CDH2-CDH11 cadherin switching in mouse lung fibroblasts. Representative images of western blot analysis of CDH2 and CDH11 levels in isolated lung fibroblast fractions from Foxf1fl/fl and myoFoxf1 KO lungs. n = 7–8 mice per group. (G and H) Immunofluorescence costaining of (G) αSMA and CDH2 or (H) CDH11 in fibrotic lesions of Foxf1fl/fl and myoFoxf1 KO lungs. Representative images of the staining are shown for n = 9–11 mice. Scale bars indicate 20 μm. (I) FACS shows an increase in the percentage of CDH11+CDH2− and CDH2+CDH11+ myofibroblasts (CD45−CD326−CD31−MHY11−αSMA+) in bleomycin-treated myoFoxf1 KO lungs. Representative dot plots and quantification of the percentage of CDH2+CDH11−, CDH11+CDH2−, and CDH2+CDH11+ myofibroblasts are shown. n = 4 mice/group. Data presented as mean ± SEM. *p < 0.05, **p < 0.01, ***p < 0.001 by Student’s t test. See also Figure S6.
Figure 6
Figure 6. FOXF1 Regulates CDH2-CDH11 Cadherin Switching in Human IPF Lung Fibroblasts
(A and B) CDH2 (A) and CDH11 (B) mRNA data using fibroblasts isolated from human IPF and normal lung samples obtained from GEO: GSE44723, GSE17978, and GSE1724. Data presented as mean ± SD. *p < 0.05, **p < 0.01, ***p < 0.001 by Student’s t test. (C and D) Lung sections from normal human lung donors and IPF patients costained with αSMA and CDH2 (C) or CDH11 (D). Representative images are shown. IPF samples are n = 7, and normal lung samples are n = 6. Scale bars indicate 20 μm. (E) Western blot analysis demonstrated decreased FOXF1 and CDH2 but increased CDH11 protein in human IPF compared to normal lungs.
Figure 7
Figure 7. FOXF1 Regulates Myofibroblast Invasion through Transcriptional Activation of CDH2 and Repression of CDH11
(A) Schematic drawing of the mouse Cdh2 promoter region with potential FOXF1 DNA binding sites (black boxes). See also Table S2. ChIP assays in NIH 3T3 cells showed direct binding of FOXF1 to the indicated regions in Cdh2 promoter. ChIP assay of FOXF1 binding to the −1,435/−1,428 bp mouse Pdgfb promoter region was used as a positive control. Gapdh DNA, which lacks potential FOXF1 binding motifs, was used as a negative control. FOXF1 binding is shown relative to immunoglobulin G (IgG). Data represent one of two independent experiments. (B) Schematic drawing of the pGL2-mCdh2-Luc construct containing the Cdh2 promoter region. The mouse Cdh2 promoter (−3,087/+71 bp) was cloned into the pGL2-Basic LUC vector and cotransfected with CMV-Empty vector (CMV-EV) or CMV-Foxf1. LUC assay shows FOXF1 transcriptionally activates the Cdh2 promoter. Data are representative of three independent experiments. (C) Schematic drawings of the mouse Cadherin-11 (Cdh11) promoter. ChIP assays showed direct binding of FOXF1 to the indicated regions in the Cdh11 promoter. See also Figure S7 and Table S2. (D) Schematic drawing of the pGL2-mCdh11-Luc construct containing the Cdh11 promoter region. The mouse Cdh11 promoter (−2,497/−137 bp) was cloned into the pGL2-Basic LUC vector and cotransfection with CMV-EV or CMV-Foxf1. LUC assay shows FOXF1 transcriptionally inhibits the Cdh11 promoter. (E) Re-expression of CDH2 in FOXF1-deficient human CCL-210 lung fibroblasts decreased the invasion of fibroblasts through the basement membrane matrix (upper panels). CCL-210 lung fibroblasts were transfected with control siRNA, FOXF1 siRNA, control empty vector, or CDH2 OE, or cotransfected with siFOXF1 and CDH2 OE constructs. The efficiency of transfection is shown using qRT-PCR and western blot (bottom panels). Representative images and quantification of CCL-210 invasion are shown. Data presented as mean ± SEM. (F) Depletion of CDH11 in FOXF1-deficient human lung fibroblasts decreased the invasion of fibroblasts through the basement membrane matrix (upper panels). CCL-210 fibroblasts were transfected with control siRNA, FOXF1 siRNA, or CDH11 siRNA or cotransfected with siFOXF1 and siCDH11. *p < 0.05, **p < 0.01, ***p < 0.001 by Student’s t test. See also Figure S7. (G) Schematic drawing shows loss of FOXF1 during myofibroblast differentiation is associated with the loss of CDH2 and gain of CDH11. FOXF1 directly regulates the CDH2-CDH11 cadherin switch by transcriptionally activating CDH2 and repressing CDH11. The cadherin switch is essential for myofibroblast differentiation, migration, and invasion.

Similar articles

Cited by

References

    1. Agarwal SK, Lee DM, Kiener HP, Brenner MB. Coexpression of two mesenchymal cadherins, cadherin 11 and N-cadherin, on murine fibroblast-like synoviocytes. Arthritis Rheum. 2008;58:1044–1054. - PubMed
    1. Ahluwalia N, Shea BS, Tager AM. New therapeutic targets in idiopathic pulmonary fibrosis. Aiming to rein in runaway wound-healing responses. Am J Respir Crit Care Med. 2014;190:867–878. - PMC - PubMed
    1. Alimperti S, Andreadis ST. CDH2 and CDH11 act as regulators of stem cell fate decisions. Stem Cell Res. 2015;14:270–282. - PMC - PubMed
    1. Anders S, Reyes A, Huber W. Detecting differential usage of exons from RNA-seq data. Genome Res. 2012;22:2008–2017. - PMC - PubMed
    1. Balli D, Zhang Y, Snyder J, Kalinichenko VV, Kalin TV. Endothelial cell-specific deletion of transcription factor FoxM1 increases urethane-induced lung carcinogenesis. Cancer Res. 2011;71:40–50. - PMC - PubMed

MeSH terms