. 2018 Apr 10;23(2):596-607.
doi: 10.1016/j.celrep.2018.03.045.

Genome-wide CRISPR/Cas9 Screen Identifies Host Factors Essential for Influenza Virus Replication

Affiliations

Genome-wide CRISPR/Cas9 Screen Identifies Host Factors Essential for Influenza Virus Replication

Julianna Han et al. Cell Rep. .

Abstract

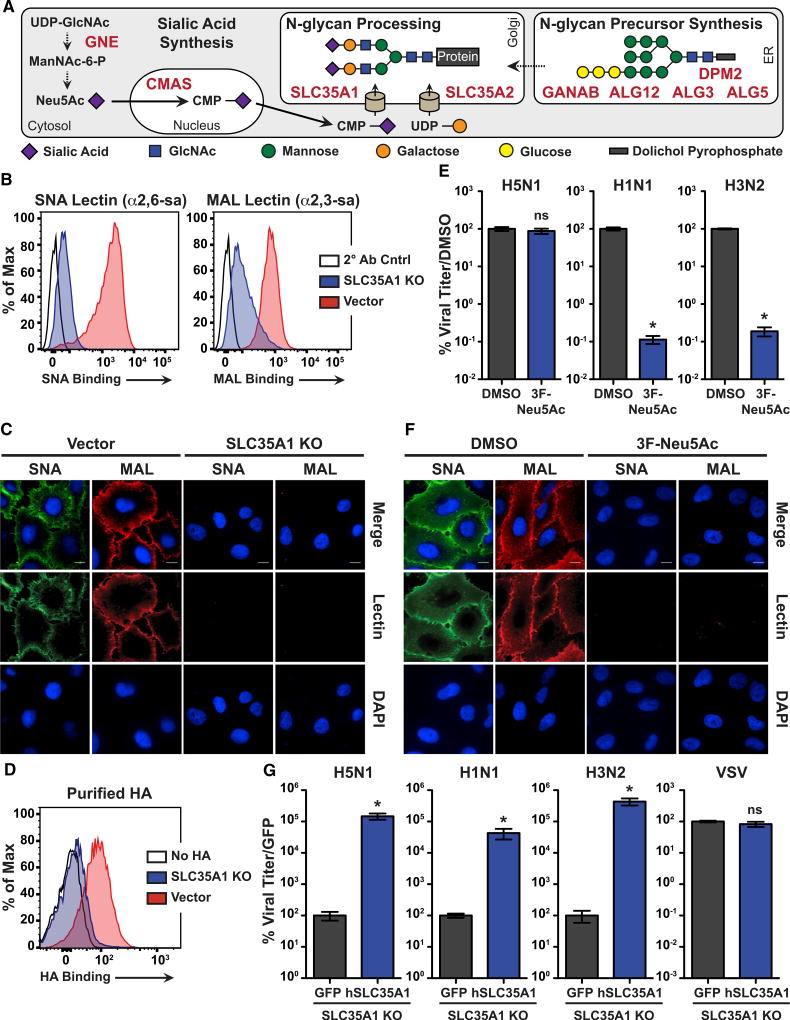
The emergence of influenza A viruses (IAVs) from zoonotic reservoirs poses a great threat to human health. As seasonal vaccines are ineffective against zoonotic strains, and newly transmitted viruses can quickly acquire drug resistance, there remains a need for host-directed therapeutics against IAVs. Here, we performed a genome-scale CRISPR/Cas9 knockout screen in human lung epithelial cells with a human isolate of an avian H5N1 strain. Several genes involved in sialic acid biosynthesis and related glycosylation pathways were highly enriched post-H5N1 selection, including SLC35A1, a sialic acid transporter essential for IAV receptor expression and thus viral entry. Importantly, we have identified capicua (CIC) as a negative regulator of cell-intrinsic immunity, as loss of CIC resulted in heightened antiviral responses and restricted replication of multiple viruses. Therefore, our study demonstrates that the CRISPR/Cas9 system can be utilized for the discovery of host factors critical for the replication of intracellular pathogens.

Keywords: CIC; CRISPR/Cas9 screen; Capicua; GeCKO; H5N1; SLC35A1; cell-intrinsic immunity; host factors; influenza virus; sialic acid pathway.


Figures

Figure 1
Figure 1. GeCKO Screen for Host Factors Essential for IAV Replication
(A) Overview of GeCKO screen in human lung epithelial (A549) cells. Steps 1–4: Cas9-expressing A549 (Cas9-A549) cells were transduced with lentivirus containing sgRNA library A and selected for 14 days in puromycin to generate the A549-GeCKO library. Steps 5–7: the A549-GeCKO library was infected with a low-pathogenic H5N1 (VN04Low) to obtain resistant cells. Steps 8a–9: preliminary consecutive screen: surviving cells were subjected to a total of five rounds of H5N1 infection with minimal expansion of resistant cells. Steps 8b–9: sequential screen: surviving cells were subjected to a total of five rounds of H5N1 infection with substantial expansion of resistant cells between each round. Step 10: validation and characterization of selected hits. (B) Boxplot of sgRNA distribution in the A549-GeCKO library and after each round (Rd) of the sequential screen. Biological replicates are shown as Rep1 and Rep2; values are represented in log2 scale; and sgRNAs are median-normalized to account for differences in total Illumina read counts. Each point represents individual sgRNAs. sgRNAs are distributed by quartile, where the boxes represent the middle quartiles (25%–75% distribution), and the lines and dots represent sgRNAs in the upper and the lower 25% of the distribution. (C) Summary of genes enriched at Rd2 and Rd5 of the sequential screen. sgRNAs enriched during H5N1 selection were identified using the MAGeCK program (p < 0.05) and mapped to corresponding genes. (D) Comparison of hits identified at Rd5 of the sequential screen, excluding miRNAs, with nine genome-wide screens performed for IAV. See also Table S2. (E) Gene ontology analysis of Rd2 and Rd5 hits from the sequential screen, excluding miRNAs. See also Figure S1.
Figure 2
Figure 2. Validation of Selected Hits with Multiple IAV Strains
(A) Venn diagram representation of overlapping hits identified in the preliminary consecutive screen (Prelim Rd5) and Rd2 and Rd5 of the sequential screen. See also Table S4. (B) Validation of individual hits. Vector control and polyclonal KOs were infected with H5N1 (MOI = 0.001), and viral titers were measured at 48 hpi. (C) Comparison of viral replication. Vector control and clonal KOs were infected with H5N1 (MOI = 0.001), H1N1 (MOI = 0.01), H3N2 (MOI = 0.01), and VSV (MOI = 0.001), and viral titers were measured at 48 hpi. Data are represented as a percentage mean titer of triplicate samples relative to vector control cells ± SD. * p < 0.05; ns, non-significant. Data are representative of at least three independent experiments. See also Figure S2.
Figure 3
Figure 3. Identification of Viral Life-Cycle Defects for Selected Hits
(A) Comparison of viral replication at a high MOI. Vector control and clonal KOs were infected with H5N1 (MOI = 1), and viral titers were measured at 24 hpi. Data are represented as a percentage mean titer of triplicate samples relative to vector control cells ± SD. * p < 0.05; ns, non-significant. (B) BlaM VLP entry assay. Vector control and clonal KOs were infected with flu VLPs (HA/NA) or VSV-G VLPs containing a β-lactamase-M1 fusion protein and analyzed by flow cytometry. Values are represented as a percentage of vector control cells ± SD. (C) qRT-PCR analysis of primary viral transcription and viral genome replication. Vector control and clonal KOs were infected with H1N1 (MOI = 3) and NP mRNA, and vRNA levels were analyzed at 3 hpi (cycloheximide pretreatment; primary viral transcription) or at 6 hpi (untreated; viral genome replication). Data are represented as a percentage of expression relative to H1N1-infected vector control cells ± SD. (D and E) qRT-PCR analysis of antiviral gene expression in basal (mock) or in H1N1-infected conditions. Vector control and clonal KOs were infected with H1N1 (MOI = 5), and mRNA levels for the indicated genes were measured at 16 hpi. Data are represented as the fold expression relative to uninfected (mock) vector control cells ± SD (D) or H1N1-infected vector control cells ± SD (E). Data are representative of at least three independent experiments. See also Figure S3.
Figure 4
Figure 4. Sialic Acid Transporter SLC35A1 Is Required for IAV Entry
(A) Simplified schematic of de novo sialic acid biosynthesis and N-glycan processing pathway. Significant genes identified in the GeCKO screen are shown in red. N-acetylglucosamine (GlcNAc), N-acetylmannosamine (ManNAc), and N-acetylneuraminic acid (Neu5Ac), cytidine monophosphate (CMP), and uridine diphosphate (UDP). (B and C) Analysis of sialic acid expression by lectin staining. Vector control and SLC35A1 KOs were treated with lectins that have specificity for 2’-6’ (SNA) or 2’-3’ (MAL) sialic acids and analyzed by flow cytometry (B) and fluorescent microscopy (C). Histograms depict the intensity of lectin binding relative to cell count. Scale bar, 10 µm. (D) Quantification of HA binding. Vector control and SLC35A1 KOs were incubated with purified HA (H5) and analyzed by flow cytometry. (E) Treatment with sialic acid analog decreases IAV replication. WT A549s were treated with DMSO or 200 µM 3Fax-Peracetyl Neu5Ac (3F-Neu5Ac) for 10 days and infected with the indicated viruses (MOI = 0.1), and viral titers were measured at 18 hpi. (F) Fluorescent microscopy of lectin binding in 3F-Neu5Ac-treated WT A549 cells. SNA and MAL staining was performed as described for (C). Scale bar, 10 µm. (G) Complementation with SLC35A1 cDNA restores IAV replication. SLC35A1 KOs complemented with GFP- or hSLC35A1-expressing vector were infected with H5N1 (MOI = 0.001), H1N1 (MOI = 0.01), H3N2 (MOI = 0.01), and VSV (MOI = 0.001), and viral titers were measured at 48 hpi. Data are represented as mean percentage titer of triplicate samples relative to DMSO-treated WT A549 cells ± SD (E) or GFP-expressing SLC35A1 KOs ± SD (G). * p < 0.05; ns, non-significant. Data are representative of at least three independent experiments. See also Figure S4.
Figure 5
Figure 5. CIC Is a Negative Regulator of Antiviral Gene Expression
(A) Comparison of viral replication. Vector control or CIC KO2s were infected with H5N1 (MOI = 0.001), H1N1 (MOI = 0.01), H3N2 (MOI = 0.01), VSV (MOI = 0.001), Zika virus (MOI = 0.01), and EMCV (MOI = 0.05) and viral titers were measured at 48 hpi (EMCV at 24 hpi). Data are represented as a percentage mean titer of triplicate samples relative to vector control cells ± SD. (B and C) qRT-PCR analysis of antiviral gene expression in basal (mock) or in H1N1-infected conditions. Vector control and CIC KO2s were infected with H1N1 (MOI = 5), and mRNA levels for the indicated genes were measured at 16 hpi. Data are represented as the fold expression relative to uninfected (mock) vector control cells ± SD (B) or H1N1-infected vector control cells ± SD (C). (D) Western blot analysis of antiviral gene expression in basal (mock) or in H1N1-infected conditions. Vector control and CIC KO2s were infected with H1N1 (MOI = 5), and cell lysates were analyzed at 16 hpi. (E) IFIT1 and MxA reporter activity upon ectopic expression of CIC and ATXN1. Firefly luciferase reporters under the control of IFIT1 or MxA promoters were transfected in the presence or in the absence of RIG-I-2CARD, CIC, and ATXN1, and luciferase activity was measured at 48 hr post-transfection. Data are represented as percent luciferase activity relative to GFP + RIG-I-2CARD-transfected control ± SD. (F) Western blot analysis of CIC degradation upon H1N1 infection. Vector control and CIC KO2s were infected with H1N1 (MOI=3), and cell lysates were analyzed at the indicated times. (G) qRT-PCR analysis of CIC downregulation upon H1N1 infection. WT A549s were infected with H1N1 (MOI = 5), and CIC mRNA levels were measured at 16 hpi. Data are represented as the fold expression relative to uninfected (mock) WT A549s ± SD. For (D) and (F), Ku levels are shown as loading controls. * p < 0.05; ns, non-significant. Data are representative of at least three independent experiments. See also Figure S5.

References

    1. Ajuria L, Nieva C, Winkler C, Kuo D, Samper N, Andreu MJ, Helman A, González-Crespo S, Paroush Z, Courey AJ, Jiménez G. Capicua DNA-binding sites are general response elements for RTK signaling in Drosophila. Development. 2011;138:915–924. - PMC - PubMed
    1. Baggen J, Thibaut HJ, Staring J, Jae LT, Liu Y, Guo H, Slager JJ, de Bruin JW, van Vliet AL, Blomen VA, et al. Enterovirus D68 receptor requirements unveiled by haploid genetics. Proc. Natl. Acad. Sci. USA. 2016;113:1399–1404. - PMC - PubMed
    1. Benitez AA, Panis M, Xue J, Varble A, Shim JV, Frick AL, López CB, Sachs D, tenOever BR. In vivo RNAi screening identifies MDA5 as a significant contributor to the cellular defense against influenza A virus. Cell Rep. 2015;11:1714–1726. - PMC - PubMed
    1. Bettegowda C, Agrawal N, Jiao Y, Sausen M, Wood LD, Hruban RH, Rodriguez FJ, Cahill DP, McLendon R, Riggins G, et al. Mutations in CIC and FUBP1 contribute to human oligodendroglioma. Science. 2011;333:1453–1455. - PMC - PubMed
    1. Brass AL, Huang IC, Benita Y, John SP, Krishnan MN, Feeley EM, Ryan BJ, Weyer JL, van der Weyden L, Fikrig E, et al. The IFITM proteins mediate cellular resistance to influenza A H1N1 virus, West Nile virus, and dengue virus. Cell. 2009;139:1243–1254. - PMC - PubMed

Substances