. 2018 Apr 10;23(2):637-651.
doi: 10.1016/j.celrep.2018.03.107.

A Distinct DNA Methylation Shift in a Subset of Glioma CpG Island Methylator Phenotypes during Tumor Recurrence

Affiliations

A Distinct DNA Methylation Shift in a Subset of Glioma CpG Island Methylator Phenotypes during Tumor Recurrence

Camila Ferreira de Souza et al. Cell Rep. .

Abstract

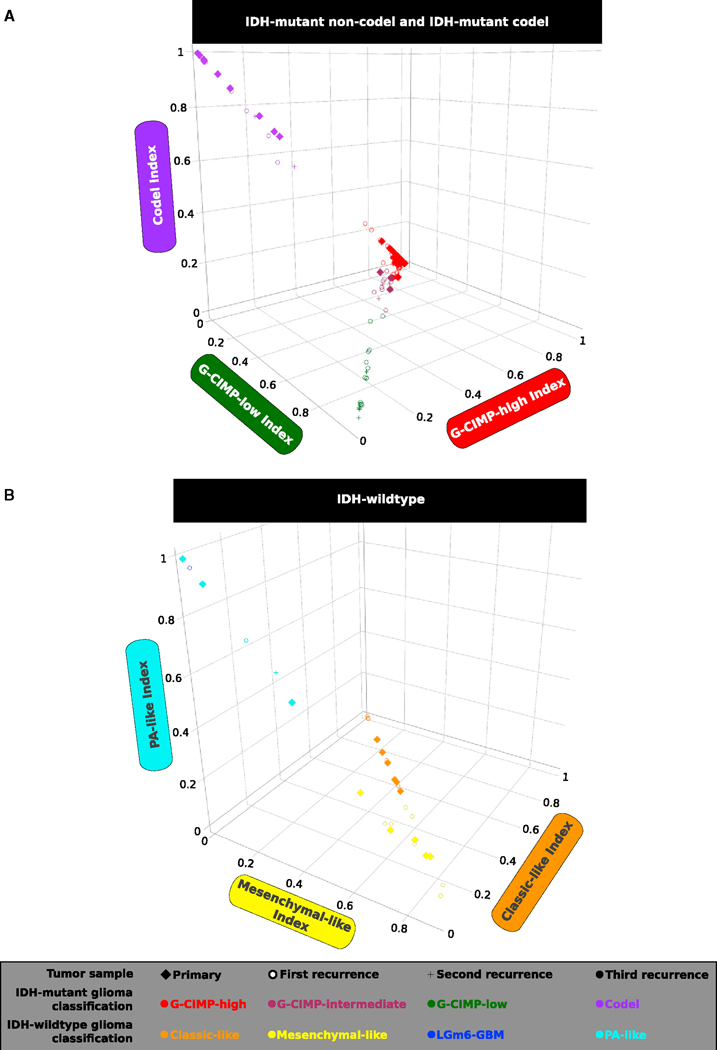
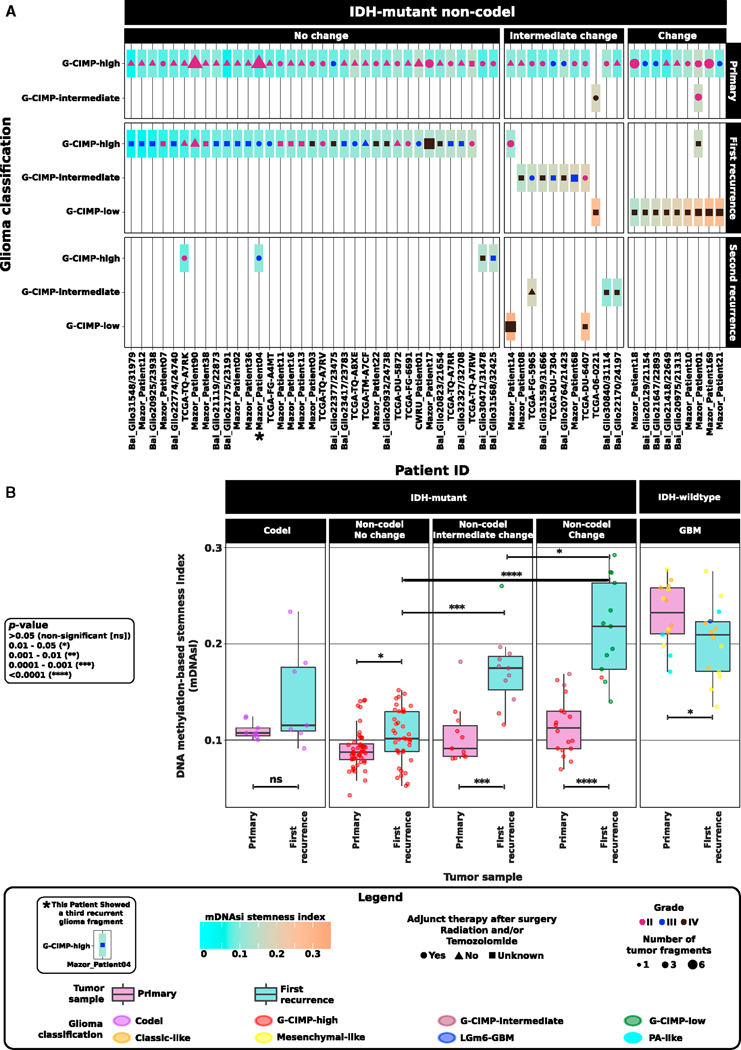
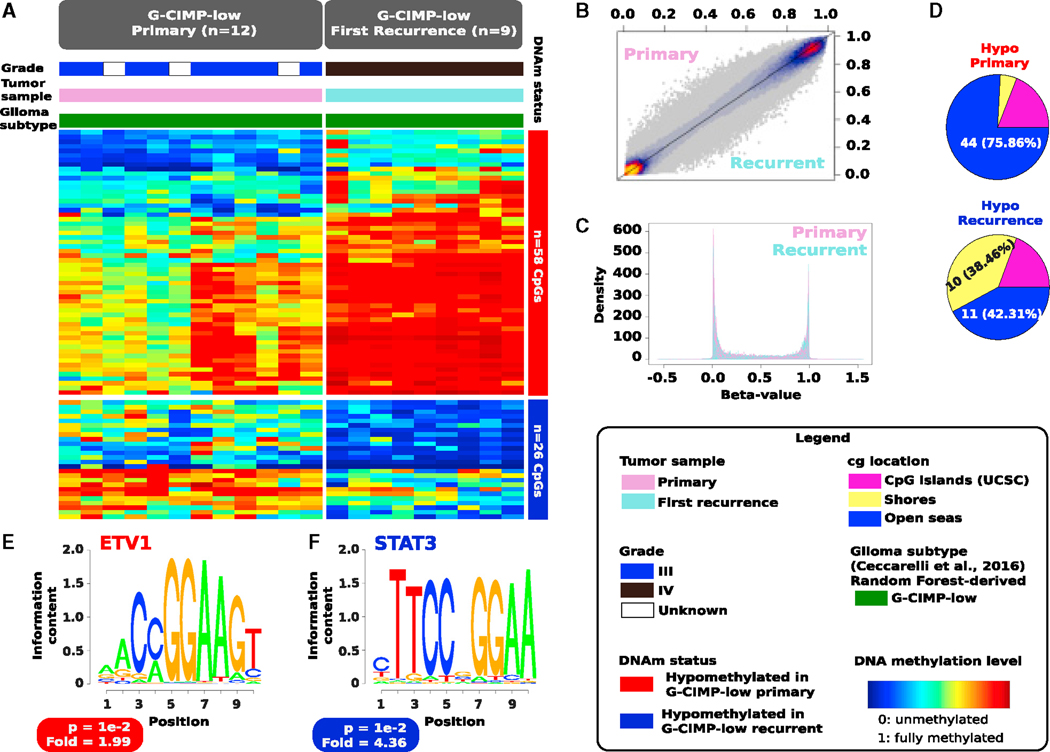
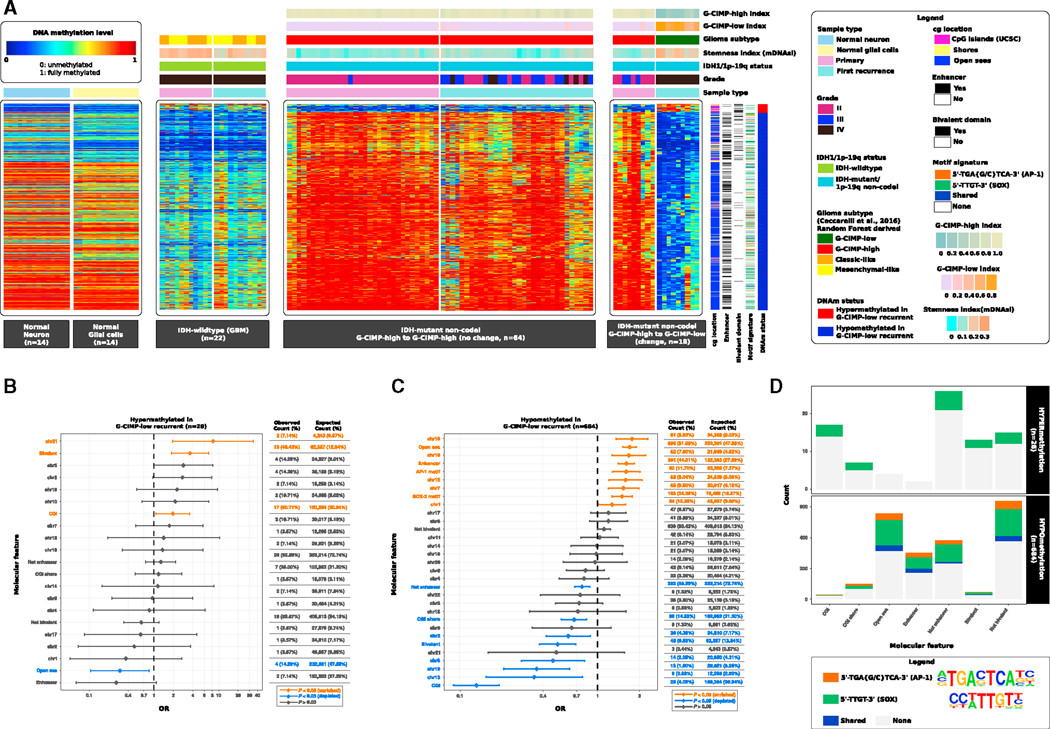
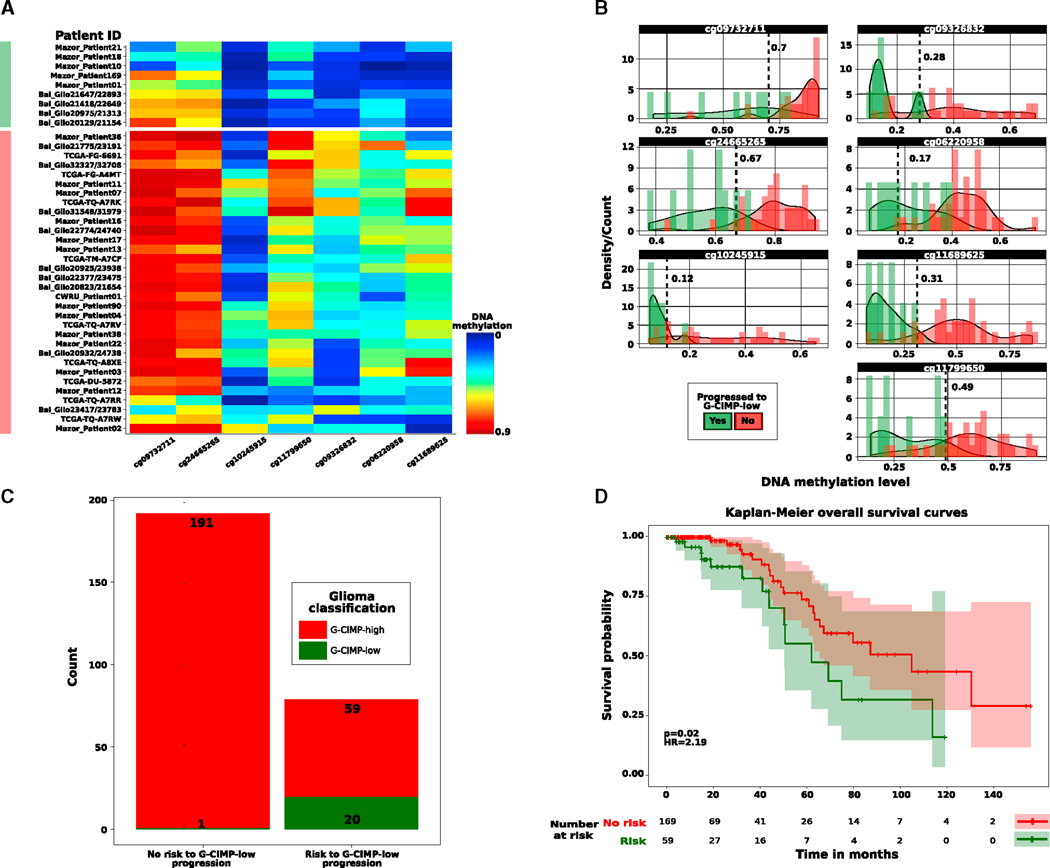
Glioma diagnosis is based on histomorphology and grading; however, such classification does not have predictive clinical outcome after glioblastomas have developed. To date, no bona fide biomarkers that significantly translate into a survival benefit to glioblastoma patients have been identified. We previously reported that the IDH mutant G-CIMP-high subtype would be a predecessor to the G-CIMP-low subtype. Here, we performed a comprehensive DNA methylation longitudinal analysis of diffuse gliomas from 77 patients (200 tumors) to enlighten the epigenome-based malignant transformation of initially lower-grade gliomas. Intra-subtype heterogeneity among G-CIMP-high primary tumors allowed us to identify predictive biomarkers for assessing the risk of malignant recurrence at early stages of disease. G-CIMP-low recurrence appeared in 9.5% of all gliomas, and these resembled IDH-wild-type primary glioblastoma. G-CIMP-low recurrence can be characterized by distinct epigenetic changes at candidate functional tissue enhancers with AP-1/SOX binding elements, mesenchymal stem cell-like epigenomic phenotype, and genomic instability. Molecular abnormalities of longitudinal G-CIMP offer possibilities to defy glioblastoma progression.

Keywords: DNA methylation; G-CIMP-high; G-CIMP-low; IDH mutation; intra-subtype heterogeneity; longitudinal gliomas; malignant transformation and recurrence; predictive biomarkers; stem cell-like glioblastoma.


Conflict of interest statement

DECLARATION OF INTERESTS

Peter W. Laird is a member of the Scientific Advisory Board of AnchorDx. All other authors declare no competing interests.

Figures

Figure 1.
Figure 1.. Identification of Longitudinal Tumors with a G-CIMP-High to G-CIMP-Low Epigenetics Shift during Recurrence and Malignant Tumor Progression
The methylomes of 200 longitudinally collected TCGA and non-TCGA adult diffuse gliomas (grades II to IV) from 77 patients profiled on the 450,000 platform were classified by supervised random forest (RF) computational approaches into one of the 7 pan-glioma DNA methylation subtypes (accuracy > 95% on average) using the CpG probe signatures described in Ceccarelli et al. (2016). (A) This 3D scatterplot using IDH mutant Codel (negative control of G-CIMP signatures) and IDH mutant non-Codel G-CIMP-high and G-CIMP-low indices predicted by the RF model shows a distinct set of samples within the IDH mutant non-Codel G-CIMP subtypes exhibiting relatively intermediate DNA methylation profiles. This subgroup of samples has been named G-CIMP-intermediate post-RF assessment. A subset of initially LGG G-CIMP-high tumors switches to a G-CIMP-low phenotype at first recurrence, whereas a subset of tumors retains their original G-CIMP-high phenotype at first recurrence as a form of epigenetic memory. (B) 3D scatterplot using IDH-wild-type PA-like, classic-like, and mesenchymal-like indices predicted by RF shows that IDH-wild-type gliomas do not change significantly in terms of their DNA methylation patterns during disease relapse.
Figure 2.
Figure 2.. Acquisition of an IDH-Wild-Type and Stem Cell-like GBM Phenotype by G-CIMP-Low at Recurrence
An overview of the longitudinal glioma cohort (n = 77 patients) across all tissue source sites is shown and highlights the stratification of glioma patients according to the temporal epigenomic profile dynamics of their tumors from initial (primary) diagnosis to first recurrent disease. (A) A subset within the IDH mutant non-Codel G-CIMP-high subtype that retains their original epigenomics phenotype at first recurrent disease (o change), a subset within the IDH mutant non-Codel macro group manifesting the G-CIMP-intermediate DNA methylation profile at primary and/or recurrent diseases plus a subset within the IDH mutant non-Codel macro group exhibiting the G-CIMP-low phenotype at second recurrence (these patients are collectively defined as those showing intermediate changes in their epigenomic profiles), and a subset within the IDH mutant non-Codel macro group (n = 9 patients) showing a dramatic epigenomic shift toward malignant transformation from G-CIMP-high at primary to G-CIMP-low at first recurrence (change). Adult diffuse longitudinal gliomas are categorized according to their stem cell-like prevalence/degree of undifferentiation (stemness) by using the DNA methylation-based stemness index (mDNAsi) as relative metric (a score value from 0 to 1). Each box represents a patient tumor colored according to its mDNAsi at primary and recurrent stages of the disease. When multiple tumor fragments are available per surgical resection, mDNAsi represents an average value of geographically distinct tumor pieces derived from the same patient surgery. Symbol color, size, and shape within each box represent tumor grade, the number of tumor fragments, and adjunct therapy (radiation and/or TMZ) received after surgery of primary and recurrent tumors. (B) G-CIMP-low first recurrent tumors possess a higher overall stemness index in relation to their G-CIMP-high primary counterparts and G-CIMP-high first recurrent tumors. The landscape of the stemness index in G-CIMP-low first recurrent tumors highly resembles those found in IDH-wild-type primary GBMs. See also Figure S1.
Figure 3.
Figure 3.. Evolution of G-CIMP-Low Methylomes Resembles a Signature toward Mesenchymal Transformation
(A) Heatmap of DNA methylation data. Columns represent de novo (primary) G-CIMP-low tumors (n = 12) and acquired (first recurrent) G-CIMP-low tumors (n = 9) sorted by hierarchical clustering. Rows represent CpG probes identified as differentially methylated after supervised analysis between de novo and acquired G-CIMP-low tumors. Fifty-eight hypomethylated CpGs define the G-CIMP-low primary methylomes, whereas 26 hypomethylated CpGs define the G-CIMP-low recurrent methylomes (FDR < 0.05, absolute difference in mean methylation beta value > 0.2). The labels at the top of the heatmap represent clinical and molecular features of interest. The saturation of either color scale reflects the magnitude of the difference in DNA methylation level. (B and C) This 2D scatterplot (B) and density plots (C) of 450,000 probes show that G-CIMP-low methylomes share epigenome-wide features at primary and first recurrent diseases. (D) Genomic distribution of hypomethylated CpGs (n = 84) that distinguish the G-CIMP-low primary and first recurrent methylomes. (E and F) De novo (primary) (E) and acquired (first recurrent) (F) G-CIMP-low methylomes are defined by DNA signature motifs for ETV1 and STAT3, respectively, known to play a role as master regulators of mesenchymal lineage differentiation.
Figure 4.
Figure 4.. G-CIMP-High to G-CIMP-Low Malignant Transformation Is Defined by Epigenomic Changes at Genomic Biofeatures Associated with Glioma Progression and Normal Development
(A) Heatmaps of DNA methylation data. Columns represent non-tumor brain cells (normal neuron cells and normal glial cells, n = 28), IDH-wild-type GBMs (n = 22), and IDH mutant non-Codel gliomas (n = 82) grouped according to their epigenomic profiles at primary and first recurrent surgery time points. Normal and tumor samples are sorted by hierarchical clustering. Rows represent CpG probes identified after supervised analysis between DNA methylation of G-CIMP-high tumors at primary diagnosis and their G-CIMP-low counterparts at first recurrence sorted by hierarchical clustering (n = 28 hypermethylated probes and n = 684 hypomethylated probes in G-CIMP-low first recurrent tumors; FDR < 0.05, difference in mean methylation beta value < —0.4 and > 0.5). Labels at the top and tracks on the right of the heatmaps represent clinical and molecular features of interest. The saturation of either color (scale from blue to red) reflects the magnitude of the difference in DNA methylation level. (B and C) OR for the frequencies of differentially hypermethylated probes (B) and differentially hypomethylated probes (C), respectively, that overlap a particular molecular feature relative to the expected genome-wide distribution of 450,000 probes. (D) De novo and known motif scan analyses identified recurring patterns in DNA that are presumed to have sequence binding-specific sites for the c-JUN/AP-1 (5ʹ-TGA{G/C}TCA-3ʹ) and SOX family of transcription factors (5ʹ-TTGT-3ʹ). The molecular features overlapping both motif signatures are shown. See also Figures S2 and S3.
Figure 5.
Figure 5.. Clinical Application of Malignant Progression to G-CIMP-Low
(A) Heatmap of DNA methylation data. Rows represent initially LGG G-CIMP-high tumors that progress to grade IV G-CIMP-low at first recurrence (labeled in green) and initially LGG G-CIMP-high tumors that retain their original G-CIMP-high phenotype at first recurrence with normal-like or indolent diseases (labeled in red). Glioma samples are sorted by hierarchical clustering. Columns represent the candidate predictive clinical biomarkers identified after supervised analysis of DNA methylation between the two tumor groups mentioned above sorted by hierarchical clustering (n = 7; unadjusted p < 0.05, absolute difference in mean methylation beta value > 0.2). The saturation of either color (scale from blue to red) reflects the magnitude of the difference in DNA methylation level. (B) Beta value thresholds that more specifically distinguish the primary glioma cases that progress to the aggressive G-CIMP-low phenotype from those primary glioma cases that relapse without malignant transformation and progression to the G-CIMP-low phenotype are represented and used to dichotomize the DNA methylation data in an independent validation cohort (n = 271). (C and D) Predictive clinical biomarkers of G-CIMP-low progression correlate with epigenomic subtype (C) and patient outcomes (D).

Similar articles

Cited by

References

    1. Bai H, Harmancı AS, Erson-Omay EZ, Li J, Coşkun S, Simon M, Krischek B, Ö zduman K, Omay SB, Sorensen EA, et al. (2016). Integrated genomic characterization of IDH1-mutant glioma malignant progression. Nat. Genet 48, 59–66. - PMC - PubMed
    1. Baysan M, Woolard K, Cam MC, Zhang W, Song H, Kotliarova S, Balamatsias D, Linkous A, Ahn S, Walling J, et al. (2017). Detailed longitudinal sampling of glioma stem cells in situ reveals Chr7 gain and Chr10 loss as repeated events in primary tumor formation and recurrence. Int. J. Cancer 141, 2002–2013. - PubMed
    1. Benjamini Y, and Hochberg Y. (1995). Controlling the False Discovery Rate - a Practical and Powerful Approach to Multiple Testing. J. Roy. Stat. Soc. B. Met 57, 289–300.
    1. Bhat KPL, Balasubramaniyan V, Vaillant B, Ezhilarasan R, Hummelink K, Hollingsworth F, Wani K, Heathcock L, James JD, Goodman LD, et al. (2013). Mesenchymal differentiation mediated by NF-kB promotes radiation resistance in glioblastoma. Cancer Cell 24, 331–346. - PMC - PubMed
    1. Brat DJ, Verhaak RG, Aldape KD, Yung WK, Salama SR, Cooper LA, Rheinbay E, Miller CR, Vitucci M, Morozova O, et al.; Cancer Genome Atlas Research Network (2015). Comprehensive, Integrative Genomic Analysis of Diffuse Lower-Grade Gliomas. N. Engl. J. Med 372, 2481–2498. - PMC - PubMed

MeSH terms