Alteration of Hepatic Gene Expression along with the Inherited Phenotype of Acquired Fatty Liver in Chicken
- PMID: 29642504
- PMCID: PMC5924541
- DOI: 10.3390/genes9040199
Alteration of Hepatic Gene Expression along with the Inherited Phenotype of Acquired Fatty Liver in Chicken
Abstract
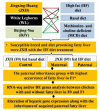
Fatty liver is a widespread disease in chickens that causes a decrease in egg production and even death. The characteristics of the inherited phenotype of acquired fatty liver and the molecular mechanisms underlying it, however, are largely unknown. In the current study, fatty liver was induced in 3 breeds by a high-fat (HF) diet and a methionine choline-deficient (MCD) diet. The results showed that the dwarf Jingxing-Huang (JXH) chicken was more susceptible to fatty liver compared with the layer White Leghorns (WL) and local Beijing-You (BJY) breeds. In addition, it was found that the paternal fatty livers induced by HF diet in JXH chickens were inherited. Compared to birds without fatty liver in the control group, both offsprings and their sires with fatty livers in the paternal group exhibited altered hepatic gene expression profiles, including upregulation of several key genes involved in fatty acid metabolism, lipid metabolism and glucose metabolism (ACACA, FASN, SCD, ACSL5, FADS2, FABP1, APOA4 and ME1). This study uniquely revealed that acquired fatty liver in cocks can be inherited. The hepatic gene expression profiles were altered in chickens with the inherited phenotype of acquired paternal fatty liver and several genes could be candidate biomarkers.
Keywords: chicken; fatty liver; gene expression; inherited phenotype; susceptible breed.
Conflict of interest statement
The authors declare that they have no competing interests.
Figures


Similar articles
-
miR-375 upregulates lipid metabolism and inhibits cell proliferation involved in chicken fatty liver formation and inheritance via targeting recombination signal binding protein for immunoglobulin kappa J region (RBPJ).Poult Sci. 2023 Jan;102(1):102218. doi: 10.1016/j.psj.2022.102218. Epub 2022 Oct 14. Poult Sci. 2023. PMID: 36410068 Free PMC article.
-
Effects of Nonalcoholic Fatty Liver Disease on Hepatic CYP2B1 and in Vivo Bupropion Disposition in Rats Fed a High-Fat or Methionine/Choline-Deficient Diet.J Agric Food Chem. 2016 Jul 13;64(27):5598-606. doi: 10.1021/acs.jafc.6b01663. Epub 2016 Jun 29. J Agric Food Chem. 2016. PMID: 27321734
-
Hepatitis B Virus X Protein Induces Hepatic Steatosis by Enhancing the Expression of Liver Fatty Acid Binding Protein.J Virol. 2015 Dec 4;90(4):1729-40. doi: 10.1128/JVI.02604-15. Print 2016 Feb 15. J Virol. 2015. PMID: 26637457 Free PMC article.
-
Treatment with baicalein attenuates methionine-choline deficient diet-induced non-alcoholic steatohepatitis in rats.Eur J Pharmacol. 2014 Sep 5;738:310-8. doi: 10.1016/j.ejphar.2014.06.006. Epub 2014 Jun 14. Eur J Pharmacol. 2014. PMID: 24937020
-
Branched-chain amino acids alleviate hepatic steatosis and liver injury in choline-deficient high-fat diet induced NASH mice.Metabolism. 2017 Apr;69:177-187. doi: 10.1016/j.metabol.2016.12.013. Epub 2017 Jan 4. Metabolism. 2017. PMID: 28285648
Cited by
-
GR-mediated transcriptional regulation of m6A metabolic genes contributes to diet-induced fatty liver in hens.J Anim Sci Biotechnol. 2021 Dec 7;12(1):117. doi: 10.1186/s40104-021-00642-7. J Anim Sci Biotechnol. 2021. PMID: 34872591 Free PMC article.
-
Integrated analysis of the methylome and transcriptome of chickens with fatty liver hemorrhagic syndrome.BMC Genomics. 2021 Jan 6;22(1):8. doi: 10.1186/s12864-020-07305-3. BMC Genomics. 2021. PMID: 33407101 Free PMC article.
-
Transcriptomic analysis of the liver, jejunum, and uterus in different production stages of laying hens.Poult Sci. 2025 Aug;104(8):105329. doi: 10.1016/j.psj.2025.105329. Epub 2025 May 22. Poult Sci. 2025. PMID: 40449105 Free PMC article.
-
A novel chicken model of fatty liver disease induced by high cholesterol and low choline diets.Poult Sci. 2021 Mar;100(3):100869. doi: 10.1016/j.psj.2020.11.046. Epub 2020 Nov 30. Poult Sci. 2021. PMID: 33516481 Free PMC article.
-
Genome-Wide Detection of Key Genes and Epigenetic Markers for Chicken Fatty Liver.Int J Mol Sci. 2020 Mar 5;21(5):1800. doi: 10.3390/ijms21051800. Int J Mol Sci. 2020. PMID: 32151087 Free PMC article.
References
-
- Liu Z., Li Q.H., Liu R.R., Zhao G.P., Zhang Y.H., Zheng M.Q., Cui H.X., Li P., Cui X.Y., Liu J., et al. Expression and methylation of microsomal triglyceride transfer protein and acetyl-CoA carboxylase are associated with fatty liver syndrome in chicken. Poult. Sci. 2016;95:1387–1395. doi: 10.3382/ps/pew040. - DOI - PubMed
LinkOut - more resources
Full Text Sources
Other Literature Sources
Molecular Biology Databases
Research Materials
Miscellaneous

