. 2018 Apr 10;19(4):1135.
doi: 10.3390/ijms19041135.

Neuroprotective Effects of Four Phenylethanoid Glycosides on H₂O₂-Induced Apoptosis on PC12 Cells via the Nrf2/ARE Pathway

Affiliations

Neuroprotective Effects of Four Phenylethanoid Glycosides on H₂O₂-Induced Apoptosis on PC12 Cells via the Nrf2/ARE Pathway

Maiquan Li et al. Int J Mol Sci. .

Abstract

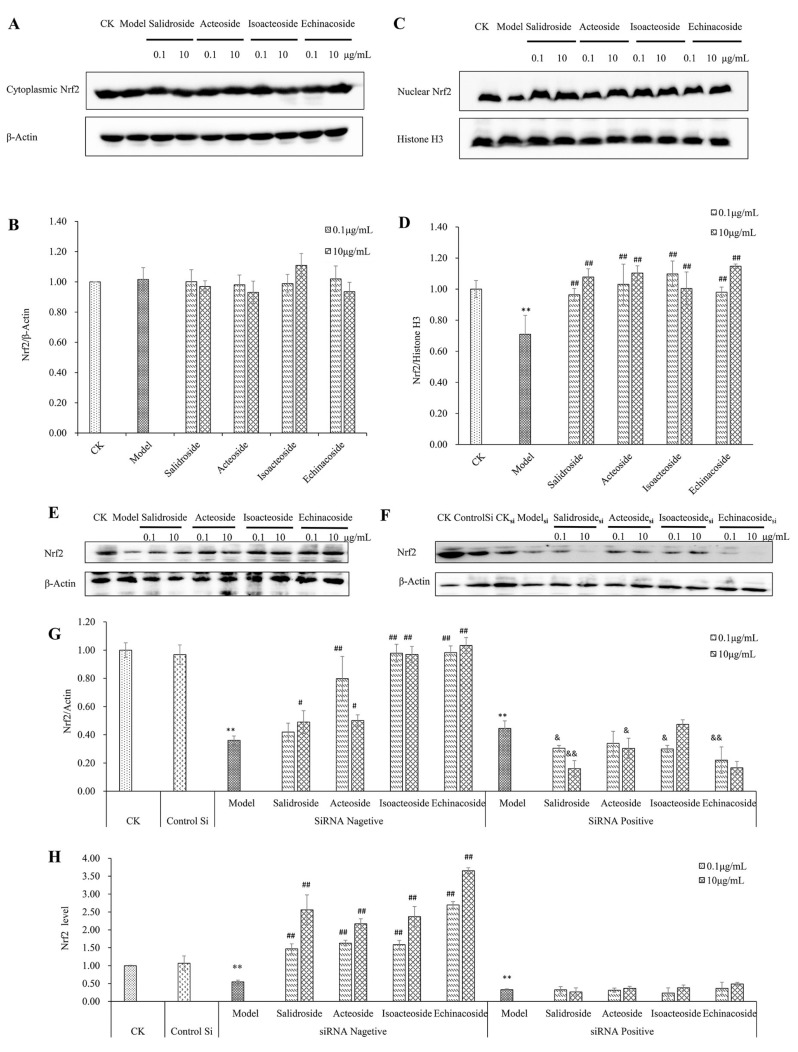
Nuclear factor erythroid 2-related factor 2 (Nrf2) is a key transcription factor against oxidative stress and neurodegenerative disorders. Phenylethanoid glycosides (PhGs; salidroside, acteoside, isoacteoside, and echinacoside) exhibit antioxidant and neuroprotective bioactivities. This study was performed to investigate the neuroprotective effect and molecular mechanism of PhGs. PhGs pretreatment significantly suppressed H₂O₂-induced cytotoxicity in PC12 cells by triggering the nuclear translocation of Nrf2 and reversing the downregulated protein expression of heme oxygenase 1 (HO-1), NAD(P)H quinone oxidoreductase 1 (NQO1), glutamate cysteine ligase-catalytic subunit (GCLC), and glutamate-cysteine ligase modifier subunit (GCLM). Nrf2 siRNA or HO-1 inhibitor zinc protoporphyrin (ZnPP) reduced the neuroprotective effect. PhGs showed potential interaction with the Nrf2 binding site in Kelch-like ECH-association protein 1 (Keap1). This result may support the hypothesis that PhGs are activators of Nrf2. We demonstrated the potential binding between PhGs and the Keap1-activated Nrf2/ARE pathway, and that PhGs with more glycosides had enhanced effects.

Keywords: Keap1; Neuroprotective; Nrf2; PC12 cells; PhGs.


Conflict of interest statement

The authors declare no conflict of interest.

Figures

Figure 1
Figure 1
PhGs suppressed H2O2-induced cytotoxicity in PC12 cells. Cell viability was detected by MTT assay. Cytotoxic effect of H2O2 (A) and PhGs (B) at different concentrations on PC12 cells. (C) PhGs attenuated H2O2-induced decrease in cell viability. PC12 cells were incubated with PhGs (0.1, and 10 μg/mL) for 24 h, and then incubated with 200 μM H2O2 for another 2 h after the PhGs were removed. (D) Morphological observation. Cells after treatment were observed by a phase contrast microscope (×100), CK: normal group, H2O2: H2O2 treated group, HL: salidroside low dosage treated group, HH: salidroside high dosage treated group, ML: acteoside low dosage treated group, MH: acteoside high dosage treated group, IL: isoacteoside low dosage treated group, IH: isoacteoside high dosage treated group, SL: echinacoside low dosage treated group, SH: echinacoside high dosage treated group. ** p < 0.01 versus untreated group; # p < 0.05, versus H2O2 treated group; ## p < 0.01, versus H2O2 treated group.
Figure 2
Figure 2
PhGs blocked ROS and MDA accumulation and increased the activities of SOD in PC12 cells. PC12 cells were incubated with PhGs (0.1, and 10 μg/mL) for 24 h, and then incubated with 200 μM H2O2 for another 2 h after the PhGs were removed. (A) PhGs blocked ROS and MDA accumulation. (B) PhGs blocked MDA accumulation. (C) PhGs increased the activities of SOD. CK: normal group, Model: H2O2 treated group, Salidroside: salidroside treated group, Acteoside: acteoside treated group, Isoacteoside: isoacteoside treated group, Echinacoside: echinacoside treated group. ** p < 0.01 versus untreated group; # p < 0.05, versus H2O2 treated group, ## p < 0.01, versus H2O2 treated group.
Figure 2
Figure 2
PhGs blocked ROS and MDA accumulation and increased the activities of SOD in PC12 cells. PC12 cells were incubated with PhGs (0.1, and 10 μg/mL) for 24 h, and then incubated with 200 μM H2O2 for another 2 h after the PhGs were removed. (A) PhGs blocked ROS and MDA accumulation. (B) PhGs blocked MDA accumulation. (C) PhGs increased the activities of SOD. CK: normal group, Model: H2O2 treated group, Salidroside: salidroside treated group, Acteoside: acteoside treated group, Isoacteoside: isoacteoside treated group, Echinacoside: echinacoside treated group. ** p < 0.01 versus untreated group; # p < 0.05, versus H2O2 treated group, ## p < 0.01, versus H2O2 treated group.
Figure 3
Figure 3
PhGs reversed H2O2-induced apoptosis in PC12 cells. PC12 cells were incubated with PhGs (0.1, and 10 μg/mL) for 24 h, and then incubated with 200 μM H2O2 for another 2 h after the PhGs were removed. Then, apoptosis was measured by a flow cytometry using PI/FITC fluorescent probe. CK: normal group, Model: H2O2 treated group, Salidroside: salidroside treated group, Acteoside: acteoside treated group, Isoacteoside: isoacteoside treated group, Echinacoside: echinacoside treated group. ** p < 0.01 versus untreated group; ## p < 0.01, versus H2O2 treated group.
Figure 4
Figure 4
The immunofluorescence assay of Nrf2 in different groups. (×400) PC12 cells were incubated with PhGs (0.1 and 10 μg/mL) for 24 h, and then incubated with 200 μM H2O2 for another 2 h after the PhGs were removed. Nrf2 localization was observed under an inverted fluorescence microscope. CK: normal group, H2O2:H2O2 treated group, HL: 0.1 μg/mL salidroside treated group, HH: 10 μg/mL salidroside treated group, ML: 0.1 μg/mL acteoside treated group, MH 10 μg/mL acteoside treated group, IL: 0.1 μg/mL isoacteoside treated group, IH: 10 μg/mL isoacteoside treated group, SL: 0.1 μg/mL echinacoside treated group, SH: 10 μg/mL echinacoside treated group.
Figure 5
Figure 5
Protective effect of PhGs on Nrf2 in H2O2-treated PC12 cells. (A) The expression of Nrf2 protein in cytoplasm was detected by immunoblotting using specific antibody. β-Actin was used as loading control. (B) The quantitative densitometric analysis of Nrf2 protein in cytoplasm. (C) The expression of Nrf2 protein in the nucleus was detected by immunoblotting using specific antibody. Histones H3 was used as loading control. (D) The quantitative densitometric analysis of Nrf2 protein in the nucleus. (E,F) PC12 cells were preincubated without (E) or with (F) Nrf2 siRNA for 24 h, then incubated with or without PhGs (0.1, and 10 μg/mL) for 24 h, and incubated with H2O2 for another 2 h after the PhGs were removed. Total Nrf2 protein expression was detected by immunoblotting using specific antibody, and β-actin was used as loading control. (G) The quantitative densitometric analysis of total Nrf2 protein. (H) The quantitative analysis of Nrf2 mRNA. (I) PC12 cells were preincubated with or without siRNA for 24 h, then incubated with or without PhGs (0.1 and 10 μg/mL) for 24 h, and incubated with H2O2 for another 2 h after the PhGs were removed. After treatment, the survival cells were determined by MTT assay. CK: normal group, Model: H2O2 treated group, ControlSi: control siRNA treated group, SiRNA Negative: without SiRNA treated group, SiRNA Positive: SiRNA treated group, Salidroside: salidroside treated group, Acteoside: acteoside treated group, Isoacteoside: isoacteoside treated group, Echinacoside: echinacoside treated group. ** p < 0.01 versus untreated group; # p < 0.05, versus H2O2 treated group (without Nrf2 siRNA treated), ## p < 0.01, versus H2O2 treated group (without Nrf2 siRNA treated); & p < 0.05 versus H2O2 treated group (with Nrf2 siRNA treated), && p < 0.01, versus H2O2 treated group (with Nrf2 siRNA treated).
Figure 5
Figure 5
Protective effect of PhGs on Nrf2 in H2O2-treated PC12 cells. (A) The expression of Nrf2 protein in cytoplasm was detected by immunoblotting using specific antibody. β-Actin was used as loading control. (B) The quantitative densitometric analysis of Nrf2 protein in cytoplasm. (C) The expression of Nrf2 protein in the nucleus was detected by immunoblotting using specific antibody. Histones H3 was used as loading control. (D) The quantitative densitometric analysis of Nrf2 protein in the nucleus. (E,F) PC12 cells were preincubated without (E) or with (F) Nrf2 siRNA for 24 h, then incubated with or without PhGs (0.1, and 10 μg/mL) for 24 h, and incubated with H2O2 for another 2 h after the PhGs were removed. Total Nrf2 protein expression was detected by immunoblotting using specific antibody, and β-actin was used as loading control. (G) The quantitative densitometric analysis of total Nrf2 protein. (H) The quantitative analysis of Nrf2 mRNA. (I) PC12 cells were preincubated with or without siRNA for 24 h, then incubated with or without PhGs (0.1 and 10 μg/mL) for 24 h, and incubated with H2O2 for another 2 h after the PhGs were removed. After treatment, the survival cells were determined by MTT assay. CK: normal group, Model: H2O2 treated group, ControlSi: control siRNA treated group, SiRNA Negative: without SiRNA treated group, SiRNA Positive: SiRNA treated group, Salidroside: salidroside treated group, Acteoside: acteoside treated group, Isoacteoside: isoacteoside treated group, Echinacoside: echinacoside treated group. ** p < 0.01 versus untreated group; # p < 0.05, versus H2O2 treated group (without Nrf2 siRNA treated), ## p < 0.01, versus H2O2 treated group (without Nrf2 siRNA treated); & p < 0.05 versus H2O2 treated group (with Nrf2 siRNA treated), && p < 0.01, versus H2O2 treated group (with Nrf2 siRNA treated).
Figure 6
Figure 6
PhGs increased the expression of HO-1, NQO1, GCLC, and GCLM. (A) PC12 cells were incubated with PhGs (0.1, and 10 μg/mL) for 24 h, and then incubated with 200 μM H2O2 for another 2 h after the PhGs were removed. HO-1, NQO1, GCLC, and GCLM protein expression was detected by immunoblotting using specific antibody, and β-actin was used as loading control. (B) The quantitative densitometric analysis of HO-1 protein (C) The quantitative densitometric analysis of NQO1 protein. (D) The quantitative densitometric analysis of GCLC protein. (E) The quantitative densitometric analysis of GCLM protein. (F) PC12 cells were preincubated with or without ZnPP (20 mM) for 15 min, then incubated with or without PhGs (0.1, and 10 μg/mL) for 24 h, and incubated with H2O2 for another 2 h after the PhGs were removed. After treatment, the survival cells were determined by MTT assay. CK: normal group, Model: H2O2 treated group, ZnPP Negative: without ZnPP treated group, ZnPP Positive: ZnPP treated group, Salidroside: salidroside treated group, Acteoside: acteoside treated group, Isoacteoside: isoacteoside treated group, Echinacoside: echinacoside treated group. * p < 0.05 versus untreated group, ** p < 0.01 versus untreated group; ## p < 0.01, versus H2O2 treated group (without ZnPP treated); & p < 0.05, versus H2O2 treated group (with ZnPP treated), && p < 0.01, versus H2O2 treated group (with ZnPP treated).
Figure 7
Figure 7
Effect of PhGs on Keap1 expression and molecular docking results. (A) PC12 cells were incubated with PhGs (0.1, and 10 μg/mL) for 24 h, and then incubated with 200 μM H2O2 for another 2 h after the PhGs were removed. Keap1 protein expression was detected by Western blotting using specific antibody, and β-actin was used as loading control. (B) The quantitative densitometric analysis of Keap1 protein. (C) 3D structure of salidroside, acteoside, isoacteoside, and echinacoside (D) The binding pocket of Keap1. (E1E3) Representative amino acid residues surrounding salidroside (red) in the binding pocket of Keap1 (E1 front view, E2 side view, E3 binding sites). (F1F3) Representative amino acid residues surrounding acteoside (red) in the binding pocket of Keap1 (F1 front view, F2 side view, F3 binding sites). (G1G3) Representative amino acid residues surrounding isoacteoside (red) in the binding pocket of Keap1 (G1 front view, G2 side view, G3 binding sites). (H1H3) Representative amino acid residues surrounding echinacoside (red) in the binding pocket of Keap1 (H1 front view, H2 side view, H3 binding sites). The dotted line (yellow) indicate potential interactions between amino acid residues and PhGs.

References

    1. Sun A.Y., Chen Y.M. Oxidative stress and neurodegenerative disorders. J. Biomed. Sci. 1998;5:401–414. doi: 10.1007/BF02255928. - DOI - PubMed
    1. Maheshwari A., Misro M.M., Aggarwal A., Sharma R.K., Nandan D. Pathways involved in testicular germ cell apoptosis induced by H2O2 in vitro. FEBS J. 2009;276:870–881. doi: 10.1111/j.1742-4658.2008.06831.x. - DOI - PubMed
    1. Halliwell B. Reactive oxygen species and the central nervous system. J. Neurochem. 1992;59:1609–1623. doi: 10.1111/j.1471-4159.1992.tb10990.x. - DOI - PubMed
    1. Richardson J.S., Subbarao K.V., Ang L.C. On the possible role of iron-induced free radical peroxidation in neural degeneration in Alzheimer’s disease. Ann. N. Y. Acad. Sci. 1992;648:326–327. doi: 10.1111/j.1749-6632.1992.tb24570.x. - DOI - PubMed
    1. Zhang D.D. Mechanistic studies of the Nrf2-Keap1 signaling pathway. Drug Metab. Rev. 2006;38:769–789. doi: 10.1080/03602530600971974. - DOI - PubMed

LinkOut - more resources