. 2018 May;30(5):952-967.
doi: 10.1105/tpc.17.00833. Epub 2018 Apr 11.

An m6A-YTH Module Controls Developmental Timing and Morphogenesis in Arabidopsis

Affiliations

An m6A-YTH Module Controls Developmental Timing and Morphogenesis in Arabidopsis

Laura Arribas-Hernández et al. Plant Cell. 2018 May.

Abstract

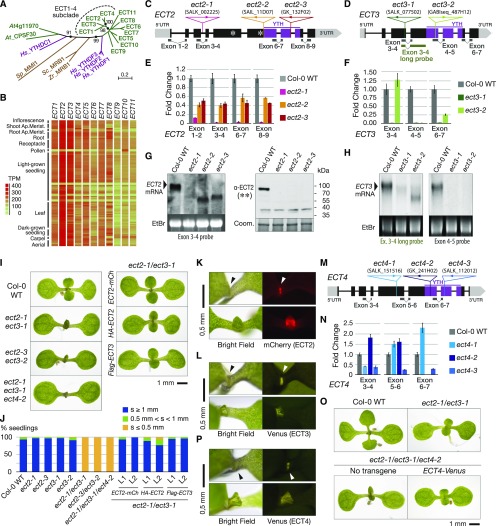
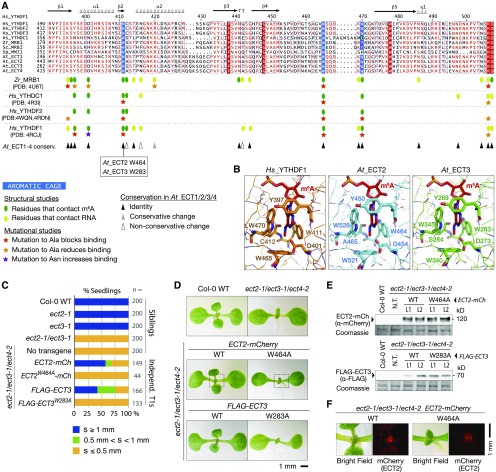
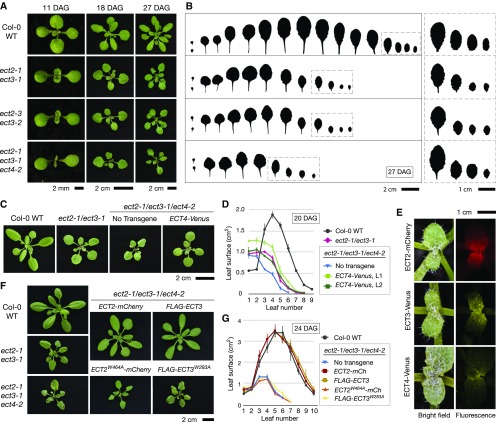
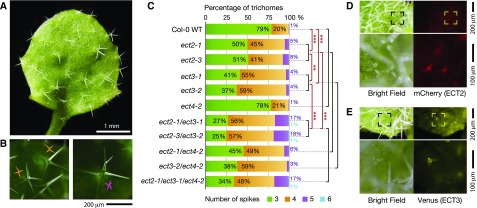
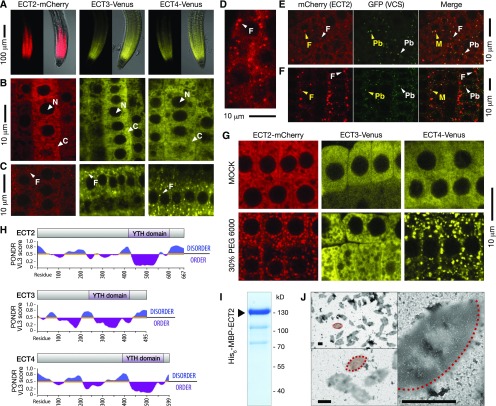
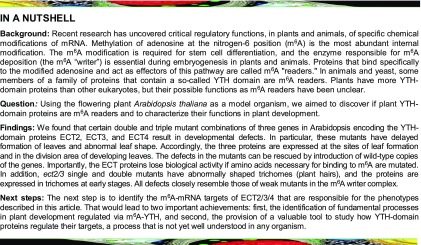
Methylation of N6-adenosine (m6A) in mRNA is an important posttranscriptional gene regulatory mechanism in eukaryotes. m6A provides a binding site for effector proteins ("readers") that influence pre-mRNA splicing, mRNA degradation, or translational efficiency. YT521-B homology (YTH) domain proteins are important m6A readers with established functions in animals. Plants contain more YTH domain proteins than other eukaryotes, but their biological importance remains unknown. Here, we show that the cytoplasmic Arabidopsis thaliana YTH domain proteins EVOLUTIONARILY CONSERVED C-TERMINAL REGION2/3 (ECT2/3) are required for the correct timing of leaf formation and for normal leaf morphology. These functions depend fully on intact m6A binding sites of ECT2 and ECT3, indicating that they function as m6A readers. Mutation of the close ECT2 homolog, ECT4, enhances the delayed leaf emergence and leaf morphology defects of ect2/ect3 mutants, and all three ECT proteins are expressed at leaf formation sites in the shoot apex of young seedlings and in the division zone of developing leaves. ECT2 and ECT3 are also highly expressed at early stages of trichome development and are required for trichome morphology, as previously reported for m6A itself. Overall, our study establishes the relevance of a cytoplasmic m6A-YTH regulatory module in the timing and execution of plant organogenesis.


Figures

Figure 1.
Figure 1.
Timing of Leaf Formation Is Controlled by ECT Proteins. (A) Phylogenetic relationship of Arabidopsis YTH domain proteins (green). The ECT1-4 subclade is highlighted. Human YTHDFs and YTHDC1 (magenta) and three yeast YTH domain proteins (brown) are included as a reference. Hs, Homo sapiens; Zr, Zygosaccharomyces rouxii; Sc, Saccharomyces cerevisiae; Sp, Schizosaccharomyces pombe. The percentage of replicate trees in which the associated taxa clustered together in the bootstrap test (1000 replicates) is shown next to the nodes (marked with black circles) that are relevant for this study. The length of the branches represents the evolutionary distance in number of amino acid substitutions per site. (B) RNA-seq expression map of ECT genes extracted from ARAPORT (Cheng et al., 2017). Shading is a log2 scale of transcripts per million (TPM). (C) and (D) Schematic representation of the ECT2 (C) and ECT3 (D) loci and their associated T-DNA insertion lines. Exons are depicted as boxes and introns as lines. Amplicons and probes used for qPCR and RNA gel blot are represented under the gene diagrams. Asterisks on ECT2 indicate the position of the peptides used to raise the antibody used in (G). (E) and (F) qPCR analysis of ECT2 (E) and ECT3 (F) expression levels in T-DNA insertion alleles, using the amplicons shown in (C) and (D), respectively. Error bars represent the se in three technical replicates. (G) RNA (left panel) and protein (right panel) blots of total RNA or protein purified from inflorescences of the indicated genotypes. Ethidium bromide (EtBr) and Coomassie blue (Coom.) staining are used as RNA and protein loading controls, respectively. The positions of the probe and the epitopes (**) are shown in (C). (H) RNA gel blots of total RNA purified from seedlings of the indicated genotypes. Ethidium bromide (EtBr) staining is used as a loading control. Probes refer to (D). (I) Eight-day-old seedlings of Col-0 wild type, ect2/ect3 double mutants with or without ECT2-mCherry, 3xHA-ECT2, or FLAG-ECT3 transgenes, and the triple mutant ect2-1/ect3-1/ect4-2. (J) Quantification of the length of the first true leaves at 8 d after germination in the indicated genotypes. Only seedlings with cotyledons of at least 2.5 mm were considered. Between 50 and 100 seedlings were analyzed in all cases, and two independent stable lines (L1 and L2) were analyzed for each transgene. s, size of first true leaves. (K) Fluorescence microscopy of ECT2-mCherry in ect2-1 ECT2-mCherry seedlings at 4 (upper panel) and 6 (lower panel) d after germination. (L) Same as in (K) for Venus fluorescence in 4-d-old (upper panel) and 5-d-old (lower panel) ect3-2 ECT3-Venus seedlings. In (K) and (L), arrowheads point to fluorescence detected at sites of leaf formation. (M) Schematic representation of the ECT4 locus and its associated T-DNA insertion lines, using the same symbols as in (C) and (D). (N) qPCR analysis of ECT4 expression levels in seedlings of ect4 T-DNA insertion alleles, using the amplicons shown in (M). Error bars represent the se in three technical replicates. (O) Ten-day-old seedlings of Col-0 wild type, ect2-1/ect3-1, and ect2-1/ect3-1/ect4-2 mutants with or without ECT4-Venus. (P) Fluorescence microscopy of ECT4-Venus in 4-d-old (upper panel) and 8-d-old (lower panel) ect2-1/ect3-1/ect4-2 ECT4-Venus seedlings. Arrowheads denote detection of fluorescence at the shoot apex and emerging leaves as in (K) and (L).
Figure 2.
Figure 2.
m6A Binding Sites Are Required for the in Vivo Function of ECT2 and ECT3. (A) Multiple sequence alignment of part of the YTH domain of the proteins described in Figure 1A. The secondary structure elements of Hs_YTHDF1 are indicated, and amino acids are colored according to level of sequence conservation: red letters, similar residues; red boxes, identical residues (ESPript; Robert and Gouet, 2014). Amino acids that form the methyl-interacting aromatic cage are highlighted in blue. Oval marks and stars summarize the main finding of previous structural and mutational studies of the YTH domain of Zr_MRB1, Hs_YTHDC1, and Hs_YTHDF1/2 as indicated (Luo and Tong, 2014; Xu et al., 2014, ; Li et al., 2014b; Zhu et al., 2014). Triangles indicate the degree of conservation of the studied residues in ECT1/2/3/4. PDB, Protein Data Bank (IDs). (B) Experimentally determined structure of the YTH domain of human YTHDF1 in complex with m6A RNA (PDB: 4RCJ), and models of the YTH domains of ECT2 and ECT3 generated using the homology-modeling server SWISS-MODEL. Residues forming contacts with m6A are highlighted. (C) Percentages of primary transgenic lines of the indicated genotypes in three categories defined by the length of the first true leaves at 8 d after germination. s, size of first true leaves. Only seedlings with cotyledons longer than 2.5 mm were considered. (D) Phenotypes of 9-d-old seedlings of the indicated genotypes. Dotted lines delimit the areas analyzed in (F). (E) Protein blot analyses of wild type and mutant ECT2-mCherry (top) and FLAG-ECT3 (bottom). Two lines (L1 and L2) of each kind with comparable expression levels are shown. Coomassie staining is used as a loading control. N.T., no transgene. (F) Expression of the wild type and mutant ECT2-mCherry at the shoot apex detected by fluorescence microscopy (mCherry).
Figure 3.
Figure 3.
Leaf Morphogenesis Requires ECT2, ECT3, and ECT4. (A) Seedlings and young rosettes of the indicated genotypes at three different time points. All plants were germinated directly on soil. DAG, days after germination. (B) Leaf profiles of the plants in (A) at 27 DAG. Note the abnormal shape and delayed development in ect2-1/ect3-1, ect2-3/ect3-2, and ect2-1/ect3-1/ect4-2. The four younger leaves of all plants are magnified on the right side (dashed squares) to show the different margins. (C) and (D) Partial restoration of ect2-1/ect3-1/ect4-2 rosette phenotypes (20 DAG) by expression of transgenic ECT4-Venus, as indicated by overall rosette phenotype (C) or measured by average leaf surface areas (D). T2 plants of two independent transgenic lines (L1 and L2) are analyzed. Dots indicate the average area of every type of leaf among three to five plants grown in parallel. Lines connect dots to facilitate reading. Error bars indicate se. (E) Fluorescence microscopy of the second pair of true leaves of plants expressing ECT2-mCherry, ECT3-Venus, or ECT4-Venus as indicated. (F) and (G) Complementation of ect2-1/ect3-1/ect4-2 rosette phenotypes (24 DAG) by expression of transgenic ECT2-mCherry or FLAG-ECT3, but not of their corresponding m6A binding site mutants. Data were obtained and represented as in (C) and (D), except that the plants are older and averages of transgenic lines are calculated from independent T1 plants.
Figure 4.
Figure 4.
Aberrant Trichome Morphology in the Absence of ECT2 and ECT3. (A) Young leaf with several trichomes showing an increased number of branches. The picture shown is of an ect2-1/ect3-1/ect4-2 triple mutant, but ect2/ect3 double mutants exhibit the same branching pattern. (B) Examples of trichomes with aberrant branching. Left, four-spiked trichomes marked with orange symbols; right, five-spiked trichome marked with a purple symbol. (C) Branching pattern sorted by number of spikes in the indicated genotypes. Branches were counted on at least 150 trichomes on each of at least 6 plants for each genotype (n = ∼1000). Seven observations of two-spiked trichomes and one observation of a seven-spiked trichome were removed from the total of >12,000 trichomes counted for simplicity. Percentages corresponding to three and four spikes are overlaid on the green and orange colored bars, while percentages of five and six spikes, if any, are indicated to the right of the bar in purple and cyan numbers, respectively. Data were fitted to a proportional odds model in R for statistical analyses as described in the Methods. Asterisks indicate Bonferroni-corrected P values: **P < 0.01 and ***P < 0.001. Black bars indicate no significant difference. (D) and (E) Fluorescence microscopy images of young trichomes in plants expressing ECT2-mCherry (D) or ECT3-Venus (E). Framed areas on upper panels are magnified below.
Figure 5.
Figure 5.
ECT2, ECT3, and ECT4 Are Cytoplasmic and May Aggregate in Granules. (A) Confocal images of mCherry or Venus fluorescence in root tips grown inside MS-agar of ect2-1 ECT2-mCherry, ect3-2 ECT3-Venus, and ect2-1/ect3-1/ect4-2 ECT4-Venus. Left panels display only fluorescence, and right panels show an overlay of fluorescence over bright field images. (B) and (C) Fluorescence of root tips of the plants described in (A) at higher magnification. N, nucleus; C, cytoplasm; F, foci. (D) Confocal image of ECT2-mCherry-expressing roots grown on the agar surface. (E) and (F) Confocal images of mCherry and GFP fluorescence in root tips grown inside MS-agar of plants coexpressing VCS-GFP and ECT2-mCherry. Unstressed roots (E) and roots stressed (F) by partial dehydration in 0.8% noble agar for 10 h. Arrowheads point to different kinds of cytoplasmic bodies: F, ECT2-mCherry Foci; Pb, P-body; M, merge. Yellow coloring indicates rare colocalization. (G) Confocal images of root tips of the plants described in (A) after treatment with 30% PEG6000 in MS, or mock treatment (MS), for 1 h. (H) Intrinsic disorder prediction of ECT2/3/4 by PONDR-VL3 (Predictor of Naturally Disordered Regions-VL3) scores (Peng et al., 2005). PONDR-VL3 values increase with the predicted increase in disorder. (I) Coomassie-stained SDS-PAGE gel of Ni2+-NTA-affinity purified His6-MBP-ECT2. (J) Negative stain transmission electron microscopy of His6-MBP-ECT2 shown in (I). Examples of eye-shaped electron dense assemblages are outlined and shaded in red (only half-outlined at the highest magnification). Bars = 1 μm.
None

References

    1. Apweiler R., et al. (2004). UniProt: the Universal Protein knowledgebase. Nucleic Acids Res. 32: D115–D119. - PMC - PubMed
    1. Arribas-Hernández L., Marchais A., Poulsen C., Haase B., Hauptmann J., Benes V., Meister G., Brodersen P. (2016). The slicer activity of ARGONAUTE1 is required specifically for the phasing, not production, of trans-acting short interfering RNAs in Arabidopsis. Plant Cell 28: 1563–1580. - PMC - PubMed
    1. Banani S.F., Rice A.M., Peeples W.B., Lin Y., Jain S., Parker R., Rosen M.K. (2016). Compositional control of phase-separated cellular bodies. Cell 166: 651–663. - PMC - PubMed
    1. Batista P.J., et al. (2014). m6A RNA modification controls cell fate transition in mammalian embryonic stem cells. Cell Stem Cell 15: 707–719. - PMC - PubMed
    1. Beckham C., Hilliker A., Cziko A.M., Noueiry A., Ramaswami M., Parker R. (2008). The DEAD-box RNA helicase Ded1p affects and accumulates in Saccharomyces cerevisiae P-bodies. Mol. Biol. Cell 19: 984–993. - PMC - PubMed

Publication types

MeSH terms

Substances