EphrinB2/EphB4 signaling regulates non-sprouting angiogenesis by VEGF
- PMID: 29643120
- PMCID: PMC5934775
- DOI: 10.15252/embr.201745054
EphrinB2/EphB4 signaling regulates non-sprouting angiogenesis by VEGF
Abstract
Vascular endothelial growth factor (VEGF) is the master regulator of angiogenesis, whose best-understood mechanism is sprouting. However, therapeutic VEGF delivery to ischemic muscle induces angiogenesis by the alternative process of intussusception, or vascular splitting, whose molecular regulation is essentially unknown. Here, we identify ephrinB2/EphB4 signaling as a key regulator of intussusceptive angiogenesis and its outcome under therapeutically relevant conditions. EphB4 signaling fine-tunes the degree of endothelial proliferation induced by specific VEGF doses during the initial stage of circumferential enlargement of vessels, thereby limiting their size and subsequently enabling successful splitting into normal capillary networks. Mechanistically, EphB4 neither inhibits VEGF-R2 activation by VEGF nor its internalization, but it modulates VEGF-R2 downstream signaling through phospho-ERK1/2. In vivo inhibitor experiments show that ERK1/2 activity is required for EphB4 regulation of VEGF-induced intussusceptive angiogenesis. Lastly, after clinically relevant VEGF gene delivery with adenoviral vectors, pharmacological stimulation of EphB4 normalizes dysfunctional vascular growth in both normoxic and ischemic muscle. These results identify EphB4 as a druggable target to modulate the outcome of VEGF gene delivery and support further investigation of its therapeutic potential.
Keywords: EphB4; EphrinB2; intussusception; vascular endothelial growth factor.
© 2018 The Authors. Published under the terms of the CC BY NC ND 4.0 license.
Figures

Retroviral construct carrying a bicistronic cassette coding for one of three signaling blockers (LAP, sEphB4, or sTie2Fc) linked to a truncated version of rabbit CD4 (tr.rbCD4), as a convenient cell surface FACS‐sortable marker, through an internal ribosomal entry site sequence (IRES). LTR = retroviral long terminal repeats.
Blocker‐expressing myoblast populations, generated from control cells (Ctrl) or a clone expressing low VEGF (V‐low), were FACS‐sorted, and their purity was determined by analysis of CD4 expression (black curves) vs. isotype control (gray curves).
Expression specificity was determined by RT–PCR on RNA isolated from each population, using primers specific for LAP (L), sEphB4 (E), and sTie2Fc (T), amplifying products of 781, 963, and 1,519 bp, respectively.
Functional activity of the LAP blocker. HEK293N cells were transfected with a TGF‐β reporter construct, expressing luciferase under a SMAD‐dependent promoter. Conditioned medium from LAP‐expressing myoblasts (LAP) inhibited luciferase activity induced by stimulation with 0.1 and 1 ng/ml of TGF‐β1 compared to control conditioned medium from CD4 myoblasts (Ctrl). R.L.U. = relative light units. Mean ± SEM; n = 3/condition; ***P < 0.001 (one‐way ANOVA with Bonferroni multiple comparisons test, after data normalization by logarithmic‐transformation).
Functional activity of the sTie2Fc blocker. Treatment of RAW264.7 macrophages with LPS causes upregulation of TNFα, which is inhibited by COMP‐Ang1. Real‐time qRT–PCR analysis of Tnfa gene expression shows that conditioned medium from sTie2Fc myoblasts (LPS + sTie2Fc) prevented this inhibition by 50 ng/ml COMP‐Ang1 compared to control conditioned medium from CD4 myoblasts (LPS + Ctrl). Mean ± SEM; n = 6/condition; **P < 0.01 (one‐way ANOVA with Bonferroni multiple comparisons test, after data normalization by logarithmic‐transformation).
Functional activity of the sEphB4 blocker. Human umbilical vein endothelial cells were treated with ephrinB2‐Fc or control Fc, and phosphorylation of the EphB4 receptor was measured by ELISA. Conditioned medium from sEphB4 myoblasts (sEphB4) inhibited EphB4 phosphorylation compared to control conditioned medium from CD4 myoblasts (Ctrl). O.D. = optical density units. Mean ± SEM; n = 3/condition; *P < 0.05 (one‐way ANOVA with Bonferroni multiple comparisons test, after data normalization by logarithmic‐transformation).
- A, B
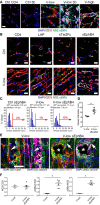
Immunofluorescence staining of endothelium (CD31, red), pericytes (NG2, green), smooth muscle cells (α‐SMA, cyan), and nuclei (DAPI, blue) on frozen sections of limb muscles injected with myoblast clones expressing different VEGF levels (V‐low and V‐high, respectively) or co‐expressing low VEGF with blockers of the TGF‐β1, angiopoietin/Tie2, and ephrinB2/EphB4 pathways together (V‐low 3b) or each individually (LAP, sTie2Fc, or sEphB4). Cells expressing only CD4 surface marker (Ctrl CD4) or blockers (Ctrl 3b) served as controls. Normal angiogenesis induced by V‐low was switched to aberrant, enlarged, and smooth muscle‐covered vessels, similar to those induced by high VEGF alone (V‐high), in the presence of all three blockers or selectively by inhibition of ephrinB2/EphB4 signaling alone. Scale bar = 25 μm.
- C, D
Quantification of vessel diameters, displayed as distribution (C) or mean ± SEM (D). A population of aberrantly enlarged vessels > 10 μm is induced by ephrinB2/EphB4 blockade. n = 3 mice/group (Ctrl sEphB4 and V‐low), n = 5 mice (V‐low sEphB4); *P < 0.05 (Mann–Whitney test).
- E
Immunofluorescence staining for mural cell markers (NG2 or α‐SMA, both green) and basal lamina (laminin, purple) shows that aberrant vessels induced by ephrinB2/EphB4 blockade are associated with smooth muscle (α‐SMA+ outside the basal lamina) rather than pericytes (NG2+ embedded inside the basal lamina). White arrows indicate an NG2+ pericyte (in V‐low left panels) and an α‐SMA+ smooth muscle cell (in the V‐low sEphB4 right panels); *lumen of aberrant structure. Scale bar = 25 μm.
- F
Quantification of mural cell coverage of vessels induced by V‐low or V‐low sEphB4, shown as the ratio of NG2+/CD31+ and α‐SMA+/CD31+ areas, or the ratio between the two markers (NG2/SMA). n = 3 mice (V‐low), n = 6 mice (V‐low sEphB4); *P < 0.05 (Mann–Whitney test).


- A–F
A high VEGF dose was delivered to limb muscles of mice either by genetically modified myoblasts (V‐high, A–C) or as fibrin‐bound recombinant protein (fibrin‐High V, D–F), and animals were treated intraperitoneally with ephrinB2‐Fc or control Fc recombinant protein. Immunostaining (A, D) of frozen sections for endothelium (CD31, red), pericytes (NG2, green), smooth muscle cells (α‐SMA, cyan), and nuclei (DAPI, blue) showed that, with both delivery platforms, ephrinB2‐Fc treatment prevented the induction of aberrant vascular structure by high VEGF and yielded only normal capillary networks. *lumens of aberrant structures in (D); scale bar = 25 μm. Quantification (B, C, E, and F) of vessel diameters showed a consistent and significant decrease in vessel sizes after treatment with ephrinB2‐Fc. Results are shown as diameter distributions (B, E) and mean ± SEM (C, F). Red arrows and numbers indicate the fraction of vessel diameters > 10 μm. n = 4 mice; *P < 0.05 (Mann–Whitney test).

- A–D
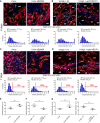
Immunostaining of frozen sections (upper panels) stained for endothelium (CD31, red), pericytes (NG2, green), smooth muscle cells (α‐SMA, cyan), and nuclei (DAPI, blue) and quantification of vessel diameter distribution (lower panels) showed that 4 days after VEGF delivery, the size of initial circumferential enlargements was increased by ephrinB2/EphB4 inhibition and reduced by its stimulation (A, B). By 7 days, after completion of remodeling, EphB4 inhibition switched normal angiogenesis by V‐low to aberrant (C) and its stimulation converted aberrant structures by V‐high into normal capillary networks (D). Red arrows and numbers indicate the fraction of vessel diameters > 10 μm. *lumen of aberrant structures; mf, muscle fibers; scale bar, 25 μm.
- E–H
Quantification of vessel diameters after 4 days (E, F) and 7 days (G, H). Values represent means of individual measurements in each sample ± SEM. n = 3–4 independent samples/group; *P < 0.05 and **P < 0.01 (one‐tailed t‐test, after data normalization by logarithmic‐transformation).
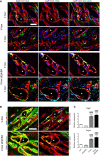
Immunofluorescence staining of endothelium (CD31, red), pericytes (NG2, green), smooth muscle cells (α‐SMA, cyan), and nuclei (DAPI, blue). In both conditions, initial vascular enlargements after 3 and 4 days were tightly associated with mural cells displaying a pericyte morphology, which, however, upregulated α‐SMA expression in the presence of EphB4 blockade. *lumen of vascular enlargements; scale bar = 25 μm.
Co‐staining for laminin (LAM, red) confirmed the pericyte identity of both α‐SMA‐positive and α‐SMA‐negative mural cells, as both were embedded inside the endothelial basal lamina. *lumen of vascular enlargements; scale bar = 25 μm.
Gene expression of Pdgfb and Pdgfrb was quantified in skeletal muscles 3 days after myoblast implantation and expressed as fold‐change vs. control muscles. Mean ± SEM; n = 4 independent samples/group; ***P < 0.001, ### P < 0.001 vs. Ctrl (*) or vs. sEphB4 (#) (one‐way ANOVA with Bonferroni multiple comparisons test, after data normalization by logarithmic‐transformation).
- A–D
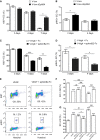
Muscles were harvested 3, 4, and 7 days after implantation of V‐low or V‐low sEphB4 clones, or V‐high cells while treating animals systemically with ephrinB2‐Fc or control Fc proteins. Endothelial proliferation was assessed by quantifying the percentage of endothelial cells positive for Ki67, which marks all cycling cells (A and C), or phosphorylated histone H3, which marks only cells in the G2/M phase (pHH3, B, and D), by immunofluorescence staining on frozen muscle sections. EphB4 inhibition specifically increased the rate of endothelial proliferation (pHH3+ cells) and its stimulation by ephrinB2‐Fc conversely decreased it. Mean ± SEM; n = 4 independent samples/group; *P < 0.05, **P < 0.01, and ***P < 0.001 (one‐way ANOVA with Bonferroni multiple comparisons test).
- E–G
Human dermal microvascular endothelial cells (HDMEC) were treated in vitro with recombinant VEGF or FGF2, while EphB4 was stimulated with ephrinB2‐Fc (50 or 2,000 ng/ml). Cell cycle analysis was performed by FACS after staining for Ki67 and pHH3 (E), and the proportion of cells withdrawn from cycle (G0) or in mitosis (M) were quantified (F, G). EphB4 stimulation dose‐dependently increased quiescence and decreased mitosis by both mitogens. Mean ± SEM; n = 3 independent samples/group; ***P < 0.001 vs. ephrinB2‐Fc control, # P < 0.05, ## P < 0.01 and ### P < 0.001 (one‐way ANOVA with Bonferroni multiple comparisons test).


- A–D
Gene expression of Fgf2 (A) and total (B) or endogenous Vegfa (C) was quantified in skeletal muscles 3 days after myoblast implantation and expressed as fold‐change vs. control muscles. The relative magnitude of gene expression changes can be better appreciated by plotting the data on the same scale (D). Mean ± SEM; n = 4–6 independent samples/group; **P < 0.01, ****P < 0.0001 vs. Ctrl (one‐way ANOVA with Bonferroni multiple comparisons test, after data normalization by logarithmic‐transformation).
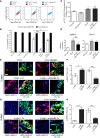
- A, B
VEGF‐R2 internalization was quantified by FACS. Mean ± SEM; n = 6 independent samples/group; **P < 0.01 and ***P < 0.001 vs. not stimulated control, # P < 0.05, ### P < 0.001 (one‐way ANOVA with Bonferroni multiple comparisons test).
- C
VEGF‐R2 phosphorylation at tyrosine Y1175 (C) was quantified by immunocytochemistry. Mean ± SEM; n = 4 independent samples/group; *P < 0.05 and **P < 0.01 vs. not stimulated control (one‐way ANOVA with Bonferroni multiple comparisons test).
- D
Expression of VEGF‐R2 target genes Igfpb3 and Esm1 was quantified by real‐time qRT–PCR. Mean ± SEM; n = 8 independent samples/group; *P < 0.05, **P < 0.01, and ***P < 0.001 vs. not stimulated control, ### P < 0.001 (one‐way ANOVA with Bonferroni multiple comparisons test, after data normalization by logarithmic‐transformation).
- E–H
Muscles were harvested 3 and 4 days after implantation of V‐low or V‐low sEphB4 clones, or V‐high cells while treating animals systemically with ephrinB2‐Fc or control Fc proteins. Frozen sections were immunostained for phosphorylated ERK1/2 (p‐ERK1/2) and the endothelial junctional protein VE‐cadherin (VE‐CAD) (E, G), and the percentage of p‐ERK1/2‐positive endothelial cells was quantified (F, H). EphB4 inhibition and stimulation, respectively, increased and decreased ERK1/2 activation downstream of VEGF‐R2. *in IF panels = lumens of vascular enlargements. Scale bar = 20 μm. Mean ± SEM; n = 4 independent samples/group; *P < 0.05 and ***P < 0.001 (one‐way ANOVA with Bonferroni multiple comparisons test).
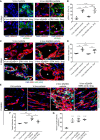
- A–D
Muscles were harvested 4 days after implantation of V‐low or V‐low sEphB4 clones, while treating animals systemically with the selective ERK1/2 inhibitor SCH772984 (3 or 6 mg/kg) or vehicle. Frozen sections were immunostained for phosphorylated ERK1/2 (p‐ERK1/2) and the endothelial junctional protein VE‐cadherin (VE‐CAD) (A), or for endothelium (CD31, red), pericytes (NG2, green), and smooth muscle cells (α‐SMA, cyan) (C), followed by quantification of the percentage of p‐ERK1/2‐positive endothelial cells (B) and of vessel diameters (D). ERK inhibition was effective with 6 mg/kg and completely prevented the vessel enlargement caused by sEphB4. *lumen of vascular enlargements. Scale bar = 20 μm. Mean ± SEM; n = 4 independent samples/group; *P < 0.05, **P < 0.01, ***P < 0.001, and ****P < 0.0001 (one‐way ANOVA with Bonferroni multiple comparisons test).
- E–G
Muscles implanted as above were harvested after 2 weeks, while treating animals systemically with 6 mg/kg of SCH772984 or vehicle for the first 7 days. Frozen sections were immunostained for endothelium (CD31, red), pericytes (NG2, green), and smooth muscle cells (α‐SMA, cyan) (E), followed by quantification of the percentage of vessel diameters (F) and vessel length density (G). ERK inhibition prevented the switch to aberrant angiogenesis caused by sEphB4, without impairing the amount of normal angiogenesis induced by V‐low. Scale bar = 20 μm. Mean ± SEM; n = 4 independent samples/group; *P < 0.05, **P < 0.01, ***P < 0.001, and ****P < 0.0001 (one‐way ANOVA with Bonferroni multiple comparisons test).
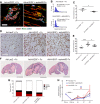
- A–C
Immune‐deficient SCID mice received intramuscular injections of adenovirus expressing murine VEGF164 (Ad‐mVEGF) and were treated systemically with ephrinB2‐Fc or control Fc proteins. Muscles were harvested 2 weeks later, and frozen sections were stained for endothelium (CD31, red), pericytes (NG2, green), and smooth muscle cells (α‐SMA, cyan) (A). Vessel diameters were quantified, and results are shown as size distribution (B) and mean of individual measurements in each sample ± SEM (C). EphB4 stimulation prevented the appearance of aberrantly enlarged and smooth muscle‐covered vascular structures and reduced the average diameter of induced vessels. Scale bar = 50 μm. n = 4 independent samples/group; *P < 0.05 (one‐tailed t‐test, after data normalization by logarithmic‐transformation).
- D–H
Hindlimb ischemia was induced in immune‐competent LDLR−/−ApoB100/100 mice. Adenoviral vectors expressing human VEGF165 (Ad‐hVEGF) or control LacZ (Ad‐LacZ) were delivered by intramuscular injection and animals received systemic treatment with ephrinB2‐Fc or control Fc proteins. After 11 days, muscles were harvested and immunohistochemical staining for CD31 was performed to assess vessel morphology (D) and to quantify vascular size by measuring vessel perimeters (E), while tissue damage was quantified on H&E‐stained sections (F, G), distinguishing tissue areas as normal, necrotic, early‐, and late‐regenerating (ER and LR, respectively). Blood flow was measured non‐invasively by contrast‐enhanced ultrasound (H) before and after surgery (pre‐op and post‐op, respectively) and after 4, 7, and 11 days (d4, d7, and d11) and is presented as the ratio of ischemic/contralateral normal leg of each animal. EphB4 stimulation prevented the appearance of aberrantly enlarged vascular lacunae and normalized the size of VEGF‐induced vessels, while a non‐significant trend was also observed toward reduced tissue necrosis, increased regeneration, and normalized blood flow. Scale bars = 100 μm (D) and 2 mm (F). Mean ± SEM; (D–G) n = 7–9 independent samples/group; *P < 0.05 and ***P < 0.001 (one‐way ANOVA and Bonferroni post hoc test); (H) n = 4–10 animals/group; ***P < 0.001 post‐op vs. pre‐op, **P < 0.01 post‐op vs. day 11 Ad‐LacZ, or vs. Ad‐VEGF, or vs. Ad‐VEGF + ephrinB2‐Fc, according to the corresponding color (one‐way ANOVA and Bonferroni multiple comparisons test).
References
-
- Folkman J (2007) Angiogenesis: an organizing principle for drug discovery? Nat Rev Drug Discov 6: 273–286 - PubMed
-
- Annex BH (2013) Therapeutic angiogenesis for critical limb ischaemia. Nat Rev Cardiol 10: 387–396 - PubMed
-
- Giacca M, Zacchigna S (2012) VEGF gene therapy: therapeutic angiogenesis in the clinic and beyond. Gene Ther 19: 622–629 - PubMed
-
- Potente M, Gerhardt H, Carmeliet P (2011) Basic and therapeutic aspects of angiogenesis. Cell 146: 873–887 - PubMed
Publication types
MeSH terms
Substances
LinkOut - more resources
Full Text Sources
Other Literature Sources
Molecular Biology Databases
Research Materials
Miscellaneous

