

Metabolic syndrome and its components with neuron-specific enolase: a cross-sectional study in large health check-up population in China
- PMID: 29643166
- PMCID: PMC5898352
- DOI: 10.1136/bmjopen-2017-020899
Metabolic syndrome and its components with neuron-specific enolase: a cross-sectional study in large health check-up population in China
Abstract
Objective: This study was aimed at investigating the relationship between neuron-specific enolase (NSE) and components of metabolic syndrome (MS).
Design: Cross-sectional study.
Setting: Chinese health check-up population.
Participants: 40 684 health check-up people were enrolled in this study from year 2014 to 2016.
Main outcome measures: OR and coefficient for MS.
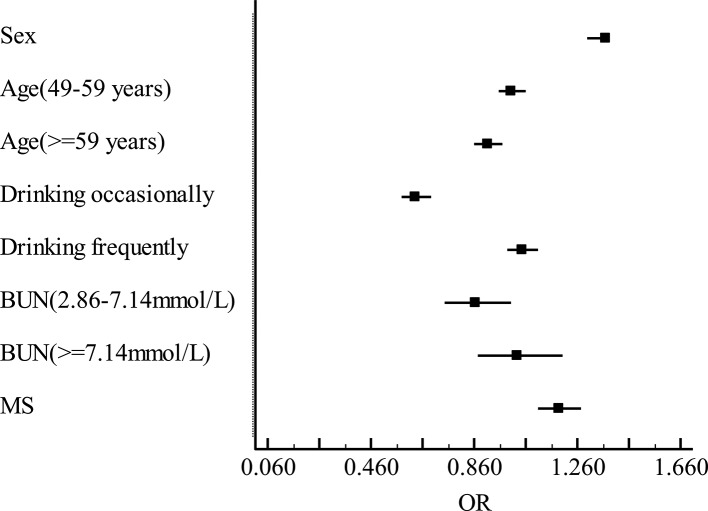
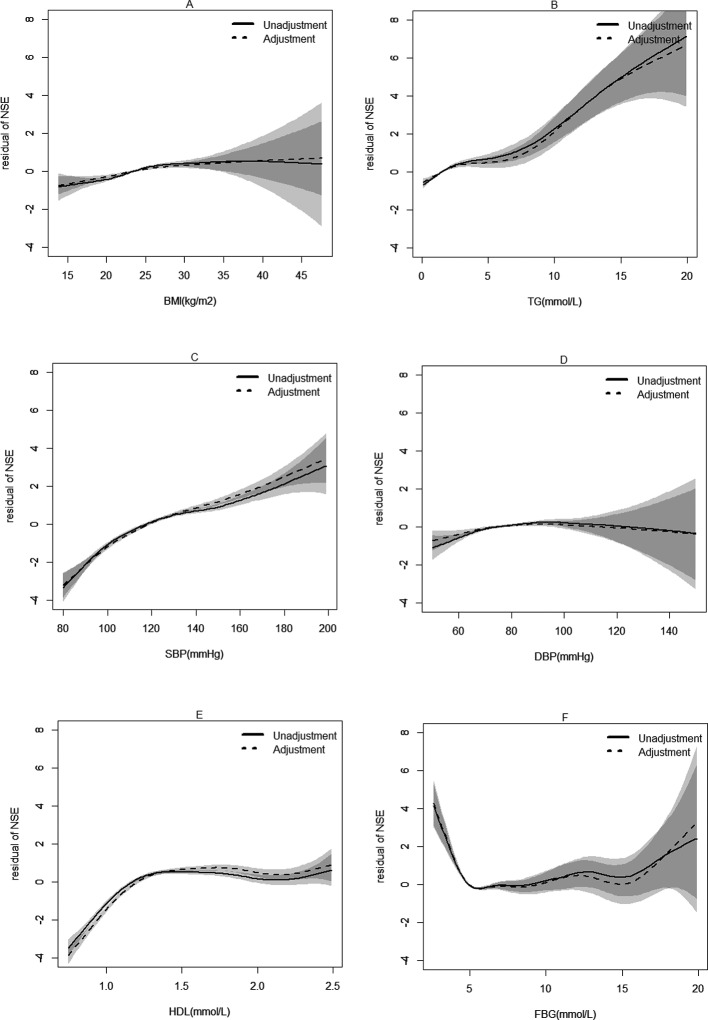
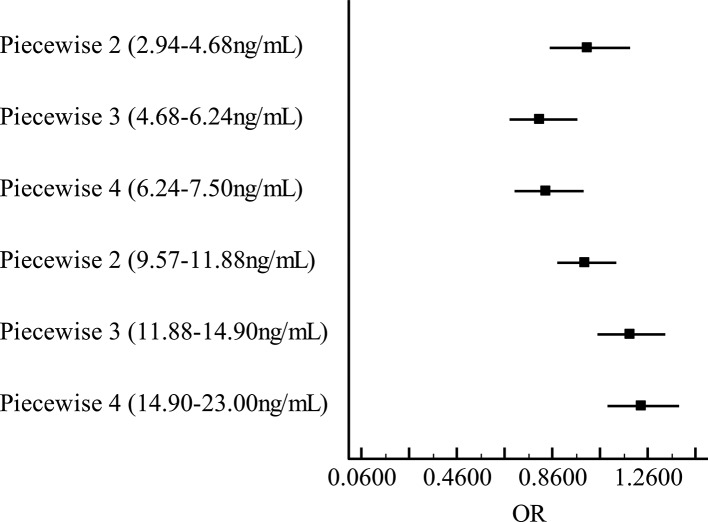
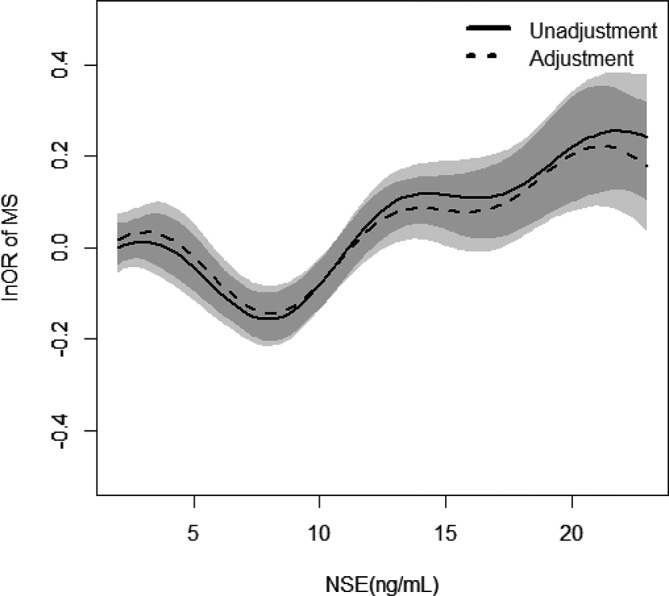
Results: The percentage of abnormal NSE and MS was 26.85% and 8.85%, respectively. There were significant differences in sex, body mass index, drinking habit, triglycerides (TGs), high-density lipoprotein cholesterol (HDL-C), blood pressure and MS between low-NSE and high-NSE groups. In logistic regression analysis, elevated NSE was present in MS, higher body mass index, hypertriglyceridaemia, hypertension and low-HDL groups. Stepwise linear analysis showed a negative correlation between NSE and fasting blood glucose (FBG) (<6.0 mmol/L), and a positive correlation between NSE and TGs (<20 mmol/L), systolic blood pressure (75-200 mm Hg), HDL-C (0.75-2.50 mmol/L), diastolic blood pressure (<70 mm Hg) and FBG (6.00-20.00 mmol/L). Furthermore, MS was positively correlated with NSE within the range of 2.00-7.50 ng/mL, but had a negative correlation with NSE within the range of 7.50-23.00 ng/mL.
Conclusion: There are associations between NSE with MS and its components. The result suggests that NSE may be a potential predictor of MS. Further research could be conducted in discussing the potential mechanism involved.
Keywords: cross-sectional study; metabolic syndrome; neuron specific enolase.
© Article author(s) (or their employer(s) unless otherwise stated in the text of the article) 2018. All rights reserved. No commercial use is permitted unless otherwise expressly granted.
Conflict of interest statement
Competing interests: None declared.
Figures
References
-
- Forouzanfar MH, Alexander L, Anderson HR, et al. Global, regional, and national comparative risk assessment of 79 behavioural, environmental and occupational, and metabolic risks or clusters of risks in 188 countries, 1990-2013: a systematic analysis for the Global Burden of Disease Study 2013. Lancet 2015;386:2287–323. 10.1016/S0140-6736(15)00128-2 - DOI - PMC - PubMed
MeSH terms
Substances
LinkOut - more resources
Full Text Sources
Other Literature Sources
Medical