. 2018 May 25;293(21):8089-8102.
doi: 10.1074/jbc.RA118.001739. Epub 2018 Apr 11.

Smooth muscle cells differentiated from mesenchymal stem cells are regulated by microRNAs and suitable for vascular tissue grafts

Affiliations

Smooth muscle cells differentiated from mesenchymal stem cells are regulated by microRNAs and suitable for vascular tissue grafts

Wenduo Gu et al. J Biol Chem. .

Abstract

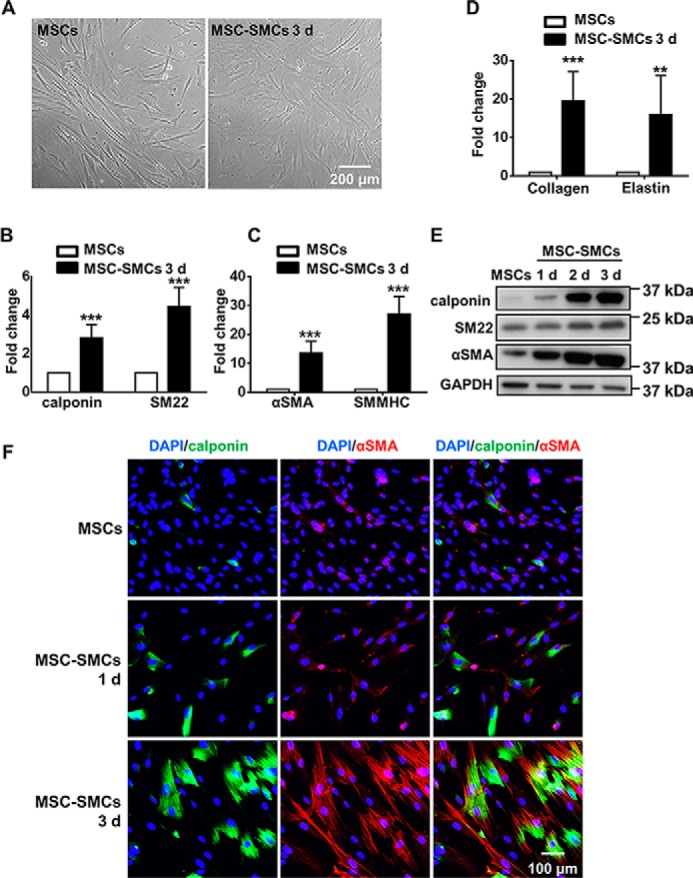
Tissue-engineered vascular grafts with long-term patency are greatly needed in the clinical settings, and smooth muscle cells (SMCs) are a critical graft component. Human mesenchymal stem cells (MSCs) are used for generating SMCs, and understanding the underlying regulatory mechanisms of the MSC-to-SMC differentiation process could improve SMC generation in the clinic. Here, we found that in response to stimulation of transforming growth factor-β1 (TGFβ1), human umbilical cord-derived MSCs abundantly express the SMC markers α-smooth muscle actin (αSMA), smooth muscle protein 22 (SM22), calponin, and smooth muscle myosin heavy chain (SMMHC) at both gene and protein levels. Functionally, MSC-derived SMCs displayed contracting capacity in vitro and supported vascular structure formation in the Matrigel plug assay in vivo More importantly, SMCs differentiated from human MSCs could migrate into decellularized mouse aorta and give rise to the smooth muscle layer of vascular grafts, indicating the potential of utilizing human MSC-derived SMCs to generate vascular grafts. Of note, microRNA (miR) array analysis and TaqMan microRNA assays identified miR-503 and miR-222-5p as potential regulators of MSC differentiation into SMCs at early time points. Mechanistically, miR-503 promoted SMC differentiation by directly targeting SMAD7, a suppressor of SMAD-related, TGFβ1-mediated signaling pathways. Moreover, miR-503 expression was SMAD4-dependent. SMAD4 was enriched at the miR-503 promoter. Furthermore, miR-222-5p inhibited SMC differentiation by targeting and down-regulating ROCK2 and αSMA. In conclusion, MSC differentiation into SMCs is regulated by miR-503 and miR-222-5p and yields functional SMCs for use in vascular grafts.

Keywords: cell differentiation; mesenchymal stem cells (MSCs); microRNA mechanism; tissue engineering; transforming growth factor beta (TGF-β); umbilical cord mesenchymal stem cells; vascular smooth muscle cells.


Conflict of interest statement

The authors declare that they have no conflicts of interest with the contents of this article

Figures

Figure 1.
Figure 1.
Differentiation of human umbilical cord MSCs toward SMC lineage with TGFβ1. A, morphology of undifferentiated MSCs and cells cultured in differentiation medium (αMEM with 5 ng/ml TGFβ1 and 1% serum) for 3 days (d) (MSC-SMCs 3d). B–D, Q-PCR showed the mRNA level induction of calponin, SM22, αSMA, SMMHC, collagen I, and elastin in the differentiation medium for 3 days. E, Western blot analysis showed the induction of SMC specific markers at different time points during differentiation at the protein level. Images shown are representative of three independent experiments. F, immunofluorescent staining showed the induction of SMC-specific markers at different time points. Representative images are shown from three independent experiments. Data are presented as the mean ± S.D. and are from three independent experiments. **, p < 0.01, and ***, p < 0.001. MSC-SMCs, smooth muscle cells differentiated from mesenchymal stem cells.
Figure 2.
Figure 2.
Functional SMCs were differentiated from MSCs and gave rise to grafts with SMC layer in vascular tissue engineering. A and B, MSCs treated with 5 ng/ml TGFβ1 displayed better contractility as shown in the representative picture from collagen I contraction assay (A) and correspondent statistical analysis from three independent experiments (B). C, in subcutaneous Matrigel plug assay, SMCs differentiated from mesenchymal stem cells (MSC-SMCs) mixed with umbilical vein endothelial cells gave rise to better vascular-like structure compared with undifferentiated mesenchymal stem cells (MSCs) mixed with endothelial cells as shown by H & E staining. D, Matrigel plugs with SMCs differentiated from mesenchymal stem cells mixed with endothelial cells showed stronger intensity of CD31 and αSMA as well as tube-like structure as demonstrated by immunofluorescent staining. Three Matrigel plugs were obtained in each group. E, DAPI staining of decellularized mouse aorta (De) and decellularized mouse aorta seeded with SMCs differentiated from MSCs (Seeded). DAPI staining demonstrated the colonization of seeded cells in the decellularized vascular graft, whereas the decellularized vascular graft was not stained with DAPI. F, SMC markers (calponin, SM22, αSMA, and SMMHC) were stained in vascular graft samples engineered by seeding SMCs differentiated from MSCs on the decellularized aorta and maintained in the ex vivo bioreactor system for 5 days. A and C–F are representative of three independent experiments. Data are presented as the mean ± S.D. from three independent experiments. *, p < 0.05. MSC-SMCs, smooth muscle cells differentiated from mesenchymal stem cells.
Figure 3.
Figure 3.
miR-503 promotes SMC differentiation from MSCs. A, level of miRNAs was detected with TaqMan microRNA assay at early time points in SMC differentiation in 1% FBS and 5 ng/ml TGFβ1. B, level of miRNA with or without TGFβ1 treatment after 2 days was detected with TaqMan microRNA assay. C, TaqMan microRNA assay showed significant up-regulation of miR-503 after mimic treatment for 1 day in αMEM with 1% FBS. D, Q-PCR showed the mRNA level up-regulation of SMC-specific markers after miR-503 mimic treatment for 3 days in αMEM with 1% FBS. E, protein expression and quantification after miR-503 mimic treatment for 3 days in αMEM with 1% FBS were analyzed. F, TaqMan microRNA assay showed significant down-regulation of miR-503 after inhibitor treatment for 1 day. G, level of SMC-specific markers was detected with Q-PCR after miR-503 inhibitor treatment for 3 days in αMEM with 1% FBS and 5 ng/ml TGFβ1. H, protein expression and quantification after miR-503 inhibitor treatment for 3 days in αMEM with 1% FBS and 5 ng/ml TGFβ1 were analyzed. Data are presented as the mean ± S.D. from three independent experiments. *, p < 0.05; **, p < 0.01, and ***, p < 0.001. mim ctrl, miRNA mimic negative control; mim 503, miR-503 mimic; inhi ctrl, miRNA inhibitor negative control; inhi 503, miR-503 inhibitor. MSC-SMCs, smooth muscle cells differentiated from mesenchymal stem cells.
Figure 4.
Figure 4.
miR-503 directly targets SMAD7 in regulating SMC differentiation. A–C, SMAD7 mRNA was detected with Q-PCR at different time points during SMC differentiation in 1% FBS and 5 ng/ml TGFβ1 (A), after treatment with TGFβ1 for 2 days compared with cells cultured only in 1% FBS (B), and after treatment with miR-503 mimics in αMEM with 1% FBS for 3 days (C). D, representative picture of Western blotting and analysis from three independent experiments showed the down-regulation of SMAD7 at the protein level after treatment with miR-503 mimics in αMEM with 1% FBS for 3 days. E, Q-PCR of SMAD7 and SMC markers after siRNA transfection for 2 days in αMEM with 1% FBS. F, Western blotting image and analysis after siRNA transfection for 2 days in αMEM with 1% FBS. Representative image was shown from three independent experiments. G, alignment of miR-503 and the 3′-UTR of SMAD7 gene showed the postulated target-binding sites (red) and induced mutations (blue). Two different kinds of mutations were induced (m1 and m2) of the same site. H, co-transfection of miR-503 mimics and reporter with WT SMAD7 3′-UTR segment showed reduced relative luciferase activity as compared with vector with empty plasmid, whereas mutation of target-binding sites recovered the reduction. Relative luciferase activity was calculated with firefly luciferase activity/Renilla luciferase activity. Data are presented as the mean ± S.D. from three independent experiments. Statistics were obtained from two-way ANOVA test followed by Bonferroni post hoc analysis. *, p < 0.05; **, p < 0.01; and ***, p < 0.001. mim ctrl, miRNA mimic negative control; mim 503, miR-503 mimic; si ctrl, siRNA negative control; si SMAD7, siRNA SMAD7; ctrl, plasmid negative control; wt, plasmid bearing WT SMAD7 3′-UTR.
Figure 5.
Figure 5.
miR-503 is transcriptionally up-regulated through SMAD4-dependent pathway. A, SMAD4 mRNA was detected with Q-PCR after treatment with siRNA for 1 day in αMEM with 1% FBS and 5 ng/ml TGFβ1. B, Q-PCR of SMC markers after siRNA transfection for 2 days in αMEM with 1% FBS and 5 ng/ml TGFβ1. C, level of miR-503 detected with TaqMan microRNA assay after cells were treated with siRNA with or without TGFβ1 for 2 days. D, MSCs were starved and then treated with or without TGFβ1 for 4 h and then harvested for ChIP experiments. Cells cultured without TGFβ1 were used as a control. Three primers (primer 1, primer 2, and primer 3) specific to the miR-503 promoter region were used to detect the enrichment of SMAD4. A primer specific to the GAPDH promoter region was used as a negative control. Fold enrichment was calculated against input and the control without TGFβ1 treatment. Data were obtained from at least three independent experiments and shown as mean ± S.D. Statistics were obtained with t test (A and B) or one-way ANOVA (C and D), followed by Bonferroni post hoc analysis. *, p < 0.05, and ***, p < 0.001.
Figure 6.
Figure 6.
miR-222-5p inhibits SMC differentiation from MSCs. A, level of miR-222-5p was detected with TaqMan microRNA assay. B, Q-PCR showed the gene expression of SMC markers (calponin and αSMA) after cells were treated with miRNA mimics in αMEM with 1% FBS and 5 ng/ml TGFβ1 for 2 days. C, representative Western blotting image and analysis after cells were treated with miRNA mimics in αMEM with 1% FBS and 5 ng/ml TGFβ1 for 2 days were obtained from three independent experiments. D, immunofluorescent staining showed the intensity of SMC markers (calponin and αSMA) after miR-222-5p treatment for 2 days. Cell nucleus was stained with DAPI (blue). Representative images were obtained from three independent experiments. Data were obtained from at least three independent experiments and shown as mean ± S.D. *, p < 0.05; **, p < 0.01; and ***, p < 0.001. mim ctrl, miRNA mimic negative control; mim 222-5p, miR-222-5p mimic.
Figure 7.
Figure 7.
ROCK2 3′-UTR is a potential target of miR-222-5p. A, Q-PCR showed the up-regulation of ROCK2 in a time-dependent manner during SMC differentiation in 1% FBS and 5 ng/ml TGFβ1. B, miR-222-5p mimic treatment in αMEM with 1% FBS and 5 ng/ml TGFβ1 for 2 days inhibited the level of ROCK2 mRNA as shown by Q-PCR. C, Western blotting and analysis of ROCK2 after miR-222-5p mimic treatment in αMEM with 1% FBS and 5 ng/ml TGFβ1 for 2 days. D, protein level of ROCK2 (red) was detected with immunofluorescent staining and correspondent analysis. DAPI (blue) was used to stain the nucleus. E, efficiency of siRNA ROCK2 was confirmed with significant down-regulation of ROCK2 detected with Q-PCR. F, Q-PCR showed the down-regulation of SMC markers after treatment of siRNA ROCK2 in αMEM with 1% FBS and 5 ng/ml TGFβ1 for 2 days. G, Western blotting and analysis of cells treated with siRNA in medium with TGFβ1. Images shown (C, D, and G, left panels) were representative of three independent experiments. Data were obtained from at least three independent experiments and shown as mean ± S.D. *, p < 0.05; **, p < 0.01, and ***, p < 0.001. mim ctrl, miRNA mimic negative control; mim 222-5p, miR-222-5p mimic, si ctrl, siRNA negative control; si ROCK2, siRNA ROCK2.
Figure 8.
Figure 8.
3′-UTRs of ROCK2 and αSMA were direct targets of miR-222-5p. A, alignment of miR-222-5p and ROCK2 3′-UTR showed the postulated target-binding sites (red) and induced mutations (blue). ROCK2 3′-UTR contains two target-binding sites (site 1 and site 2) of miR-222-5p, which were mutated alone (m1, m2) or together (m1+m2). B, alignment of miR-222-5p and the 3′-UTR of αSMA showed the postulated target-binding sites (red) and induced mutations (blue). C, co-transfection of miR-222-5p mimics and reporter plasmid with WT ROCK2 3′-UTR showed reduced relative luciferase activity as compared with vector with empty plasmid, whereas mutation of both target-binding sites (m1+m2) recovered the reduction. D, dual transfection of plasmids and miR-222-5p into HEK293 cells demonstrated the inhibition of miR-222-5p on the 3′-UTR of αSMA, and mutation of the predicted target site recovered the inhibition. Relative luciferase activity was calculated with firefly luciferase activity/Renilla luciferase activity. Data are presented as the mean ± S.D. from three independent experiments. Statistics (C and D) were obtained from two-way ANOVA test followed by Bonferroni post hoc analysis. E, level of miR-503 was inhibited by miR-222-5p mimic treatment after 1 day as shown with TaqMan microRNA assay. F, TaqMan microRNA assay of miR-222-5p did not reveal any change after miR-503 mimic treatment. Data are presented as the mean ± S.D. from three independent experiments. *, p < 0.05, and ***, p < 0.001. mim ctrl, miRNA mimic negative control; mim 503, miR-503 mimic; ctrl, plasmid without SMAD7 3′-UTR; wt, plasmid bearing WT SMAD7 3′-UTR.
Figure 9.
Figure 9.
Schematic graph of miRNA-involved pathways in the SMC differentiation process from MSCs. In MSC to SMC differentiation, upon stimulation of TGFβ1, miR-503 is up-regulated in a SMAD4-dependent pathway and directly targets SMAD7, which is a negative regulator of the TGFβ1 SMAD-dependent signaling pathway, to promote SMC differentiation. The level of miR-222-5p was down-regulated in the differentiation process. This results in de-repression of its direct targets ROCK2 and αSMA and subsequent promotion of SMC differentiation. Furthermore, the expression of miR-503 could be inhibited by miR-222-5p.

Similar articles

Cited by

References

    1. Lee M. S., Park S. J., Kandzari D. E., Kirtane A. J., Fearon W. F., Brilakis E. S., Vermeersch P., Kim Y. H., Waksman R., Mehilli J., Mauri L., and Stone G. W. (2011) Saphenous vein graft intervention. JACC Cardiovasc. Interv. 4, 831–843 10.1016/j.jcin.2011.05.014 - DOI - PubMed
    1. Karamariti E., Margariti A., Winkler B., Wang X., Hong X., Baban D., Ragoussis J., Huang Y., Han J. D., Wong M. M., Sag C. M., Shah A. M., Hu Y., and Xu Q. (2013) Smooth muscle cells differentiated from reprogrammed embryonic lung fibroblasts through DKK3 signaling are potent for tissue engineering of vascular grafts. Circ. Res. 112, 1433–1443 10.1161/CIRCRESAHA.111.300415 - DOI - PubMed
    1. Chen Y., Wong M. M., Campagnolo P., Simpson R., Winkler B., Margariti A., Hu Y., and Xu Q. (2013) Adventitial stem cells in vein grafts display multilineage potential that contributes to neointimal formation. Arterioscler. thromb. Vasc. Biol. 33, 1844–1851 10.1161/ATVBAHA.113.300902 - DOI - PubMed
    1. Adams B., Xiao Q., and Xu Q. (2007) Stem cell therapy for vascular disease. Trends Cardiovasc. Med. 17, 246–251 10.1016/j.tcm.2007.08.005 - DOI - PubMed
    1. Campagnolo P., Tsai T. N., Hong X., Kirton J. P., So P. W., Margariti A., Di Bernardini E., Wong M. M., Hu Y., Stevens M. M., and Xu Q. (2015) c-Kit+ progenitors generate vascular cells for tissue-engineered grafts through modulation of the Wnt/Klf4 pathway. Biomaterials 60, 53–61 10.1016/j.biomaterials.2015.04.055 - DOI - PMC - PubMed

Publication types

MeSH terms