. 2018 Jun 4;215(6):1627-1647.
doi: 10.1084/jem.20180247. Epub 2018 Apr 11.

Peripherally derived macrophages can engraft the brain independent of irradiation and maintain an identity distinct from microglia

Affiliations

Peripherally derived macrophages can engraft the brain independent of irradiation and maintain an identity distinct from microglia

James C Cronk et al. J Exp Med. .

Abstract

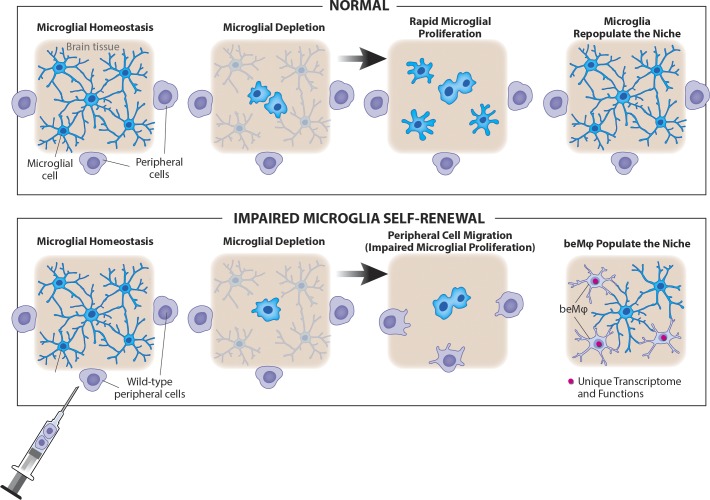
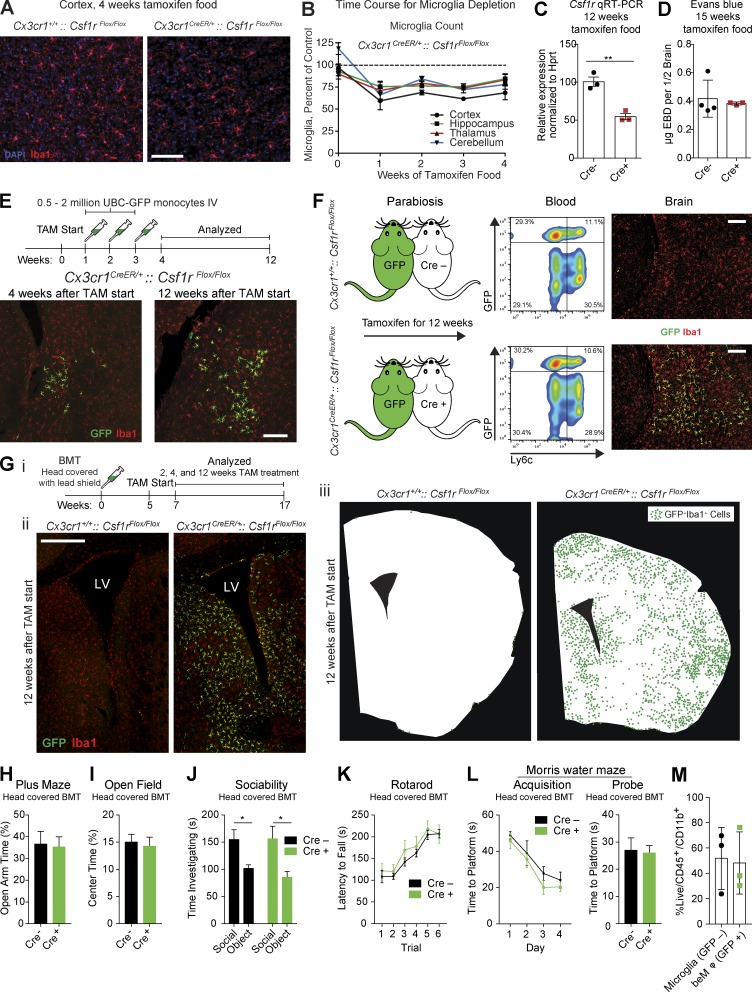
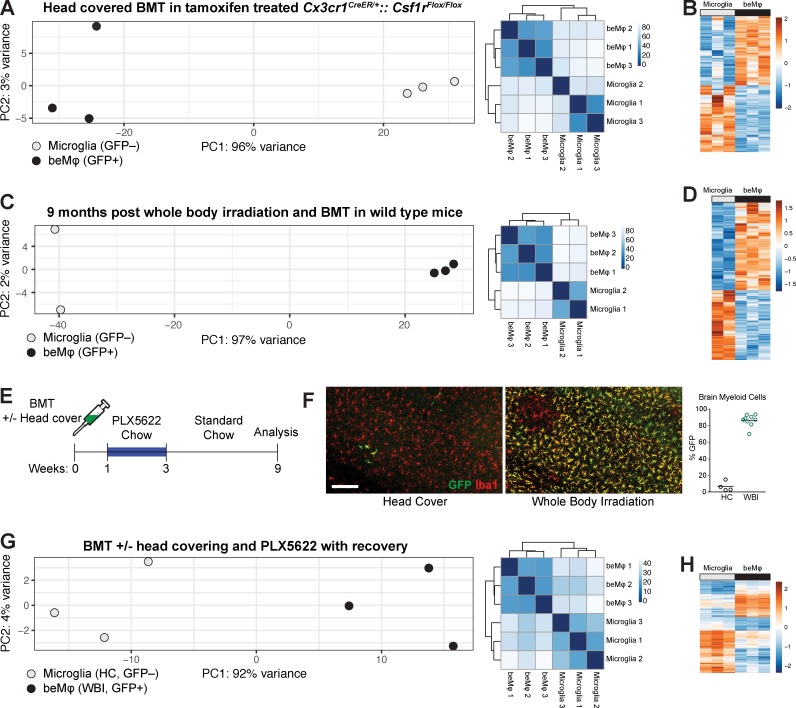
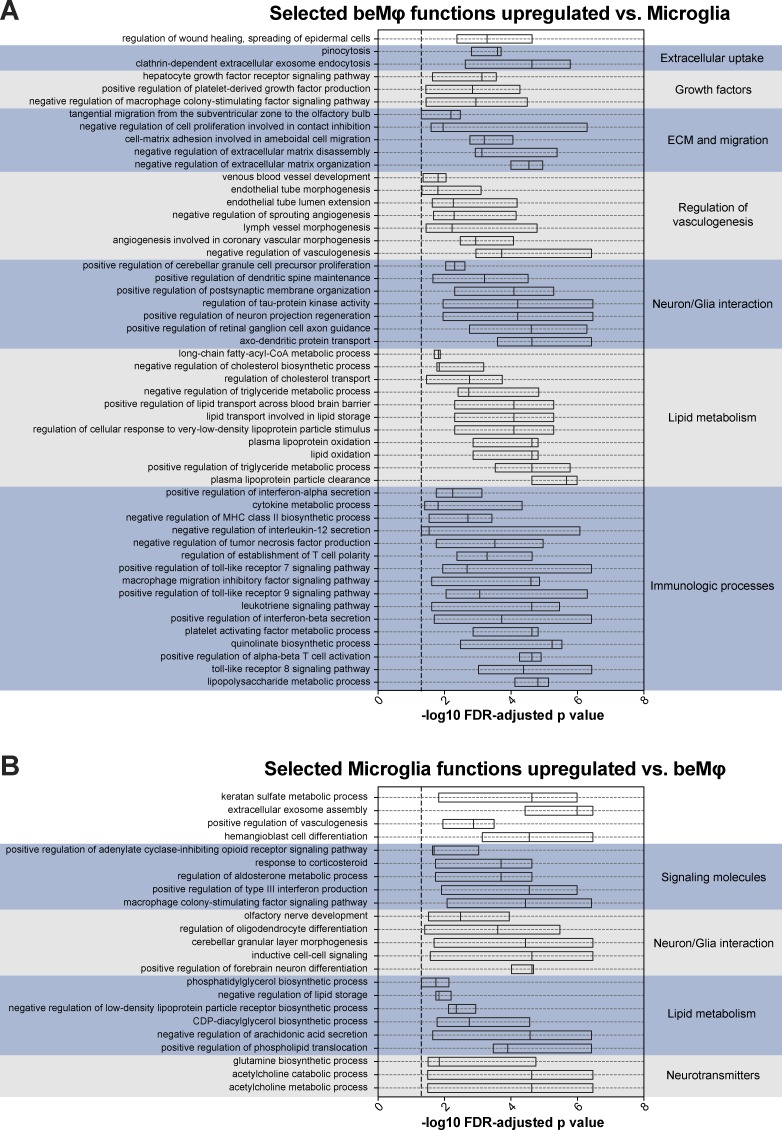
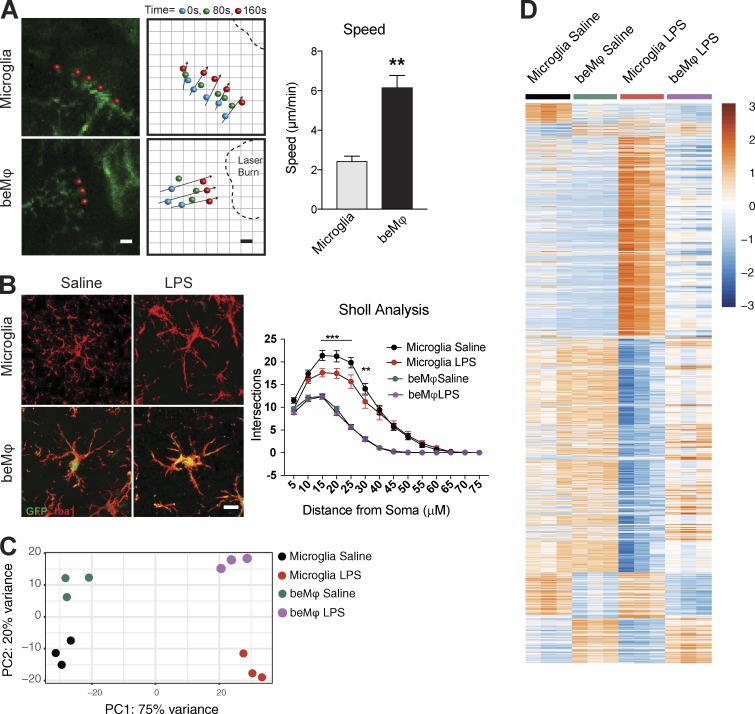
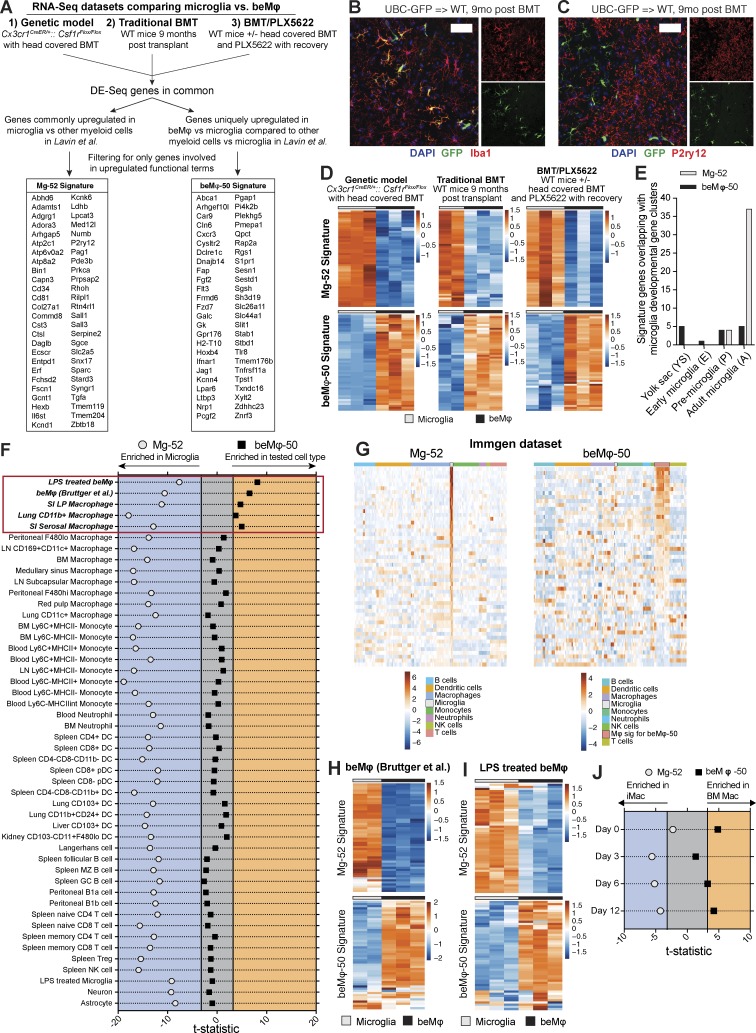
Peripherally derived macrophages infiltrate the brain after bone marrow transplantation and during central nervous system (CNS) inflammation. It was initially suggested that these engrafting cells were newly derived microglia and that irradiation was essential for engraftment to occur. However, it remains unclear whether brain-engrafting macrophages (beMφs) acquire a unique phenotype in the brain, whether long-term engraftment may occur without irradiation, and whether brain function is affected by the engrafted cells. In this study, we demonstrate that chronic, partial microglia depletion is sufficient for beMφs to populate the niche and that the presence of beMφs does not alter behavior. Furthermore, beMφs maintain a unique functional and transcriptional identity as compared with microglia. Overall, this study establishes beMφs as a unique CNS cell type and demonstrates that therapeutic engraftment of beMφs may be possible with irradiation-free conditioning regimens.


Figures

None
Graphical abstract
Figure 1.
Figure 1.
Partial microglia depletion leads to beMφ engraftment independent of irradiation. (A) Representative images of Iba1+ microglia (red) after 4 wk of tamoxifen treatment in Cx3cr1CreER/+::Csf1rFlox/Flox mice and Cre-negative controls. Nuclei (DAPI) are shown in blue (n = 3 Cre and 4 Cre+ mice). Bar, 100 µm. (B) Deleting Csf1r from microglia results in ∼25% chronic reduction of microglia throughout the brain (n = 3–4 mice per group for each time point; representative of two experiments). (C) Gene expression by quantitative RT-PCR of CD115/Csf1r on sorted microglia (n = 3 per group; two-tailed Student’s t test, **, P < 0.01; performed once). (D) Quantification of Evans blue dye in brains of Cx3cr1+/+::Csf1rflox/flox and Cx3cr1CreER/+::Csf1rflox/flox mice fed tamoxifen diet for 15 wk (n = 4 and 3 mice per group, two-tailed Student’s t test, not significant; performed once). (E) Top: Injection strategy for GFP+ monocytes. Bottom: Representative images of GFP+ beMφs (green) infiltrating adjacent to a lateral ventricle 1 and 9 wk after the last monocyte injection. All brain macrophages (resident microglia and beMφs) are positive for Iba1 (red). Images are representative of n = 3 mice (representative of two experiments). Bar, 200 µm. (F) Left: Cartoon of parabiotic pairings. UBC-GFP mice were paired to Cx3cr1CreER/+::Csf1rFlox/Flox mice and Cre-negative controls. After 12 wk of tamoxifen treatment, blood was analyzed by flow cytometry (middle), and brains were analyzed by immunohistochemistry (right). Although the percentage of GFP+ cells in the blood was similar between Cx3cr1CreER/+::Csf1rFlox/Flox mice and Cre-negative controls, GFP+ beMφs (green) were only found in Cre-positive mice. All brain macrophages, including microglia, were Iba1 positive (red). Images/data are representative of n = 3 mice per group. Bars, 200 µm. (G) Strategy to assess engraftment of beMφs after BMT using lead to shield the head (i). Representative images of beMφs (green) after 12 wk on tamoxifen (ii). All macrophages, including microglia, are Iba1+ (red), whereas beMφs are also GFP+ (green). Bar, 500 µm. LV, lateral ventricle. Illustrations of beMφ engraftment after 12 wk on tamoxifen (iii). Silhouettes of brain sections were generated on actual brain slices and beMφs locations were marked with a green dot. Each dot represents a single GFP+Iba1+ beMφ. Images are representative of n = 3–6 mice per group (representative of two independent experiments). (H–L) No differences in behavior were observed in mice containing beMφs (Cre+). Cx3cr1CreER/+::Csf1rFlox/Flox mice and Cre-negative controls underwent BMT with head shielding. After recovery, mice were treated with tamoxifen for 12 wk and then placed back on a regular diet for 4 wk before behavioral testing. Mice were tested on the plus maze (H; not significant, two-tailed Student’s t test; n = 24, 23; pooled data from two independent cohorts), open field (I; not significant, two-tailed Student’s t test; n = 24, 23; pooled data from two independent cohorts), three-chamber social assay (J; not significant for genotype and *, P < 0.05 for social variable, two-way repeated measures ANOVA with Sidak’s post hoc; n = 15; pooled data from two independent experiments), rotarod (K; not significant for genotype, two-way repeated measures ANOVA; n = 9, 8; experiment performed once), and water maze (L; not significant for acquisition, two-way repeated measures ANOVA and not significant for probe trial, two-tailed Student’s t test; n = 9, 8; performed once). (M) Quantification of brain macrophages from mice in behavior assays by flow cytometry. Mice were analyzed after behavior assays were complete, at least 8 wk after they had been placed back on regular diet. Brains of Cre-positive mice contained 48.2% ± 14.2 SEM beMφs (GFP+) out of total CD45/CD11b+ cells (not significant, two-tailed Student’s t test; n = 3 samples per cell type with 3–4 mice pooled per sample; performed once). Error bars represent ±SEM.
Figure 2.
Figure 2.
beMφs are a transcriptionally distinct cell type. (A) PCA plot and heatmap of distance between samples for beMφs and microglia in the Cx3cr1CreER/+::Csf1rFlox/Flox model with head-covered BMT and tamoxifen treatment. Mice were treated with tamoxifen for 12 wk, followed by a minimum of 8 wk on control chow (each dot represents a pooled sample from at least three mice). (B) Differentially expressed genes (adjusted P < 0.05) between beMφs and microglia in the Cx3cr1CreER/+::Csf1rFlox/Flox model with head-covered BMT and tamoxifen treatment. The values are standardized rlog-transformed values across samples. (C) PCA plot and heatmap of distance between samples for the beMφs and microglia when using traditional BMT (each dot represents a pooled sample from at least three mice). (D) Differentially expressed genes (adjusted P < 0.05) between beMφs and microglia when using traditional BMT. The values are standardized rlog-transformed values across samples. (E) Strategy for achieving beMφ engraftment using BMT with or without head covering and PLX5622 treatment. (F) Representative images and quantification of GFP+ beMφs in mice treated as in E. Bar, 200 µm. HC, head covered; WBI, whole-body irradiation. (G) PCA plot and heatmap of distance between samples for beMφs and microglia when using BMT/PLX5622 (each dot represents a pooled sample from at least three mice). (H) Differentially expressed genes (adjusted P < 0.05) between beMφs and microglia when using BMT/PLX5622. The values are standardized rlog-transformed values across samples.
Figure 3.
Figure 3.
beMφs and microglia maintain unique predicted functions in multiple experimental models. (A) Selected beMφ Gene Ontology biological functions that are identified as enriched by GSVA in the Cx3cr1CreER/+::Csf1rFlox/Flox model with head-covered BMT and tamoxifen treatment, traditional BMT, and BMT/PLX5622 when compared with the microglia in the same experiment. The boxplots show the distribution of the −log10(FDR-adjusted p-value) of the corresponding functional term calculated for each of the three experiments. A complete list of functions commonly up-regulated in beMφs versus microglia in all datasets can be found in Table S2. (B) Selected microglia Gene Ontology biological functions that are identified as enriched by GSVA in the Cx3cr1CreER/+::Csf1rFlox/Flox model with head-covered BMT and tamoxifen treatment, traditional BMT, and BMT/PLX5622 when compared with beMφs in the same experiment. Boxplots show the distribution with mean of the −log10(FDR-adjusted p-value) of the corresponding functional term calculated for each of the three experiments. A complete list of functions commonly up-regulated in microglia versus beMφs in all datasets can be found in Table S2.
Figure 4.
Figure 4.
beMφs have distinct morphology and response to stimuli compared with microglia. (A) Representative images from two-photon in vivo imaging of microglia and beMφs responding to laser injury. Bar, 5 µm. Dots represent movement of processes over time. beMφ processes move more rapidly toward the injury site (Student’s t test, **, P < 0.01; n = 3 mice; representative of two independent experiments). (B) Representative images of microglia and beMφs in response to LPS. All brain macrophages are Iba1+. Bar, 10 µm. Sholl analysis of microglia and beMφs 6 h after LPS injection (i.p.). beMφs are less complex than microglia and do not change complexity after LPS (two-way ANOVA P < 0.0001 for an interaction between type of macrophages and branching over distance; ***, P < 0.0001; **, P < 0.001; n = 60 microglia from three different mice per group; performed once). Error bars represent ±SEM. (C) PCA plots of RNA-sequencing transcriptional data from saline or LPS treated microglia and beMφs. (D) Differentially expressed genes (adjusted P < 0.05) between saline- or LPS-treated microglia and beMφs. DE comparisons were made between saline- and LPS-treated samples separately to determine two lists of DE genes, which were combined and displayed for all samples in the heatmap. The values are standardized rlog-transformed values across samples.
Figure 5.
Figure 5.
beMφs have a predictable genetic signature distinct from microglia. (A) Schematic showing how the Mg-52 and beMφ-50 signatures were generated by intersecting differentially expressed genes between beMφs and microglia (fold change > 1.5 and adjusted P < 0.05) from the Cx3cr1CreER/+::Csf1rFlox/Flox model with head-covered BMT and tamoxifen treatment, traditional BMT, and BMT/PLX5622 RNA-sequencing datasets in this study and the myeloid cells in Lavin et al. (2014). (B and C) Representative images of brains from mice 9 mo after BMT (n = 4 mice per group; performed once). Bars, 50 µm. Donor bone marrow was from a transgenic mouse that expresses GFP under a UBC promoter. beMφs (green, GFP+) express Iba1 (B), but not P2ry12 (C). (D) Heatmap of the Mg-52 and beMφ-50 in the Cx3cr1CreER/+::Csf1rFlox/Flox model with head-covered BMT and tamoxifen treatment, traditional BMT, and BMT/PLX5622 RNA-sequencing datasets. The values are standardized rlog-transformed values across samples. (E) Overlap of the Mg-52 and beMφ-50 in the microglia developmental stages from Matcovitch-Natan et al. (2016). (F) Enrichment of the Mg-52 and beMφ-50 signatures in various cell types. Axes represent the value of the CAMERA test statistic for each signature (beMφs over microglia), which is used to calculate the corrected p-value (FDR corrected). Samples falling outside of the gray area indicate a statistically significant (FDR <0.001) enrichment of the signature. Samples falling to the left of the gray area demonstrate enrichment for the signature in microglia as compared with the tested cell type. Samples falling to the right of the gray area demonstrate enrichment for the signature in the tested cell type as compared with microglia. Statistics can be found in Table 4. (G) Heatmap of the Mg-52 and beMφ-50 signatures in the Immgen microarray dataset. Values are standardized rlog-transformed values across samples. (H and I) Heatmaps of the Mg-52 and beMφ-50 signatures in beMφs and microglia in Bruttger et al. (2015) (H) and BMT/PLX5622 cells in mice treated with LPS (I); neither dataset was used in the generation of the signatures. The values are standardized rlog-transformed values across samples. (J) Enrichment of the Mg-52 and beMφ-50 signatures in induced pluripotent stem cell–derived microglia-like cells and BM Macs co-cultured with neurons from Takata et al., 2017. The enrichment method is the same as described in F. Statistics can be found in Table 4.

References

    1. Acton S.T. 2001. Fast Algorithms for Area Morphology. Digit. Signal Process. 11:187–203. 10.1006/dspr.2001.0386 - DOI
    1. Acton S.T., and Mukherjee D.P.. 2000. Area operators for edge detection. Pattern Recognit. Lett. 21:771–777. 10.1016/S0167-8655(00)00036-2 - DOI
    1. Acton S.T., and Ray N.. 2006. Biomedical Image Analysis: Tracking. Morgan & Claypool Publishers. 152 pp.
    1. Ajami B., Bennett J.L., Krieger C., Tetzlaff W., and Rossi F.M.. 2007. Local self-renewal can sustain CNS microglia maintenance and function throughout adult life. Nat. Neurosci. 10:1538–1543. 10.1038/nn2014 - DOI - PubMed
    1. Alliot F., Godin I., and Pessac B.. 1999. Microglia derive from progenitors, originating from the yolk sac, and which proliferate in the brain. Brain Res. Dev. Brain Res. 117:145–152. 10.1016/S0165-3806(99)00113-3 - DOI - PubMed

Publication types