. 2018 Apr 11;10(436):eaan3311.
doi: 10.1126/scitranslmed.aan3311.

T cell-induced CSF1 promotes melanoma resistance to PD1 blockade

Affiliations

T cell-induced CSF1 promotes melanoma resistance to PD1 blockade

Natalie J Neubert et al. Sci Transl Med. .

Abstract

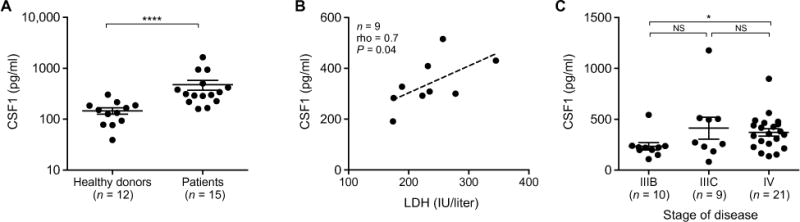
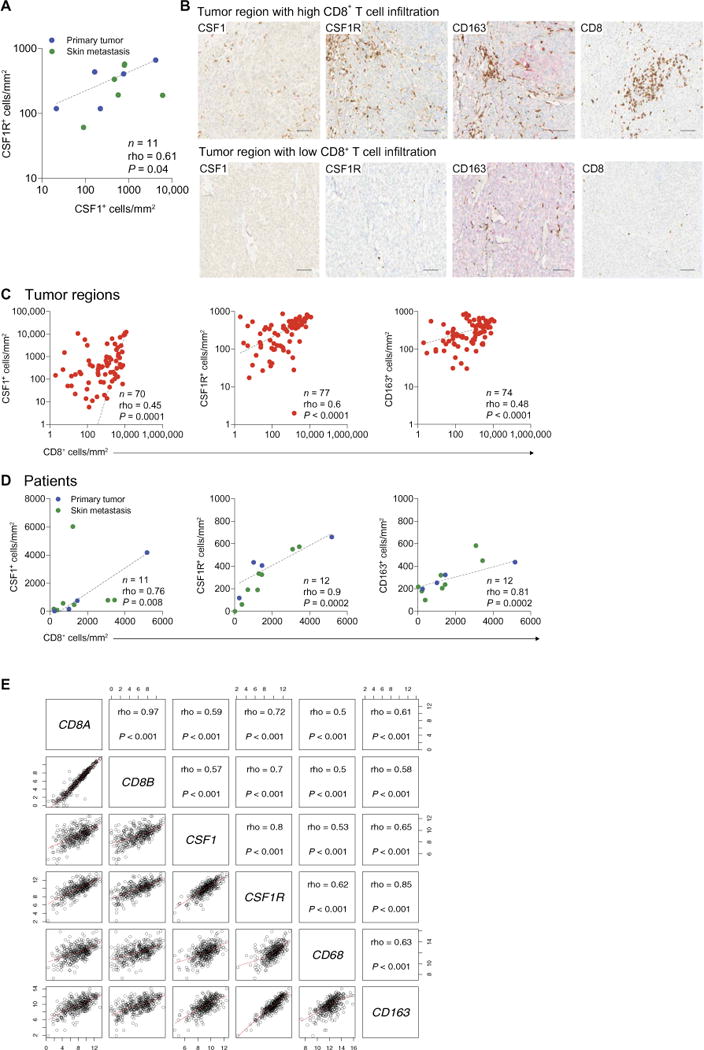
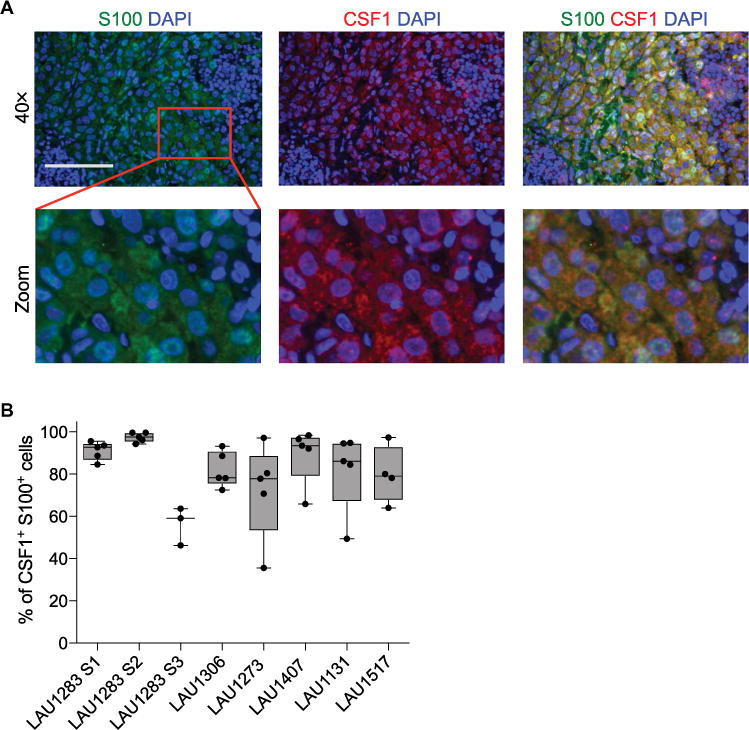
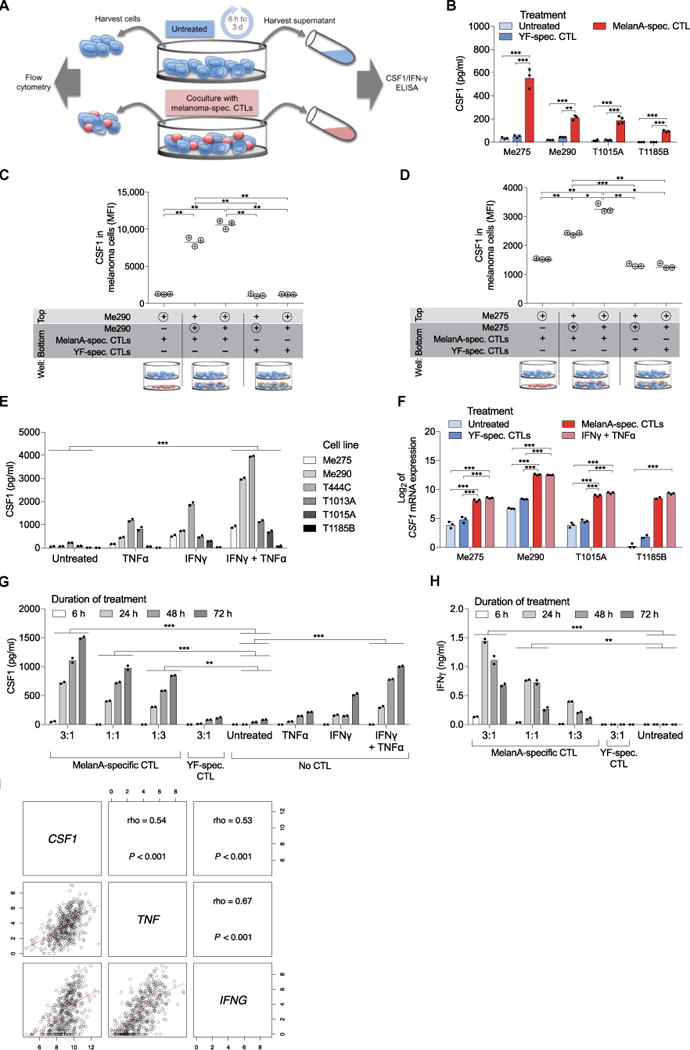
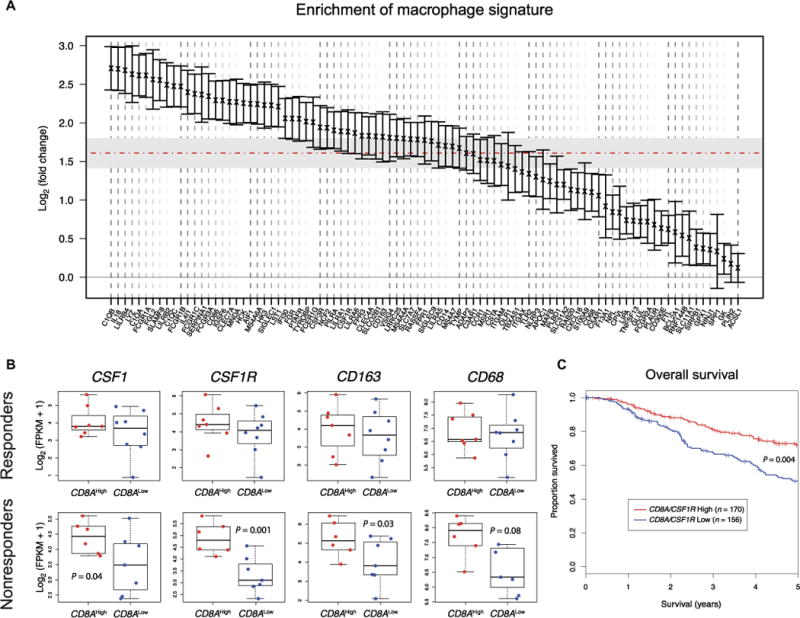
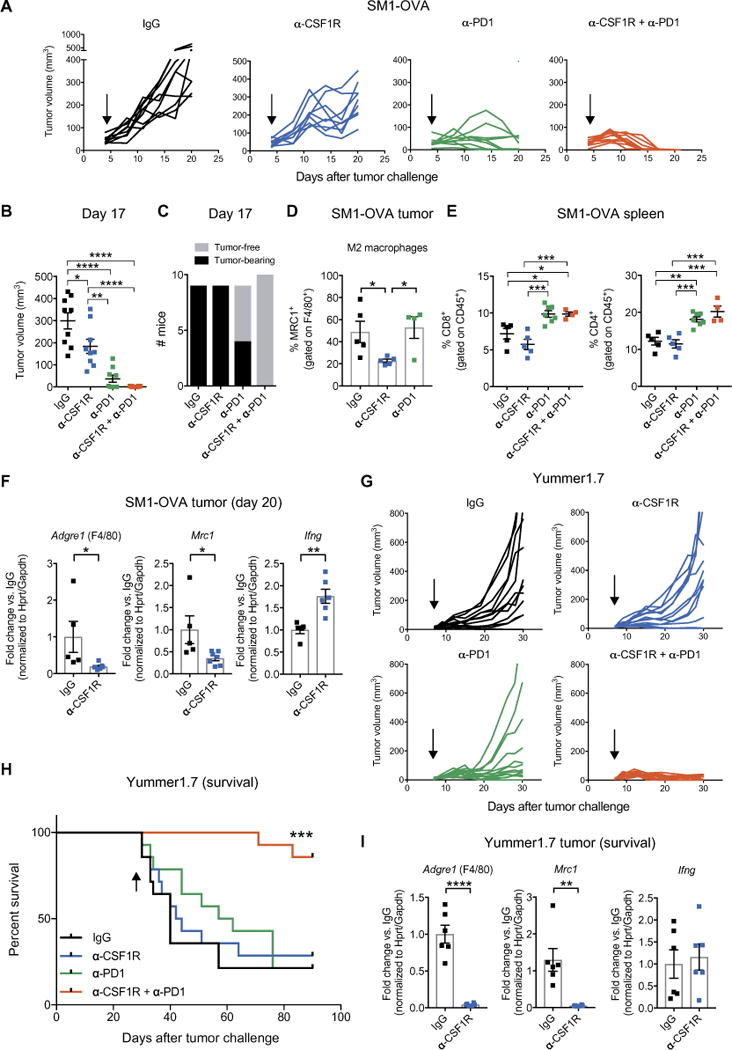
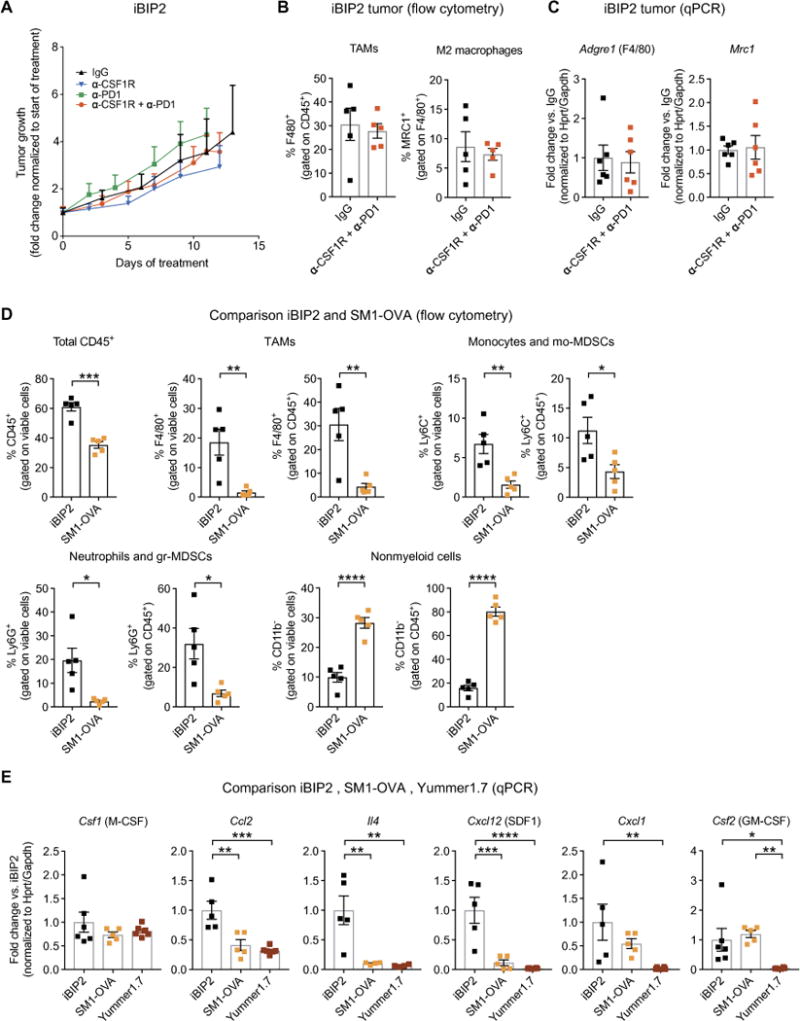
Colony-stimulating factor 1 (CSF1) is a key regulator of monocyte/macrophage differentiation that sustains the protumorigenic functions of tumor-associated macrophages (TAMs). We show that CSF1 is expressed in human melanoma, and patients with metastatic melanoma have increased CSF1 in blood compared to healthy subjects. In tumors, CSF1 expression correlated with the abundance of CD8+ T cells and CD163+ TAMs. Human melanoma cell lines consistently produced CSF1 after exposure to melanoma-specific CD8+ T cells or T cell-derived cytokines in vitro, reflecting a broadly conserved mechanism of CSF1 induction by activated CD8+ T cells. Mining of publicly available transcriptomic data sets suggested co-enrichment of CD8+ T cells with CSF1 or various TAM-specific markers in human melanoma, which was associated with nonresponsiveness to programmed cell death protein 1 (PD1) checkpoint blockade in a smaller patient cohort. Combination of anti-PD1 and anti-CSF1 receptor (CSF1R) antibodies induced the regression of BRAFV600E -driven, transplant mouse melanomas, a result that was dependent on the effective elimination of TAMs. Collectively, these data implicate CSF1 induction as a CD8+ T cell-dependent adaptive resistance mechanism and show that simultaneous CSF1R targeting may be beneficial in melanomas refractory to immune checkpoint blockade and, possibly, other T cell-based therapies.


Conflict of interest statement

Competing interests: C.H.R., I.K., and S.H. are employees of Roche Diagnostics GmbH. C.H.R. and S.H. are inventors of granted and pending patent applications relating to RG7155, and stockholders of F. Hoffmann–La Roche. Roche is investigating combinations of the CSF1R antibody emactuzumab and immune checkpoint inhibitors. C.H.R. is inventor on patent applications (WO2011107553A1 and WO2013132044A1) filed by Hoffmann–La Roche that cover CSF1R blockade and its combination with immune checkpoint inhibitors for cancer treatment. The other authors declare that they have no competing interests.

Figures

Fig. 1
Fig. 1. CSF1 is increased in blood of melanoma patients and correlates with disease progression
(A) CSF1 concentration in the plasma of healthy donors (n = 12) and melanoma patients (n = 15), quantified by enzyme-linked immunosorbent assay (ELISA). Data are means ± SEM. (B) Correlation between LDH and CSF1 concentration in the serum of nine melanoma patients, of which the LDH concentration was available, using Spearman’s correlation coefficient. The dashed line indicates least-squares linear fit. (C) CSF1 concentration in the serum of melanoma patients (40 samples from 27 patients analyzed at different time points of disease progression). Patients were grouped by disease stage at the time of sample withdrawal. Data are means ± SEM. n, number of samples; rho, Spearman’s correlation coefficient; NS, not significant. Statistical analysis in (A) and (C) by Mann-Whitney U test. *P < 0.05; ****P < 0.0001.
Fig. 2
Fig. 2. Tumor infiltration by CD8+ T cells correlates with enrichment of CSF1+, CSF1R+, and CD163+ cells in primary tumors and skin metastases of melanoma patients
(A) Correlation between density of CSF1+ and CSF1R+ cells according to chromogenic IHC, assessed by Spearman’s correlation coefficient. The dashed line indicates log-log correlation. (B) Representative images of CSF1, CSF1R, CD163, and CD8 immunostaining selected from a tumor region with either high or low CD8+ T cell infiltration in a skin metastasis of patient LAU1283. Scale bars, 100 μm. (C and D) Spearman’s correlations of CD8+ with CSF1+ (left), CSF1R+ (middle), or CD163+ (right) cells displayed per tumor region (C) or per patient (D). Dashed lines indicate log-log correlation (C) or linear regression (D). Data are from primary melanomas and melanoma skin metastases of the patients listed in table S1. (E) Matrix of scatterplots showing correlations between CD8A, CD8B, CSF1, CSF1R, CD68, and CD163 gene expression in the SKCM metastatic cohort (n = 369) of TCGA (46). Correlation was assessed using Spearman’s correlation coefficient. Red lines indicate the local regression (LOESS) fit. P, P value; n, number of samples; rho, Spearman’s correlation coefficient.
Fig. 3
Fig. 3. CSF1 is expressed in human melanoma
(A) Representative multiplexed fluorescence staining images of tumor tissue from one melanoma patient (LAU1283) stained with 4′,6-diamidino-2-phenylindole (DAPI) (blue) and antibodies against S100 (green) or CSF1 (red). The red square in the upper panel indicates a region of interest that has been magnified in the lower panels. Scale bar, 100 μm. (B) Percentage of S100+ melanoma cells that are also CSF1+ in primary melanomas (n = 4) and melanoma metastases (n = 4) from the patients listed in table S1. Each data point represents the average (means ± SEM) of three to five images per tumor area for each patient. S1 to S3 indicate three individual specimens from patient LAU1283 (details are provided in table S1).
Fig. 4
Fig. 4. CSF1 secretion by melanoma cells is induced by CTL-derived cytokines
(A) Experimental setup of the coculture study analyzed in (B) and (F) to (H). Cocultures were established at a 1:1 CTL/melanoma cell ratio, unless stated otherwise. (B) Co-culture experiments. CSF1 protein concentration in supernatants of melanoma cell lines after 24 hours of culture alone or in the presence of MelanA- or yellow fever virus (YF)–specific CTLs, quantified by ELISA. Four melanoma cell lines are shown. Data are means ± SD; three independent cell cultures per cell line are shown, except for T1015A, of which four independent cell cultures were analyzed for melanoma cells cultured alone or with MelanA-specific CTLs. (C and D) Transwell experiments. CSF1 expression was analyzed by flow cytometry in the melanoma cells indicated by the symbol ⊕ after 48 hours of culture with the indicated CTLs (n = 3). Pore size of the filter was 0.4 μm, allowing soluble factors to pass but not cell migration between the top and bottom chamber. MFI, median fluorescence intensity. (E) CSF1 concentration in supernatant of six different melanoma cell lines after 48 hours of culture alone, in the presence of IFNγ, TNFα, or both, quantified by ELISA. Data represent the mean of two independent cell cultures per cell line. (F) Log2-transformed, normalized ex pression value of CSF1 mRNA in melanoma cells after 24 hours of the indicated treatment, quantified by NanoString. Data are means ± SD, except for T1185B, of which two independent cell cultures were analyzed for melanoma cells cocultured with MelanA- or YF-specific CTLs. (G and H) Concentration of CSF1 (G) or IFNγ (H) determined by ELISA in supernatants of Me275 melanoma cells cultured as indicated for 6 to 72 hours. Data represent the mean of two independent cell cultures. (I) Matrix of scatter-plots showing correlations between the expression of CSF1, IFNG, and TNF genes in the SKCM metastatic cohort (n = 369) of TCGA (46). Spearman’s correlation coefficients are indicated, and the red lines show the local regression (LOESS) fit. P, P value; n, number of samples; rho, Spearman’s correlation coefficient. Statistical analysis by one-way analysis of variance (ANOVA) (B to D and F) or two-way ANOVA (E, G, and H) with correction for multiple comparisons by post hoc Tukey’s test (B to H) and Geisser-Greenhouse correction (C and D). ***P < 0.001; **P < 0.01; *P < 0.05.
Fig. 5
Fig. 5. Markers of CD8+ T cells and TAMs correlate with response to PD1 blockade in human melanoma
(A) Enrichment of melanoma-derived macrophage-specific transcriptional signature from (55) in CD8AHigh versus CD8ALow melanomas of the SKCM metastatic cohort (n = 369) (46). Genes are ranked based on mean fold change expression. Error bars indicate 95% confidence interval for each gene. The horizontal dashed line indicates mean fold change of the macrophage signature. Gray region indicates 95% confidence interval of the overall mean fold change. (B) CSF1, CSF1R, CD163, and CD68 expression in responder (n = 15) and nonresponder (n = 13) melanomas to anti-PD1 therapy, obtained from (56). Stratification as CD8AHigh or CD8ALow was performed using the median expression. Statistical analysis by Student’s t test. FPKM, fragments per kilobase of transcript per million mapped reads. (C) Kaplan-Meier estimate of survival in the SKCM metastatic cohort (n = 326, for which survival data were available) of TCGA (46), stratified as (CD8A/CSF1R) ratio high (n = 170) or (CD8A/CSF1R) ratio low (n = 156), using median ratio as cutoff value. The CD8A/CSF1R ratio denotes the numeric difference between log-transformed expression data. P value was obtained using the log-rank test and adjusted for tumor stage.
Fig. 6
Fig. 6. CSF1R blockade enhances the therapeutic efficacy of anti-PD1 treatment in BRAFV600E-driven transplant melanoma models
(A) Tumor volumes of subcutaneous SM1-OVA melanomas treated as indicated. IgG (n = 9), α-CSF1R (n = 9), α-PD1 (n = 9), and α-CSF1R + α-PD1 (n = 10). Arrows indicate start of treatment. (B) SM1-OVA tumor volumes (means ± SEM), measured at day 17 after tumor inoculation. Each dot represents one tumor. Statistical analysis by one-way ANOVA with Tukey’s correction for multiple comparisons. (C) Number of tumor-free and SM1-OVA tumor-bearing mice on day 17 after tumor inoculation. (D) Percentage of MRC1+ (M2-like) TAMs (means ± SEM) at day 20 after tumor inoculation, determined by flow cytometry of whole tumor-derived cells. Each dot represents one tumor. Flow cytometric analysis was performed on tumors selected for having a comparable size (only the smaller tumors in the IgG and CSF1R were analyzed) from the experiment shown in (A). IgG (n = 5), α-CSF1R (n = 5), and α-PD1 (n = 4). Note that tumors in the combination group could not be analyzed because they had fully regressed by day 20. Statistical analysis by one-way ANOVA with Fisher’s least significant difference (LSD) test. (E) Percentage of splenic CD8+ or CD4+ T cells (means ± SEM) determined by flow cytometry. IgG (n = 5), α-CSF1R (n = 5), α-PD1 (n = 7), and α-CSF1R + α-PD1 (n = 4). Flow cyto-metric analysis was performed on spleen from mice also used in (D). For the α-PD1 group, three additional spleens from mice whose tumors had regressed were used to exclude differences between tumor-free and tumor-bearing mice. Each dot represents one spleen. Statistical analysis by one-way ANOVA with Tukey’s correction for multiple comparisons. (F) qPCR analysis of Adgre1 (F4/80), Mrc1 (CD206), and Ifng from whole tumor lysates. Data indicate mean fold change values ± SEM over the reference sample (IgG) after normalization to the average of Hprt and Gapdh housekeeping genes. IgG (n = 5) and α-CSF1R (n = 6 to 7). Each dot represents one tumor; qPCR analysis was performed on tumors with similar size from the experiment shown in (A). Statistical analysis by Student’s t test. (G) Tumor volumes of subcutaneous Yummer1.7 melanomas treated as indicated. IgG (n = 14), α-CSF1R (n = 14), α-PD1 (n = 14), and α-CSF1R + α-PD1 (n = 14). Arrows indicate start of treatment. (H) Survival of mice bearing Yummer1.7 melanomas; the mice were euthanized when the tumors reached a volume of 1000 mm3. The arrow indicates the last treatment. Statistical analysis by log-rank test. (I) qPCR analysis of Adgre1 (F4/80), Mrc1 (CD206) and Ifng expression in lysates of Yummer1.7 melanomas treated as indicated and analyzed at termination (between day 30 and day 42 after tumor challenge). Data indicate mean fold change values ± SEM over the reference sample (IgG) after normalization to the average of Hprt and Gapdh housekeeping genes. For qPCR, we analyzed tumors of the first six mice that reached the termination endpoint (1000 mm3) in the experiment shown in (G). IgG (n = 5 to 6) and α-CSF1R (n = 6). Each dot represents one tumor. Statistical analysis by Student’s t test. ****P < 0.0001; ***P < 0.001; **P < 0.01; *P < 0.05.
Fig. 7
Fig. 7. Differences in the tumor microenvironment between transplant and transgenic BRAFV600E-driven melanoma models may underlie refractoriness of iBIP2 tumors to immunotherapy
(A) Mean change of tumor volume (±SEM; versus tumor volume at treatment start) in iBIP2 mice treated as indicated. IgG (n = 5), α-CSF1R (n = 7), α-PD1 (n = 8), and α-CSF1R + α-PD1 (n = 18). Statistical analysis by linear mixed modeling, showing no statistically significant interaction effect between time and treatment as predictors of tumor volume fold change. (B) Percentage of F4/80+ and MRC1+ (M2-like) TAMs (means ± SEM) in iBIP2 tumors treated as indicated and analyzed by flow cytometry. IgG (n = 5) and α-CSF1R + α-PD1 (n = 5). Each dot represents one tumor; the analysis was performed on tumors with similar size from the experiment shown in (A). Statistical analysis by Student’s t test. No statistically significant differences were observed. (C) qPCR analysis of Adgre1 (F4/80) and Mrc1 (CD206) in lysates of iBIP2 tumors treated as indicated. Data represent mean fold change values ± SEM over the reference sample (IgG) after normalization to the average of Hprt and Gapdh housekeeping genes. IgG (n = 6) and α-CSF1R + α-PD1 (n = 6). Each dot represents one tumor; the analysis was performed on tumors with similar size from the experiment shown in (A). Statistical analysis by Student’s t test. No statistically significant differences were observed. (D) Percentage of CD45+ hematopoietic cells, F4/80+ TAMs, Ly6C+ monocytes and mo-MDSCs, Ly6G+ neutrophils and gr-MDSCs, and CD11b non-myeloid cells (means ± SEM) in iBIP2 and SM1-OVA tumors treated with control IgGs and analyzed by flow cytometry. iBIP2 (n = 5) and SM1-OVA (n = 5). Statistical analysis by Student’s t test. (E) qPCR analysis of Csf1, Ccl2, Il4, Cxcl12 (SDF1), Cxcl1, and Csf2 [granulocyte-macrophage CSF (GM-CSF)] in lysates of iBIP2, SM1-OVA, and Yummer1.7 tumors treated with control IgGs. Data represent mean fold change ± SEM over the reference sample (IgG control-treated iBIP2 tumors) after normalization to the average of Hprt and Gapdh housekeeping genes. iBIP2 (n = 5 to 6), SM1-OVA (n = 4 to 5), and Yummer1.7 (n = 4 to 6). Statistical analysis by one-way ANOVA with Fisher’s LSD test. *P < 0.05; **P < 0.01; ***P < 0.001; ****P < 0.0001.

References

    1. Biswas SK, Mantovani A. Macrophage plasticity and interaction with lymphocyte subsets: Cancer as a paradigm. Nat Immunol. 2010;11:889–896. - PubMed
    1. Erdag G, Schaefer JT, Smolkin ME, Deacon DH, Shea SM, Dengel LT, Patterson JW, Slingluff CL., Jr Immunotype and immunohistologic characteristics of tumor-infiltrating immune cells are associated with clinical outcome in metastatic melanoma. Cancer Res. 2012;72:1070–1080. - PMC - PubMed
    1. Gabrilovich DI, Ostrand-Rosenberg S, Bronte V. Coordinated regulation of myeloid cells by tumours. Nat Rev Immunol. 2012;12:253–268. - PMC - PubMed
    1. Balkwill FR, Mantovani A. Cancer-related inflammation: Common themes and therapeutic opportunities. Semin Cancer Biol. 2012;22:33–40. - PubMed
    1. Mantovani A, Sica A. Macrophages, innate immunity and cancer: Balance, tolerance, and diversity. Curr Opin Immunol. 2010;22:231–237. - PubMed

Publication types