. 2018 Jun 13;92(13):e02203-17.
doi: 10.1128/JVI.02203-17. Print 2018 Jul 1.

Developing and Evaluating Inhibitors against the RNase H Active Site of HIV-1 Reverse Transcriptase

Affiliations

Developing and Evaluating Inhibitors against the RNase H Active Site of HIV-1 Reverse Transcriptase

Paul L Boyer et al. J Virol. .

Abstract

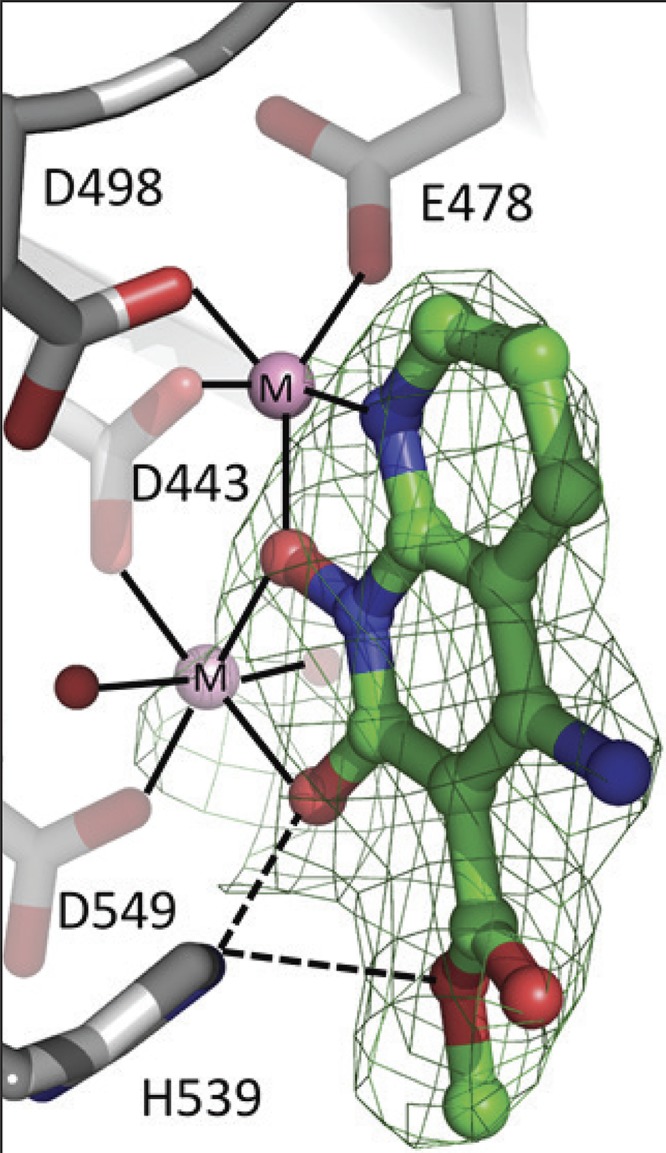
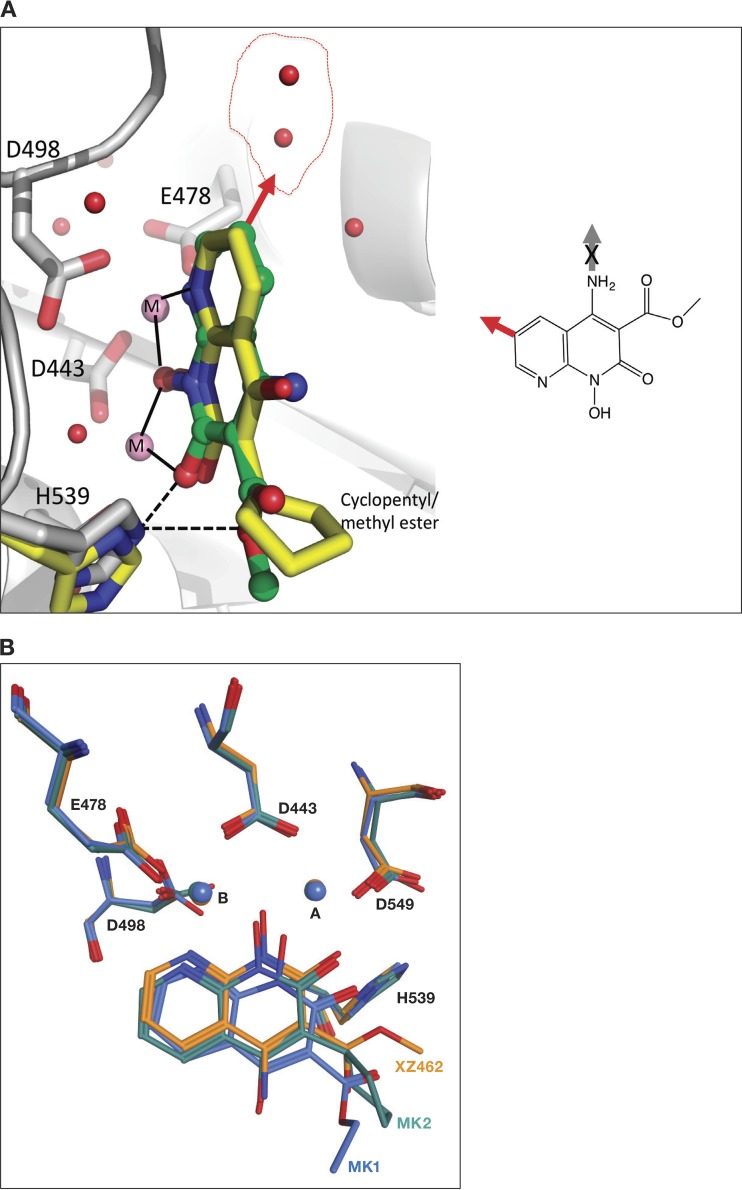
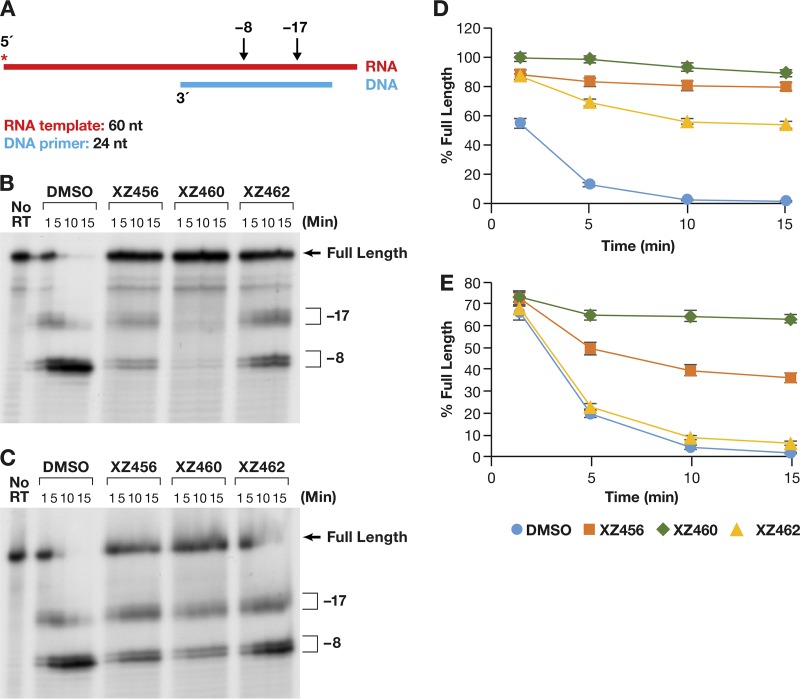
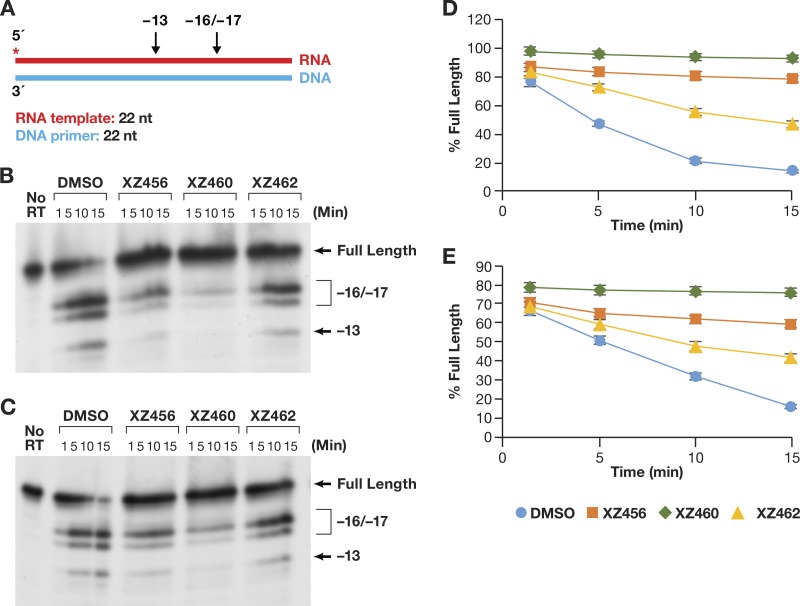
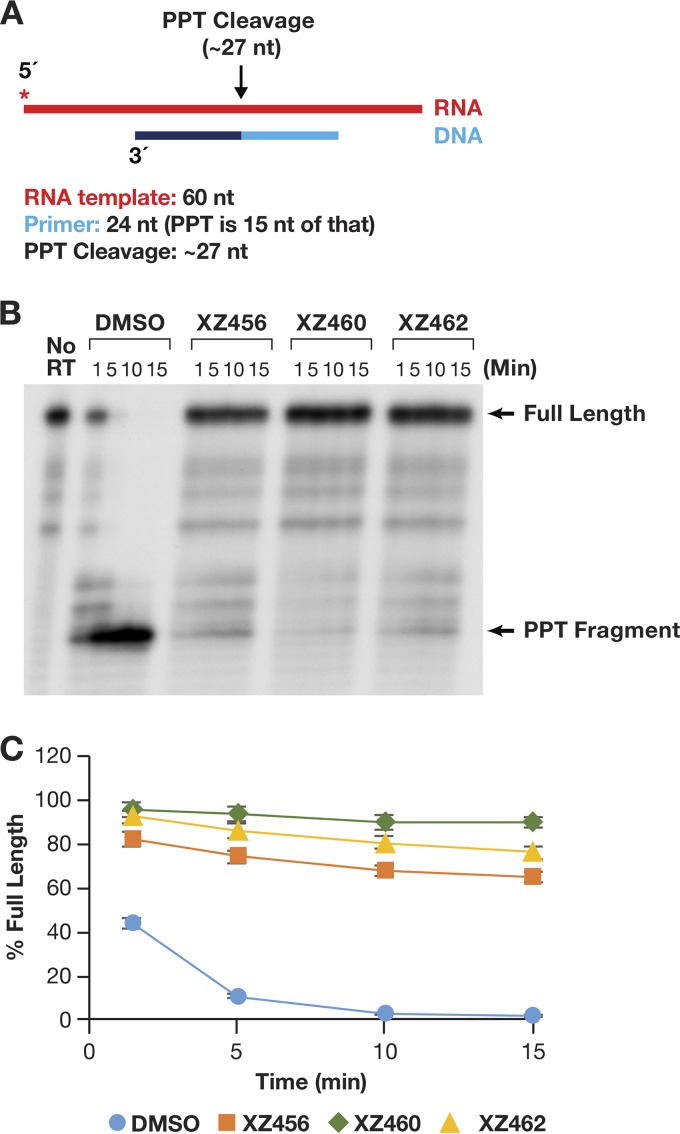
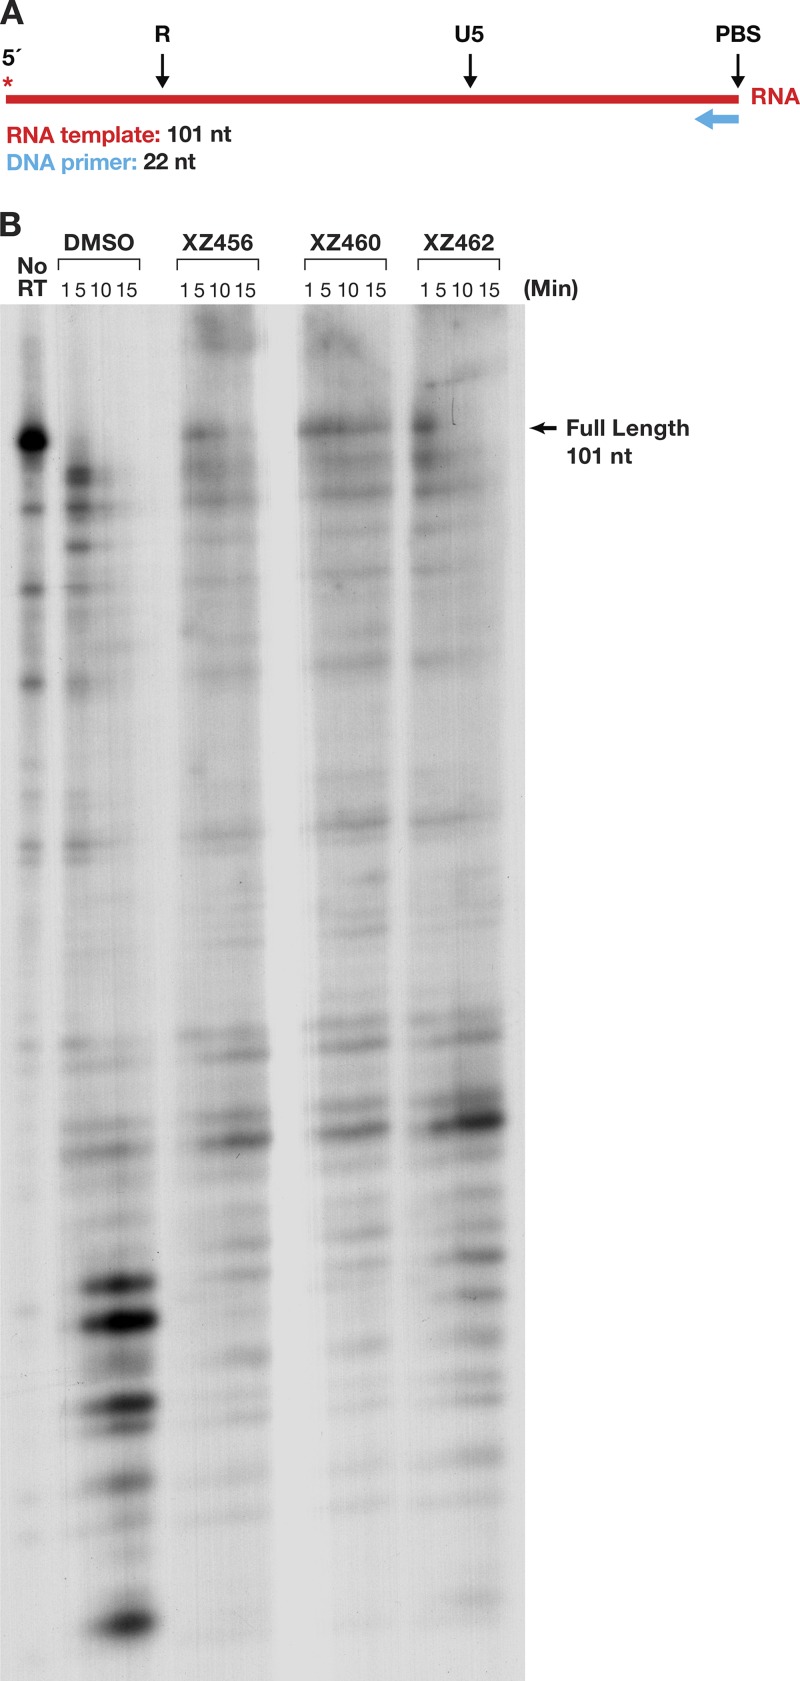
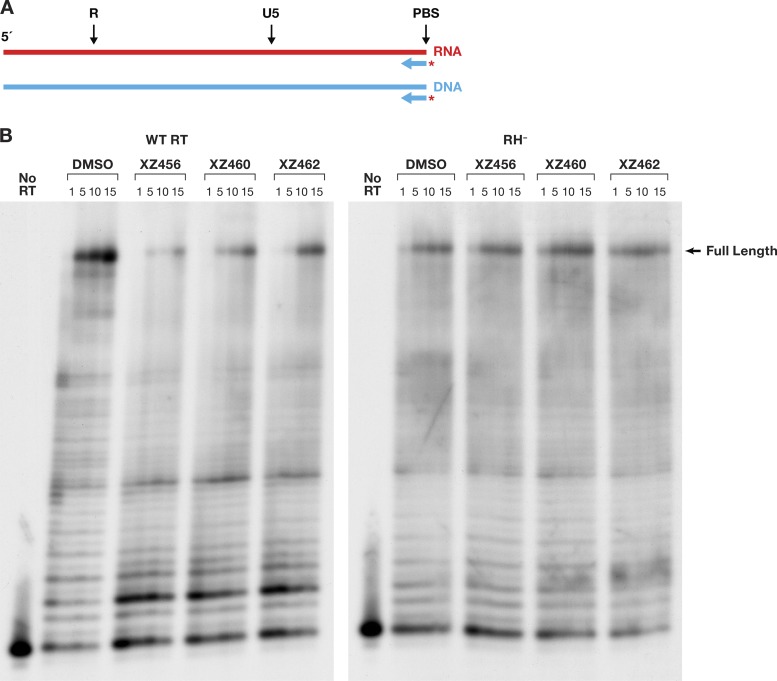
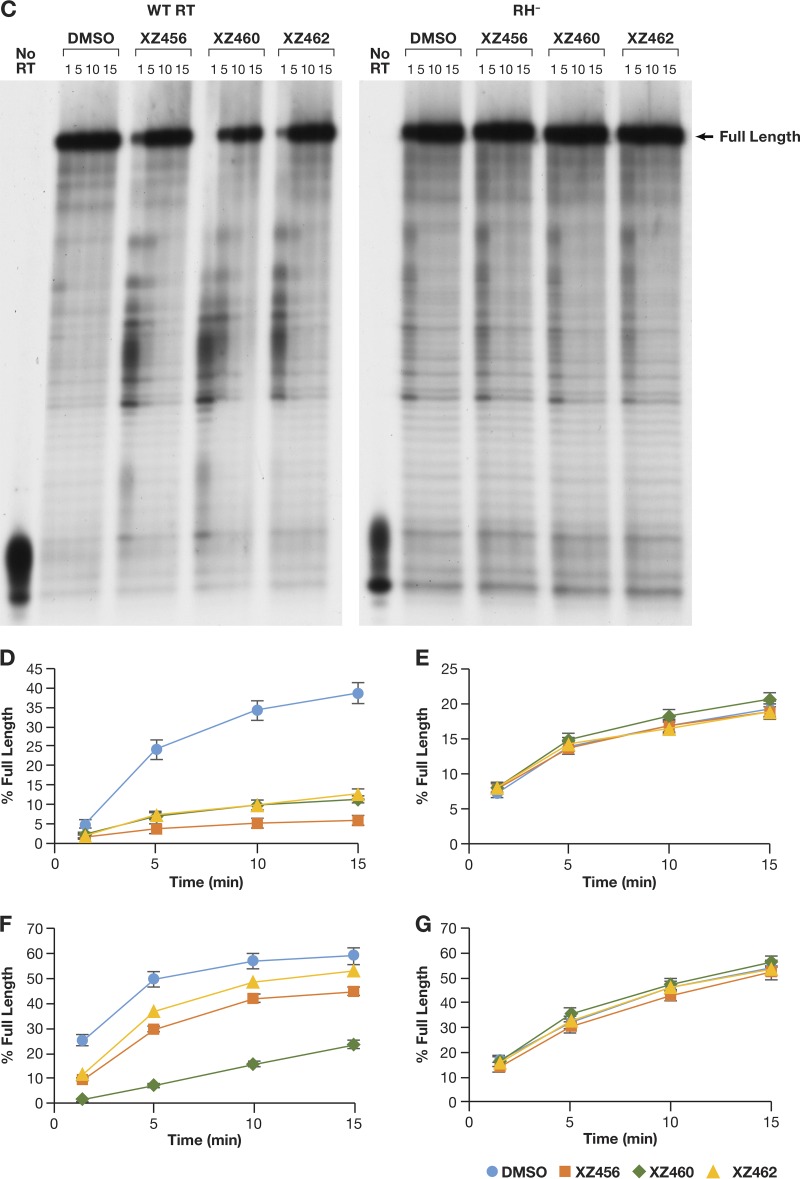
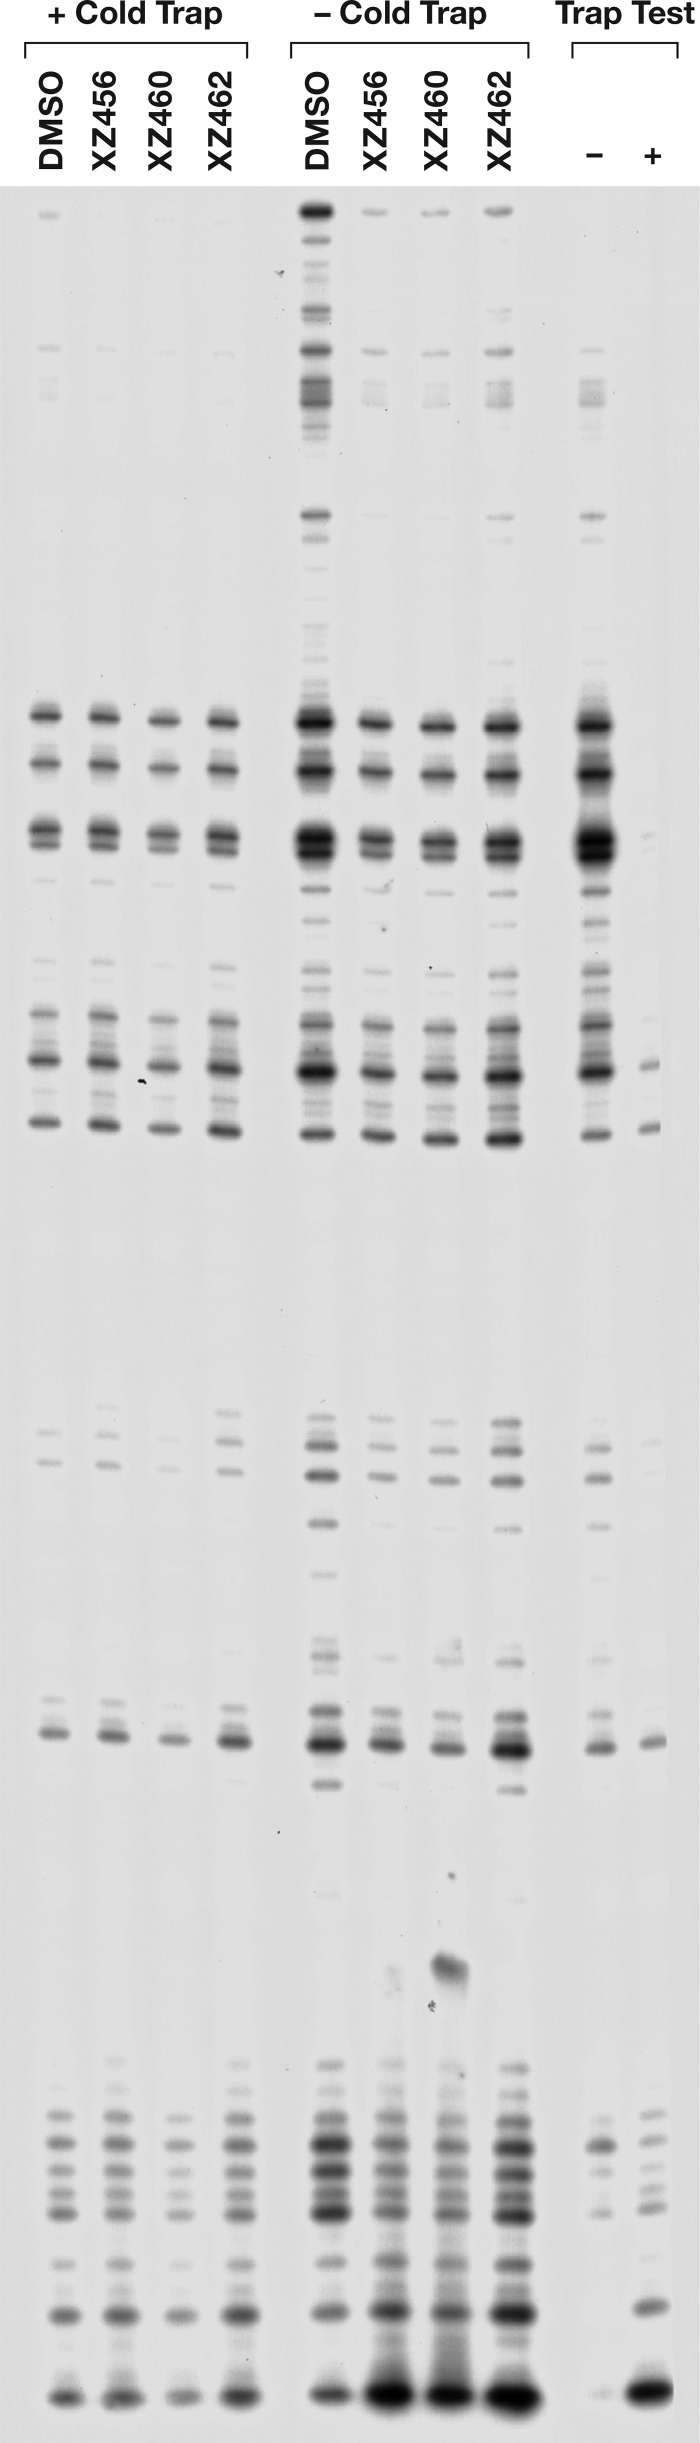
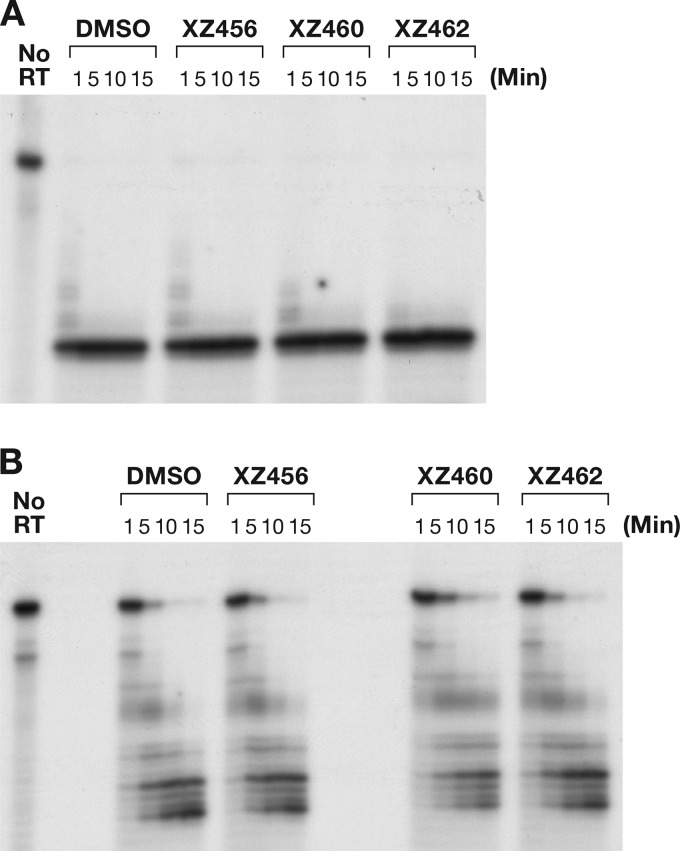
We tested three compounds for their ability to inhibit the RNase H (RH) and polymerase activities of HIV-1 reverse transcriptase (RT). A high-resolution crystal structure (2.2 Å) of one of the compounds showed that it chelates the two magnesium ions at the RH active site; this prevents the RH active site from interacting with, and cleaving, the RNA strand of an RNA-DNA heteroduplex. The compounds were tested using a variety of substrates: all three compounds inhibited the polymerase-independent RH activity of HIV-1 RT. Time-of-addition experiments showed that the compounds were more potent if they were bound to RT before the nucleic acid substrate was added. The compounds significantly inhibited the site-specific cleavage required to generate the polypurine tract (PPT) RNA primer that initiates the second strand of viral DNA synthesis. The compounds also reduced the polymerase activity of RT; this ability was a result of the compounds binding to the RH active site. These compounds appear to be relatively specific; they do not inhibit either Escherichia coli RNase HI or human RNase H2. The compounds inhibit the replication of an HIV-1-based vector in a one-round assay, and their potencies were only modestly decreased by mutations that confer resistance to integrase strand transfer inhibitors (INSTIs), nucleoside analogs, or nonnucleoside RT inhibitors (NNRTIs), suggesting that their ability to block HIV replication is related to their ability to block RH cleavage. These compounds appear to be useful leads that can be used to develop more potent and specific compounds.IMPORTANCE Despite advances in HIV-1 treatment, drug resistance is still a problem. Of the four enzymatic activities found in HIV-1 proteins (protease, RT polymerase, RT RNase H, and integrase), only RNase H has no approved therapeutics directed against it. This new target could be used to design and develop new classes of inhibitors that would suppress the replication of the drug-resistant variants that have been selected by the current therapeutics.

Keywords: HIV-1; RNase H; active site inhibitors; magnesium chelating; structure.


Figures

FIG 1
FIG 1
Structures of the compounds. Depiction of the chemical structures of XZ456, XZ460, XZ462, and MK463.
FIG 2
FIG 2
Antiviral activities of XZ456, XZ460, XZ462, and MK463 against HIV-1 vectors that carry well-known INSTI, NNRTI, and NRTI resistance mutations. (A) Graphical representation of the EC50s (μM) of XZ456, XZ460, XZ462, and MK463 against WT HIV-1 and several INSTI-, NNRTI-, and NRTI-resistant mutants, represented in different colors. The EC50s were measured using a single-round infection assay. Error bars represent standard deviations of results of independent experiments, n = 4. (B) Table showing the numerical values of the EC50s ± standard deviations.
FIG 3
FIG 3
Cytotoxicities of XZ456, XZ460, XZ462, and MK463. (A) Graphical representation of the cellular cytotoxicities of XZ456, XZ460, XZ462, and MK463. The CC50 values (μM) of the compounds were measured by monitoring the ATP levels in HOS cells. Error bars represent standard deviations of results of independent experiments, n = 4. (B) Table showing the numerical values of cellular cytotoxicities of the compounds ± standard deviations.
FIG 4
FIG 4
Relative position of XZ462 in the RNase H active site of HIV-1 RT, showing contacts with residue H539. The crystal structure of XZ462 bound to the RNase H active site of HIV-1 RT shows the contacts made between XZ462 (green) and the RNase H active site residues (gray). The chelating motif of the hydroxylnaphthyridine scaffold binds the magnesium ions (shown in pink), while the methyl ester group of XZ462 forms a hydrogen bond with H539 of HIV-1 RT. Several ordered H2O molecules are shown in red.
FIG 5
FIG 5
Superposing the crystal structures of XZ462 and MK2 in the RNase H active site of HIV-1 RT. (A) The crystal structures of XZ462 (green) and MK2 (yellow) in the RNase H active site of HIV-1 RT were superposed to show the different contacts between the inhibitor and residues that comprise HIV-1 RT RNase H active site and how the chelating motif interacts with the two magnesium ions (pink). Superposing both structures revealed that XZ462 (green) forms a hydrogen bond interaction with HIV-1 RT H539 (gray); MK2 (yellow) does not interact with its respective H539 (yellow). The chemical structure of XZ462 is shown in the inset. It is flipped relative to the structure shown in Fig. 1. The red arrow pointing from the 6′ position of the XZ462 pharmacophore indicates sites where modifications could be made. The red arrow in the larger figure represents the same 6′ position and indicates where modifications could be made based on the contacts with water (depicted as red spheres inside the red circle). (B) Comparison of the binding contacts of XZ462, MK1, and MK2 in the HIV-1 RT RH active site. The crystal structures of XZ462 (orange), MK1 (blue), and MK2 (green) in their respective HIV-RT RH active sites were superposed. HIV-1 RT RH active site residues D443, E478, D498, and D549, as well as H539 and the magnesium ions A and B, are also shown.
FIG 6
FIG 6
Effects of the compounds on RH cleavage (3′-end-directed cleavage). (A) Overall structure of the template/primer (T/P) used for the DNA 3′-end-directed RH assay. Red, RNA; blue, DNA. The asterisk indicates the 32P end label. The locations of the RH cleavages shown in the figure are indicated above the nucleic acid. (B) Cleavages when RT and compounds were allowed to interact before the T/P was added. The control lane (no RT) indicates the size of the intact, full-length RNA. The DMSO lanes had no inhibitor present, while the other lanes had a 10.0 μM concentration of the indicated compound in the reaction. The sizes of the cleavage fragments are based on their distance from the 3′ end of the DNA oligonucleotide located at the polymerase active site. −17 is approximately the distance (in bp) between the polymerase active site and the RH active site. (C) Cleavages when compounds and T/P were mixed together first and the addition of RT was used to initiate the reaction. (D) Graphic representation of the Phosphoimager data of the RH cleavage fragments in panel B. The amount of the full-length RNA template present at a given time was measured as a percentage of the total amount of cleaved and uncleaved RNA in the reaction. For all of the polymerase-independent RH assays, the same amount of T/P and the same amount of RT was used, allowing direct comparisons to be made among the various assays. Differences in the extent of cleavage depends only on how well the RT can bind to the T/P and how well RH is able to cleave the RNA. The error bars represent standard deviations of results of individual experiments as calculated by Excel. n = 3. (E) Graphic representation of the Phosphoimager data of the RH cleavage fragments in panel C. The assay is similar to the assay described for panel D, except that the compounds and T/P are mixed together first. The reaction was initiated by the addition of the RT, so that the compounds and T/P competed for binding to RT. The error bars represent standard deviations of results of individual experiments as calculated by Excel. n = 3.
FIG 7
FIG 7
Effects of the compounds on RH cleavage (5′-end-directed cleavage). (A) Overall structure of the template/primer (T/P) used for the RNA 5′-end-directed RH assay. Red, RNA; blue, DNA. The asterisk indicates the 32P end label. The locations of the RH cleavages shown in the figure are indicated above the nucleic acid. (B) Cleavages when RT and compounds were allowed to interact before the T/P was added. The control lane (no RT) indicates the size of the intact, full-length RNA. The DMSO lanes had no inhibitor present, while the other lanes had a 10.0 μM concentration of the indicated compound in the reaction. The sizes of the cleavage fragments are based on their distance from the 5′ end of the RNA oligonucleotide located at the polymerase active site. −17 is approximately the distance (in bp) between the polymerase active site and the RH active site. (C) Cleavages when compounds and T/P were mixed together first and the addition of RT was used to initiate the reaction. (D) Graphic representation of the Phosphoimager results from panel B. The error bars represent standard deviations of results of individual experiments as calculated by Excel. n = 3. (E) Graphic representation of the Phosphoimager data from panel C. The error bars represent standard deviations of results of individual experiments as calculated by Excel. n = 3.
FIG 8
FIG 8
Effects of the compounds of RH cleavage (internal cleavage substrate). (A) Overall structure of the template/primer (T/P) used for the internal RH assay. Red, RNA; blue, DNA. The asterisk indicates the 32P end label. The location of the RH cleavages shown in the figure are indicated above the nucleic acid. (B) Cleavages when RT and compounds were allowed to interact before the T/P was added. The control lane (no RT) indicates the size of the intact, full-length RNA. The DMSO lanes had no inhibitor present, while the other lanes had a 10.0 μM concentration of the indicated compound in the reaction. The sizes of the cleavage fragments are based on their distance from the 3′ end of the DNA oligonucleotide located at the polymerase active site. −17 is approximately the distance (in bp) between the polymerase active site and the RH active site. (C) Cleavages when compounds and T/P were mixed together first and the addition of RT was used to initiate the reaction. (D) Graphic representation of the Phosphoimager data from panel B. The error bars represent standard deviations of results of individual experiments as calculated by Excel. n = 3. (E) Graphic representation of the Phosphoimager data from panel C. The error bars represent standard deviations of results of individual experiments as calculated by Excel. n = 3.
FIG 9
FIG 9
Effects of the compounds on RH cleavage (PPT substrate). (A) Overall structure of the template/primer (T/P) used for the PPT assay. Red, RNA; dark and light blue, DNA (the PPT region is dark blue). The asterisk indicates the 32P end label. The locations of the RH cleavages shown in the figure are indicated above the nucleic acid. (B) Cleavage products produced in the presence and absence of the compounds. The control lane (no RT) indicates the size of the intact, full-length RNA. The DMSO lanes had no inhibitor present, while the other lanes had a 10.0 μM concentration of the indicated compound in the reaction. The location of the PPT fragment is shown. (C) Graphic representation of the Phosphoimager data for the PPT substrate (see the text). The amount of full-length product was calculated as a percentage of the total amount of RNA in the assay. The error bars represent standard deviations of results of individual experiments as calculated by Excel. n = 3.
FIG 10
FIG 10
Effects of the compounds and polymerization on RH cleavages. (A) Template/primer (T/P) used for the polymerase-dependent RH assay. Red, RNA; blue, DNA. The asterisk indicates the 32P end label. (B) RH cleavages made when the RT was polymerizing (polymerase-dependent RH activity). The control lane (no RT) indicates the size of the intact, full-length RNA. The DMSO lanes had no inhibitor present, while the other lanes had a 10.0 μM concentration of the indicated compound in the reaction.
FIG 11
FIG 11
Effects of the compounds on polymerization on RNA and DNA templates. (A) T/Ps used for the polymerization assays. The long DNA and RNA templates have identical sequences and are identical in sequence to the template in Fig. 10A. The asterisk indicates the 32P end label. (B) RDDP assays done in the presence or absence of the compounds. The WT RT is shown on the left, while the RH RT is on the right. “Full-length” indicates the extension of the primer to the end of the RNA template. The control lane (no RT) indicates the size of the DNA primer. The DMSO lanes had no inhibitor present, while the other lanes had a 10.0 μM concentration of the indicated compound in the reaction. (C) The assays are similar to those in panel B, except that the template is DNA (DDDP assay). (D) Graphic representation of the Phosphoimager data for the RNA-dependent DNA polymerase (RDDP) assay using the WT RT (panel B). The error bars represent standard deviations of results of individual experiments as calculated by Excel. n = 3. (E) Graphic representation of the Phosphoimager data for the RDDP assay using the RH RT (D443A D549A) (panel B). The error bars represent standard deviations of results of individual experiments as calculated by Excel. n = 3. (F) Graphic representation of the Phosphoimager data for the DNA-dependent DNA polymerase (DDDP) assay using the WT RT (panel C). The DNA template has the same sequence as the RNA template. The error bars represent standard deviations of results of individual experiments as calculated by Excel. n = 3. (G) Graphic representation of the Phosphoimager data for the DNA-dependent DNA polymerase (DDDP) assay using the RH RT (panel C). The error bars represent standard deviations of results of individual experiments as calculated by Excel. n = 3.
FIG 11
FIG 11
Effects of the compounds on polymerization on RNA and DNA templates. (A) T/Ps used for the polymerization assays. The long DNA and RNA templates have identical sequences and are identical in sequence to the template in Fig. 10A. The asterisk indicates the 32P end label. (B) RDDP assays done in the presence or absence of the compounds. The WT RT is shown on the left, while the RH RT is on the right. “Full-length” indicates the extension of the primer to the end of the RNA template. The control lane (no RT) indicates the size of the DNA primer. The DMSO lanes had no inhibitor present, while the other lanes had a 10.0 μM concentration of the indicated compound in the reaction. (C) The assays are similar to those in panel B, except that the template is DNA (DDDP assay). (D) Graphic representation of the Phosphoimager data for the RNA-dependent DNA polymerase (RDDP) assay using the WT RT (panel B). The error bars represent standard deviations of results of individual experiments as calculated by Excel. n = 3. (E) Graphic representation of the Phosphoimager data for the RDDP assay using the RH RT (D443A D549A) (panel B). The error bars represent standard deviations of results of individual experiments as calculated by Excel. n = 3. (F) Graphic representation of the Phosphoimager data for the DNA-dependent DNA polymerase (DDDP) assay using the WT RT (panel C). The DNA template has the same sequence as the RNA template. The error bars represent standard deviations of results of individual experiments as calculated by Excel. n = 3. (G) Graphic representation of the Phosphoimager data for the DNA-dependent DNA polymerase (DDDP) assay using the RH RT (panel C). The error bars represent standard deviations of results of individual experiments as calculated by Excel. n = 3.
FIG 12
FIG 12
Effects of the compounds on polymerization in the presence of a cold trap. For each reaction, RT was allowed to bind to the T/P for 5 min in the reaction mixture. The reaction was initiated by the addition of a mixture containing dNTPs, the compound to be tested (10.0 μM in the final reaction buffer, or an equal volume of DMSO for the control lane), and either poly(rC)-oligo(dG) for the “+ trap” reactions or an equal volume of water for the “− trap” reactions. In the “Trap Test,” allowing the cold trap to bind to the RT before addition of the labeled T/P (+ lane) caused a marked reduction in the extension of the labeled primer compared to when no trap (−) is added. This indicates that the cold trap is able to sequester the RT from the labeled T/P.
FIG 13
FIG 13
The compounds do not affect the cleavage by E. coli RNase HI or human RNase H2. (A) RNA cleavage fragments generated by E. coli RNase HI; (B) fragments generated by human RNase H2.
FIG 14
FIG 14
Scheme 1. Synthesis of compounds XZ456, XZ460, and XZ463. Reagents and conditions were as follows: (i) trifluoromethanesulfonic anhydride, triethylamine (TEA), CH2Cl2, 0°C; (ii) benzidine or 4-aminobiphenyl, N,N-diisopropylethylamine (DIPEA), N,N-dimethylformamide (DMF); (iii) H2, Pd/C (10%), H; (iv) sodium methoxide (NaOMe), MeOH; (v) HBr/HOAc (33%), H2O, 80°C.
FIG 15
FIG 15
Scheme 2. Synthesis of compound XZ462. Reagents and conditions were as follows: (i) BnONH2, DMSO, 120°C; (ii) methyl 3-chloro-3-oxopropanoate, TEA, CH2Cl2; (iii) NaOMe, MeOH; (iv) H2, Pd/C (10%), MeOH.

Similar articles

Cited by

References

    1. Beilhartz GL, Wendeler M, Baichoo N, Rausch J, Le Grice S, Götte M. 2009. HIV-1 reverse transcriptase can simultaneously engage its DNA/RNA substrate at both DNA polymerase and RNase H active sites: implications for RNase H inhibition. J Mol Biol 388:462–474. doi:10.1016/j.jmb.2009.03.025. - DOI - PMC - PubMed
    1. Kirschberg TA, Balakrishnan M, Squires NH, Barnes T, Brendza KM, Chen X, Eisenberg EJ, Jin W, Kutty N, Leavitt S, Liclican A, Liu Q, Liu X, Mak J, Perry JK, Wang M, Watkins WJ, Lansdon EB. 2009. RNase H active site inhibitors of human immunodeficiency virus type 1 reverse transcriptase: design, biochemical activity, and structural information. J Med Chem 52:5781–5784. doi:10.1021/jm900597q. - DOI - PubMed
    1. Beilhartz GL, Götte M. 2010. HIV-1 ribonuclease H: structure, catalytic mechanism and inhibitors. Viruses 2:900–926. doi:10.3390/v2040900. - DOI - PMC - PubMed
    1. Beilhartz GL, Ngure M, Johns BA, DeAnda F, Gerondelis P, Götte M. 2014. Inhibition of the ribonuclease H activity of HIV-1 reverse transcriptase by GSK5750 correlates with slow enzyme-inhibitor dissociation. J Biol Chem 289:16270–16277. doi:10.1074/jbc.M114.569707. - DOI - PMC - PubMed
    1. Cao L, Song W, De Clercq E, Zhan P, Liu X. 2014. Recent progress in the research of small molecule HIV-1 RNase H inhibitors. Curr Med Chem 21:1956–1967. doi:10.2174/0929867321666140120121158. - DOI - PubMed

Publication types

MeSH terms

LinkOut - more resources