. 2018 Jun 13;92(13):e00220-18.
doi: 10.1128/JVI.00220-18. Print 2018 Jul 1.

Kaposi's Sarcoma-Associated Herpesvirus mRNA Accumulation in Nuclear Foci Is Influenced by Viral DNA Replication and Viral Noncoding Polyadenylated Nuclear RNA

Affiliations

Kaposi's Sarcoma-Associated Herpesvirus mRNA Accumulation in Nuclear Foci Is Influenced by Viral DNA Replication and Viral Noncoding Polyadenylated Nuclear RNA

Tenaya K Vallery et al. J Virol. .

Abstract

Kaposi's sarcoma-associated herpesvirus (KSHV), like other herpesviruses, replicates within the nuclei of its human cell host and hijacks host machinery for expression of its genes. The activities that culminate in viral DNA synthesis and assembly of viral proteins into capsids physically concentrate in nuclear areas termed viral replication compartments. We sought to better understand the spatiotemporal regulation of viral RNAs during the KSHV lytic phase by examining and quantifying the subcellular localization of select viral transcripts. We found that viral mRNAs, as expected, localized to the cytoplasm throughout the lytic phase. However, dependent on active viral DNA replication, viral transcripts also accumulated in the nucleus, often in foci in and around replication compartments, independent of the host shutoff effect. Our data point to involvement of the viral long noncoding polyadenylated nuclear (PAN) RNA in the localization of an early, intronless viral mRNA encoding ORF59-58 to nuclear foci that are associated with replication compartments.IMPORTANCE Late in the lytic phase, mRNAs from Kaposi's sarcoma-associated herpesvirus accumulate in the host cell nucleus near viral replication compartments, centers of viral DNA synthesis and virion production. This work contributes spatiotemporal data on herpesviral mRNAs within the lytic host cell and suggests a mechanism for viral RNA accumulation. Our findings indicate that the mechanism is independent of the host shutoff effect and splicing but dependent on active viral DNA synthesis and in part on the viral noncoding RNA, PAN RNA. PAN RNA is essential for the viral life cycle, and its contribution to the nuclear accumulation of viral messages may facilitate propagation of the virus.

Keywords: DNA replication compartments; KSHV; mRNA localization; nuclear foci; viral noncoding PAN RNA.


Figures

FIG 1
FIG 1
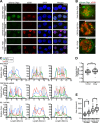
Viral RNAs accumulate at late times in nuclear foci in and near viral replication compartments. Shown are confocal images of TREx RTA BCBL-1 cells that were induced into the lytic phase for 24 h with Doxy. (A) FISH for viral RNAs (green) and IF for viral single-stranded DNA binding protein (ORF6/SSB) (red) revealed that viral transcripts localize in the cytoplasm, nucleus, and nuclear foci outside ORF6/SSB-enriched areas, also known as replication compartments. The white lines flanking cells depict the line path of fluorescence intensities for the FISH and IF signals, plotted in the first column of panel C. αSense, antisense; Unind, uninduced. (B) Digitally enlarged images of the cells in panel A flanked by white lines. For simplicity, the blue DAPI channel was omitted. Scale bars, 10 μm. (C) Plots showing the relative fluorescent intensities for each stain along the same line: αSSB (red), a viral transcript (indicated on the plot) (green), and DAPI (blue). The shaded areas indicate DAPI-reduced regions that correspond to viral replication compartments or SSB/ORF6-enriched areas. Line traces for two additional cells for each of the three transcripts are shown. (D) The ratio of nuclear area to cellular area changes, and thus the fluorescence intensity ratio used throughout this study was normalized for area. (E) Nuclear and cellular areas measured for TREx RTA BCBL-1 cells with and without undergoing lytic activation. Statistically significant changes were seen compared to uninduced cells. *, P < 0.05; ***, P < 0.0005.
FIG 2
FIG 2
Host transcript GAPDH does not accumulate in nuclear foci during the KSHV lytic phase. (A) Immunofluorescent staining of BCBL-1 cells treated with 600 μM valproic acid for 24 h showing concentrated nuclear foci of viral transcript K8.1. (B) FISH for host GAPDH mRNA (red) and for the viral lncRNA PAN (green) and DAPI nuclear staining (blue) showing that host GAPDH mRNA does not localize to nuclear foci in lytic cells. (C) Fluorescence intensities along a line (indicated by white lines flanking lytic cells in panel B and Fig. 1A). The shaded areas are as in Fig. 1. (D) Quantification of the fluorescence intensities of cells represented in panel B (n = 150 for each GAPDH sample; n = 75 for the ORF59-58 or K8.1 samples) was performed for three biological replicates (see Materials and Methods). The values for ORF59-58 and K8.1 transcripts were from the experiments shown in Fig. 3 and 4D. ***, P < 0.0005. (E) Representative Northern blot of RNA from TREx RTA BCBL-1 cells 24 h after Doxy treatment.
FIG 3
FIG 3
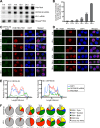
Viral message accumulation in nuclear foci correlates with viral DNA replication. TREx RTA BCBL-1 cells were treated with Doxy and examined at 6 h, 10 h, 14 h, 18 h, 24 h, and 36 h post-lytic induction. The data are from two biological replicates. (A) Northern blot of total RNA collected at the indicated time points showing relative levels of select viral transcripts. Host RNase P RNA, which is not subject to the host shutoff effect, served as the loading control. (B) qPCR of total intracellular viral DNA at the indicated time points, normalized to the promoter region of the host GAPDH gene in four biological replicates, showing that viral DNA replication increases significantly at 18 h. The error bars indicate standard deviations. (C and D) Representative FISH images of the lytic viral PAN RNA (red) and either early, intronless ORF59-58 mRNA (green) (C) or late, spliced K8.1 mRNA (green) (D) at the indicated time points after induction. DAPI staining (blue) was used to visualize the nucleus. (E) Fluorescence intensities along lines drawn on cells (indicated by white lines in panel C). Three additional cells each for the 10-h and 36-h time points are shown in Fig. 4A and B. (F) Cells were categorized for induction into the lytic phase by the presence of PAN RNA and then examined for localization of ORF59-58 or K8.1 transcripts. The cells induced into the lytic phase but with no visible FISH signal for ORF59-58 or K8.1 transcripts were categorized as PAN only. Cells with either ORF59-58 or K8.1 transcripts in the nucleus were categorized as PAN plus nuclear, in the cytoplasm as PAN plus Cyto, and in both compartments as PAN plus both. n, number of cells examined to produce the pie charts.
FIG 4
FIG 4
Semiquantitative analysis revealed late lytic appearance of nuclear foci and widening of the nucleocytoplasmic distribution of viral mRNAs. (A and B) Line traces of four TREx RTA BCBL-1 cells induced with Doxy for 10 h (A) or 36 h (B) and stained with ORF59-58 FISH and PAN RNA FISH, as shown in Fig. 3C. (C) Areas were measured for TREx RTA BCBL-1 cells and nuclei undergoing lytic activation with or without viral DNA replication inhibition. Statistically significant changes were seen compared to uninduced cells. The statistics of the graph are shown in Table 2. (D) Plot of fluorescence intensity ratios for ORF59-58 and K8.1 mRNAs from three biological replicates (n = 75). PAN RNA served as the nuclear control for the calculation. *, P < 0.05; ***, P < 0.0005.
FIG 5
FIG 5
Accumulation of ORF59-58 message in the nucleus depends on viral DNA replication. TREx RTA BCBL-1 cells were treated for 24 h with no drug (Unind), doxycycline only (Doxy), or doxycycline and one inhibitor of herpesviral DNA replication, phosphonoacetic acid (Doxy plus PAA) or cidofovir (Doxy plus Cido). Panels A to C show data from samples collected from three biological replicates. (A) qPCR values for viral intracellular DNA during inhibition of viral DNA replication were normalized to the quantity of promoter DNA of the host cell GAPDH gene. (B) Northern blot (left) and quantification (right) showing total RNA levels during inhibition of viral DNA replication. Uninduced levels of all RNAs were undetectable. The error bars indicate standard deviations. (C) Representative FISH images for viral ORF59-58 transcripts (green) and PAN RNA (red) upon inhibition of viral DNA replication. DAPI (blue) was the nuclear stain. (D) Quantification of the fluorescence intensities of cells represented in panel C (n = 75 each) done on biological triplicates (see Materials and Methods). The quantification controls for changes in area represented in Fig. 7F. (E) Fluorescence intensities along lines drawn across cells (indicated by white lines in panel C). ns, P > 0.05; *, P < 0.05; **, P < 0.005; ***, P < 0.0005.
FIG 6
FIG 6
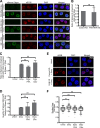
Knockdown of KSHV PAN RNA abolishes focal accumulation of early, intronless ORF59-58 transcript but not of late, spliced K8.1 mRNA, while nuclear accumulation of viral messages is independent of the host shutoff effect. (A and C) TREx RTA BCBL-1 cells were treated for 24 h with no drug (Unind), a control antisense oligonucleotide for GFP and doxycycline (Control KD plus Doxy), or an antisense oligonucleotide for PAN RNA and doxycycline (PAN KD plus Doxy) in biological triplicates. Shown are representative images of cells stained by FISH for viral transcripts encoding ORF59-58 (A) (green) or K8.1 (C) (green) and for PAN RNA in cells (red). (B) Northern blot (right) and quantification (left) of total RNA collected from knockdown samples showing relative levels of select viral transcripts. Host RNase P RNA served as the loading control. The error bars indicate standard deviations. (D) qPCR showing that viral intracellular DNA levels are unaffected upon PAN RNA knockdown. (E and F) Herpesviral DNA replication was inhibited in the same manner as for Fig. 5 by cotreatment with Doxy and one inhibitor of viral DNA replication, either phosphonoacetic acid (Doxy plus PAA) or cidofovir (Doxy plus Cido) (biological triplicates). (E) Representative images of FISH for KSHV PAN RNA and IF for PABP during inhibition of herpesviral DNA replication. (F) Quantification of fluorescence intensity in cells like those shown in panel E (n = 60). ns, P > 0.05; **, P < 0.005.
FIG 7
FIG 7
Accumulation of KSHV messages in nuclear foci appears to be unrelated to splicing. (A) Latent (Unind) and 24-h lytic (Doxy) cells were stained for viral RNA (FISH) and for the host splicing factor, SC35 (IF). (B) Ratio of RT-qPCR values of spliced to unspliced viral K8/K-bZIP RNA normalized to host 18S rRNA following either control or PAN RNA knockdown (KD). The error bars indicate standard deviations. (C and D) RT-qPCR quantification of K8/K-bZIP RNA following viral DNA replication inhibition. Shown are ratios of spliced to unspliced viral K8/K-bZIP RNA (C) and quantities of spliced K8/K-bZIP RNA normalized to host RNase P RNA (D). The amplicon for the spliced K8/K-bZIP transcript spanned the splice junction and shared the same upstream primer as the unspliced amplicon, which spanned the intron. The RT-qPCR values are from biological triplicates. (E) Twenty-four-hour-induced TREx BCBL-1 cells were treated as described for Fig. 6 to knock down KSHV PAN RNA (PAN KD) and then stained for the viral single-stranded DNA binding protein (SSB/ORF6; red) and for the nucleus (DAPI; blue) in biological duplicates. (F) The ratio of nuclear area to cellular area also changes, and thus, the fluorescence intensity ratio used throughout this study was normalized for area (square micrometers). Unind and Doxy values are the same as in Fig. 1D. Doxy plus PAA and Doxy plus Cido correspond to Fig. 5C and D. ns, P > 0.05; ***, P < 0.0005.

Similar articles

Cited by

References

    1. Schmid M, Speiseder T, Dobner T, Gonzalez RA. 2014. DNA virus replication compartments. J Virol 88:1404–1420. doi: 10.1128/JVI.02046-13. - DOI - PMC - PubMed
    1. Dissinger NJ, Damania B. 2016. Recent advances in understanding Kaposi's sarcoma-associated herpesvirus. F1000Res 5:F1000 Faculty-Rev-740. doi: 10.12688/f1000research.7612.1. - DOI - PMC - PubMed
    1. Arias C, Weisburd B, Stern-Ginossar N, Mercier A, Madrid AS, Bellare P, Holdorf M, Weissman JS, Ganem D. 2014. KSHV 2.0: a comprehensive annotation of the Kaposi's sarcoma-associated herpesvirus genome using next-generation sequencing reveals novel genomic and functional features. PLoS Pathog 10:e1003847. doi: 10.1371/journal.ppat.1003847. - DOI - PMC - PubMed
    1. Cai X, Lu S, Zhang Z, Gonzalez CM, Damania B, Cullen BR. 2005. Kaposi's sarcoma-associated herpesvirus expresses an array of viral microRNAs in latently infected cells. Proc Natl Acad Sci U S A 102:5570–5575. doi: 10.1073/pnas.0408192102. - DOI - PMC - PubMed
    1. Pfeffer S, Sewer A, Lagos-Quintana M, Sheridan R, Sander C, Grasser FA, van Dyk LF, Ho CK, Shuman S, Chien M, Russo JJ, Ju J, Randall G, Lindenbach BD, Rice CM, Simon V, Ho DD, Zavolan M, Tuschl T. 2005. Identification of microRNAs of the herpesvirus family. Nat Methods 2:269–276. doi: 10.1038/nmeth746. - DOI - PubMed

Publication types

MeSH terms

LinkOut - more resources