. 2018 Jun 13;92(13):e02100-17.
doi: 10.1128/JVI.02100-17. Print 2018 Jul 1.

Dynamics of Simian Immunodeficiency Virus Two-Long-Terminal-Repeat Circles in the Presence and Absence of CD8+ Cells

Affiliations

Dynamics of Simian Immunodeficiency Virus Two-Long-Terminal-Repeat Circles in the Presence and Absence of CD8+ Cells

Benjamin B Policicchio et al. J Virol. .

Abstract

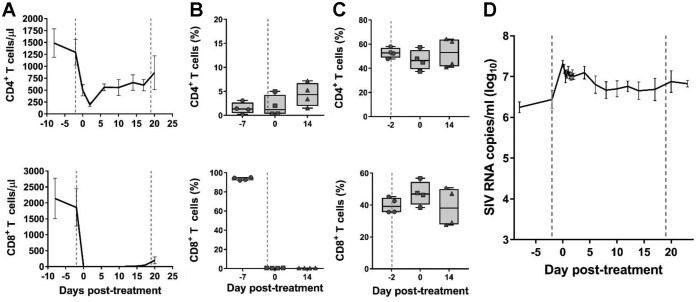
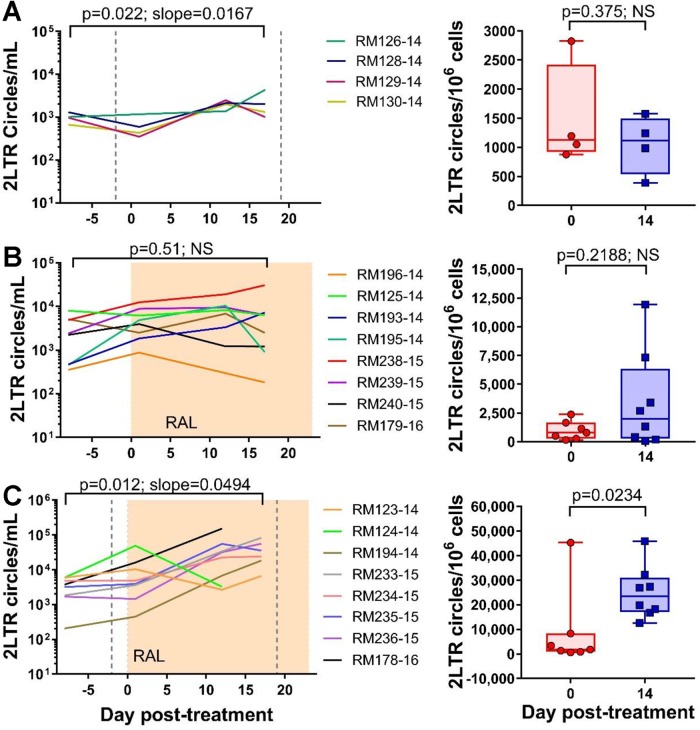
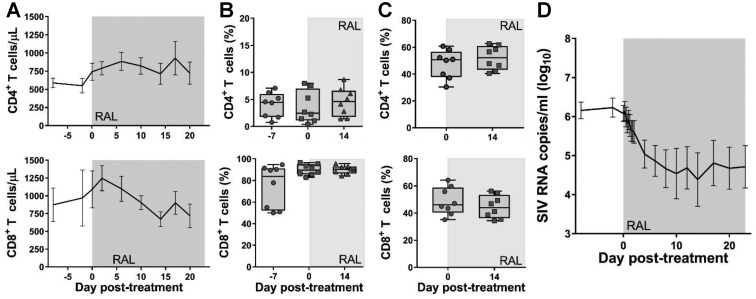
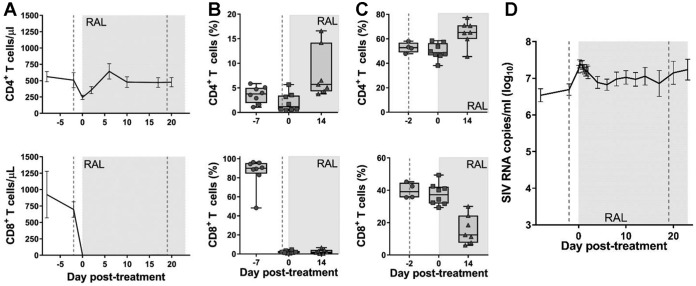
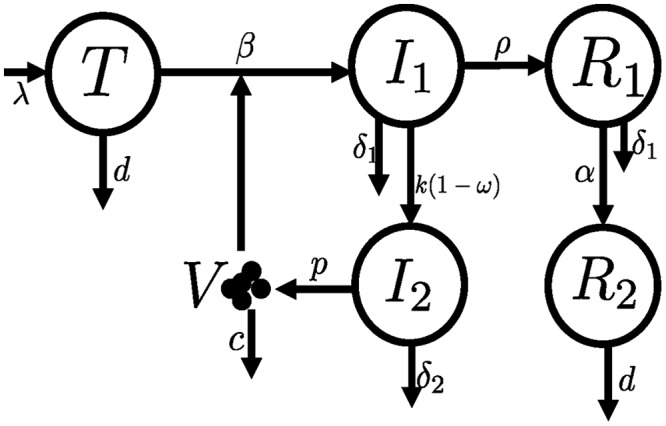
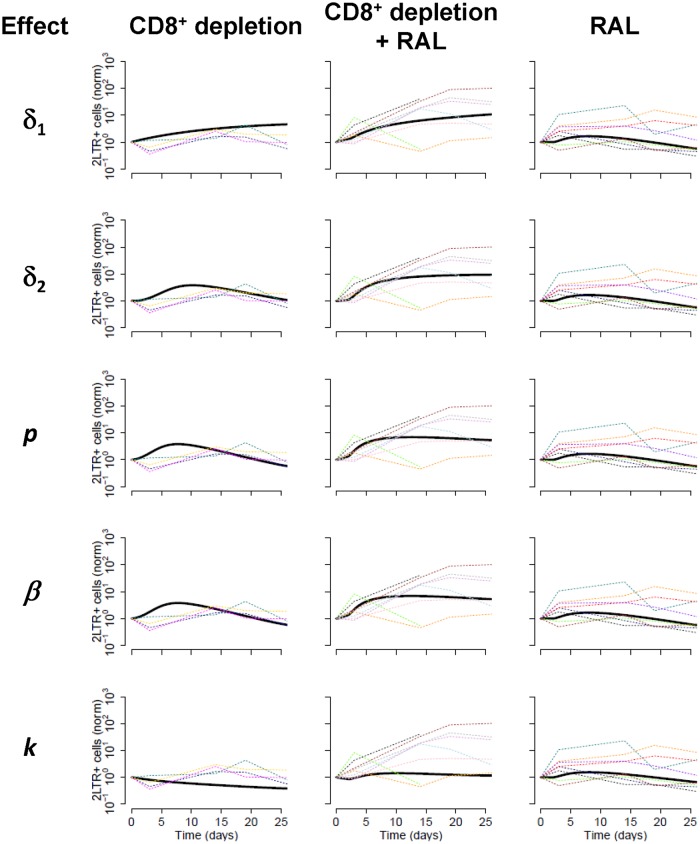
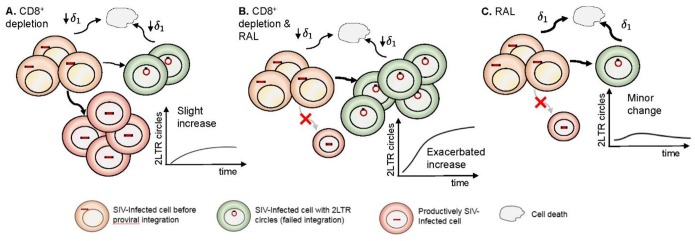
CD8+ cells play a key role in human immunodeficiency virus (HIV)/simian immunodeficiency virus (SIV) infection, but their specific mechanism(s) of action in controlling the virus is unclear. Two-long-terminal-repeat (2-LTR) circles are extrachromosomal products generated upon failed integration of HIV/SIV. To understand the specific effects of CD8+ cells on infected cells, we analyzed the dynamics of 2-LTR circles in SIVmac251-infected rhesus macaques (RMs) treated with an integrase inhibitor (INT). Twenty RMs underwent CD8+ cell depletion and received raltegravir (RAL) monotherapy or a combination of both. Blood, lymph nodes (LNs), and gut biopsy specimens were routinely sampled. Plasma viral loads (pVLs) and 2-LTR circles from peripheral blood mononuclear cells (PBMCs) and LN lymphocytes were measured with quantitative reverse transcription-PCR (qRT-PCR). In the CD8 depletion group, an ∼1-log increase in pVLs and a slow increase in PBMC 2-LTRs occurred following depletion. In the INT group, a strong decline in pVLs upon treatment initiation and no change in 2-LTR levels were observed. In the INT and CD8+ cell depletion group, an increase in pVLs following CD8 depletion similar to that in the CD8 depletion group was observed, with a modest decline following INT initiation, and 2-LTR circles significantly increased in PBMCs and LNs. Analyzing the 2-LTR data across all treatment groups with a mathematical model indicates that the data best support an effect of CD8+ cells in killing cells prior to viral integration. Sensitivity analyses of these results confirm that effect but also allow for additional effects, which the data do not discriminate well. Overall, we show that INT does not significantly increase the levels of 2-LTR circles. However, CD8+ cell depletion increases the 2-LTR levels, which are enhanced in the presence of an INT.IMPORTANCE CD8+ T cells play an essential role in controlling HIV and SIV infection, but the specific mechanisms involved remain poorly understood. Due to failed viral infection, HIV and SIV can form 2-LTR extrachromosomal circles that can be quantified. We present novel data on the dynamics of these 2-LTR forms in a SIV-infected macaque model under three different treatment conditions: depletion of CD8+ cells, administration of the integrase inhibitor in a monotherapy, which favors the formation of 2-LTR circles, and a combination of the two treatments. We used a new mathematical model to help interpret the data, and the results suggest that CD8+ cells exert a killing effect on infected cells prior to virus integration. These results provide new insights into the mechanisms of action of CD8+ cells in SIV infection. Confirmation of our results would be an important step in understanding immune control of HIV.

Keywords: 2-LTR circles; CD8+ cell depletion; integrase inhibitor; raltegravir; rhesus macaques; simian immunodeficiency virus.


Figures

FIG 1
FIG 1
Effects of CD8+ cell depletion alone. The effects of CD8+ cell depletion on CD4+ (first row) and CD8+ (second row) cells in peripheral blood (absolute values) (A), in jejunal biopsy specimens (percentage of CD3+ cells) (B), in superficial LNs (percentage of CD3+ cells) (C), and the plasma viral load (pVL) (D) are shown. Error bars represent standard errors of the mean (SEM). LN data include historical reference values before CD8+ cell depletion (day −2). The vertical dashed lines indicate the times of anti-CD8+ antibody administration.
FIG 2
FIG 2
Effects of CD8 depletion with or without RAL monotherapy on 2-LTR circles in blood and LNs. The left column represents the number of 2-LTR circles per ml of blood, and the right column represents the number of 2-LTR circles per million CCR5+ cells in the lymph nodes. (A) CD8+ cell depletion alone, where the vertical dashed lines represent the times of anti-CD8+ antibody administration; (B) RAL monotherapy alone, where the shaded area represents the period of therapy; (C) CD8+ cell depletion and RAL monotherapy. A linear mixed-effects model was used to analyze the dynamics of 2-LTR in blood and a (paired) Wilcoxon rank sum test was performed to analyze the LN data. NS, nonsignificant.
FIG 3
FIG 3
Effects of RAL monotherapy alone. The effects of RAL monotherapy on CD4+ (first row) and CD8+ (second row) cells in peripheral blood (absolute values) (A), in jejunal biopsy specimens (percentage of CD3+ cells) (B), in superficial LNs (percentage of CD3+ cells) (C), and pVL (D). Error bars represent SEM. The shaded area indicates the period of RAL therapy.
FIG 4
FIG 4
Effects of CD8+ cell depletion and RAL monotherapy. The effects of CD8+ cell depletion and RAL monotherapy on CD4+ (first row) and CD8+ (second row) cells in peripheral blood (absolute values) (A), in jejunal biopsy specimens (percentage of CD3+ cells) (B), in superficial LNs (percentage of CD3+ cells) (C), and pVL (D). Error bars represent SEM. LN data include historical reference values before CD8+ cell depletion (day −2). The vertical dashed lines indicate the times of anti-CD8+ antibody administration, and the shaded area indicates the period of RAL therapy.
FIG 5
FIG 5
Schematic of the model for the dynamics of 2-LTR+ cells. This model is based on a previously described model to analyze integrase inhibitor therapy (53). We added two compartments to simulate the dynamics of 2-LTR+ cells: R1 represents recently produced 2-LTR+ cells, still with an elevated death rate (δ1), and R2 represents long-lived 2LTR+ cells. See Materials and Methods for a detailed description of the model and its parameters.
FIG 6
FIG 6
Comparison of potential CD8+ cell effects on the dynamics of 2-LTR circles. A model of viral and 2-LTR dynamics was developed to analyze the observed data and potential effects of CD8+ cell: killing of infected cells prior to integration (effect in δ1) (top row), killing of productively infected cells (effect in δ2) (2nd row), noncytolytically reducing viral production (effect in p) (3rd row), noncytolytically reducing infectivity (effect in β) (4th row), and noncytolytically reducing integration (effect on k) (5th row), for each of the three treatment groups (three columns). Dashed lines represent 2-LTR+ cells/ml data normalized to the preintervention levels for each RM; solid black lines represent model projections for the fit. Parameters of the model are described in Materials and Methods; α = 0/day from the best fit.
FIG 7
FIG 7
Schematic representation of our findings. The effects of CD8+ depletion (A), CD8+ depletion and RAL therapy (B), and RAL therapy alone (C) are shown based on the effect of depletion of CD8+ cells in reducing the death rate of infected cells before integration.

Similar articles

Cited by

References

    1. Brumme ZL, Harrigan PR. 2006. The impact of human genetic variation on HIV disease in the era of HAART. AIDS Rev 8:78–87. - PubMed
    1. Borrow P, Lewicki H, Hahn BH, Shaw GM, Oldstone MB. 1994. Virus-specific CD8+ cytotoxic T-lymphocyte activity associated with control of viremia in primary human immunodeficiency virus type 1 infection. J Virol 68:6103–6110. - PMC - PubMed
    1. Koup RA, Safrit JT, Cao Y, Andrews CA, McLeod G, Borkowsky W, Farthing C, Ho DD. 1994. Temporal association of cellular immune responses with the initial control of viremia in primary human immunodeficiency virus type 1 syndrome. J Virol 68:4650–4655. - PMC - PubMed
    1. Borrow P, Lewicki H, Wei X, Horwitz MS, Peffer N, Meyers H, Nelson JA, Gairin JE, Hahn BH, Oldstone MB, Shaw GM. 1997. Antiviral pressure exerted by HIV-1-specific cytotoxic T lymphocytes (CTLs) during primary infection demonstrated by rapid selection of CTL escape virus. Nat Med 3:205–211. doi:10.1038/nm0297-205. - DOI - PubMed
    1. Chen ZW, Craiu A, Shen L, Kuroda MJ, Iroku UC, Watkins DI, Voss G, Letvin NL. 2000. Simian immunodeficiency virus evades a dominant epitope-specific cytotoxic T lymphocyte response through a mutation resulting in the accelerated dissociation of viral peptide and MHC class I. J Immunol 164:6474–6479. doi:10.4049/jimmunol.164.12.6474. - DOI - PubMed

Publication types

MeSH terms

LinkOut - more resources