. 2018 Jun 13;92(13):e02225-17.
doi: 10.1128/JVI.02225-17. Print 2018 Jul 1.

The Pathway To Establishing HIV Latency Is Critical to How Latency Is Maintained and Reversed

Affiliations

The Pathway To Establishing HIV Latency Is Critical to How Latency Is Maintained and Reversed

Simin D Rezaei et al. J Virol. .

Abstract

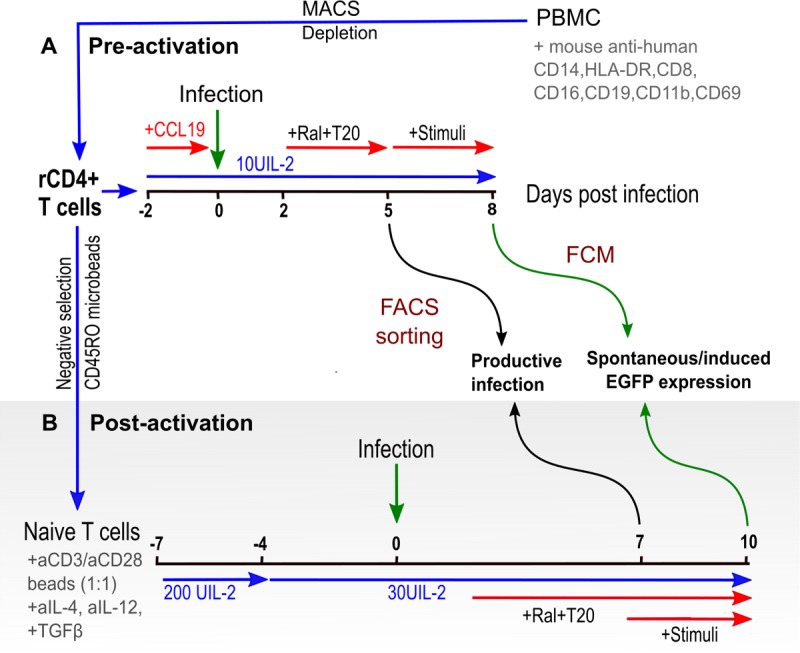
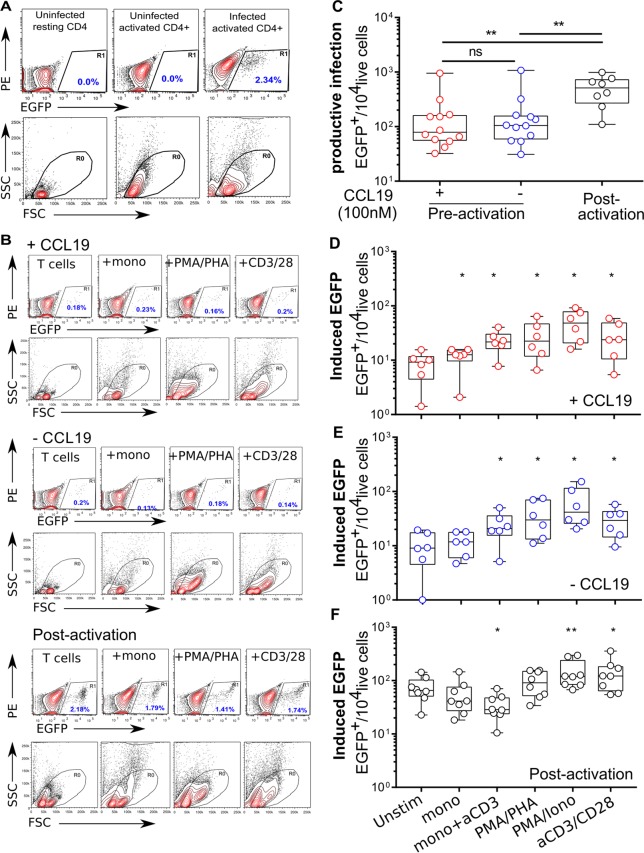
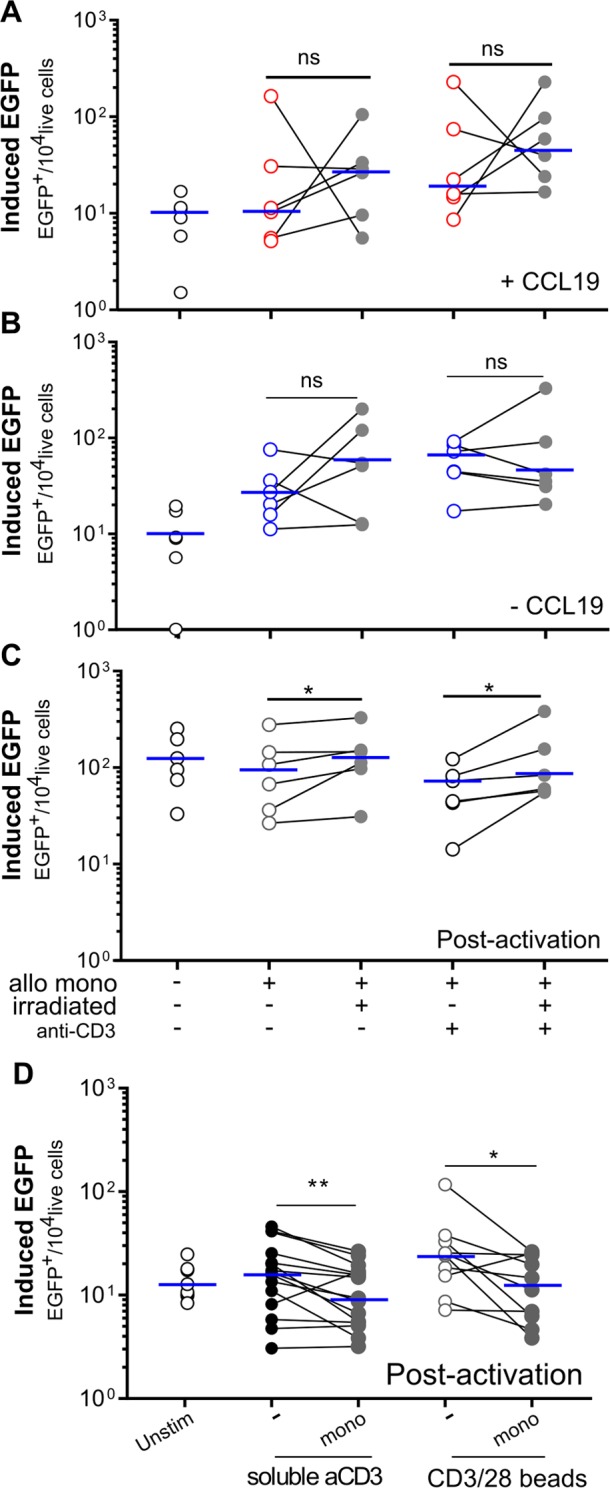
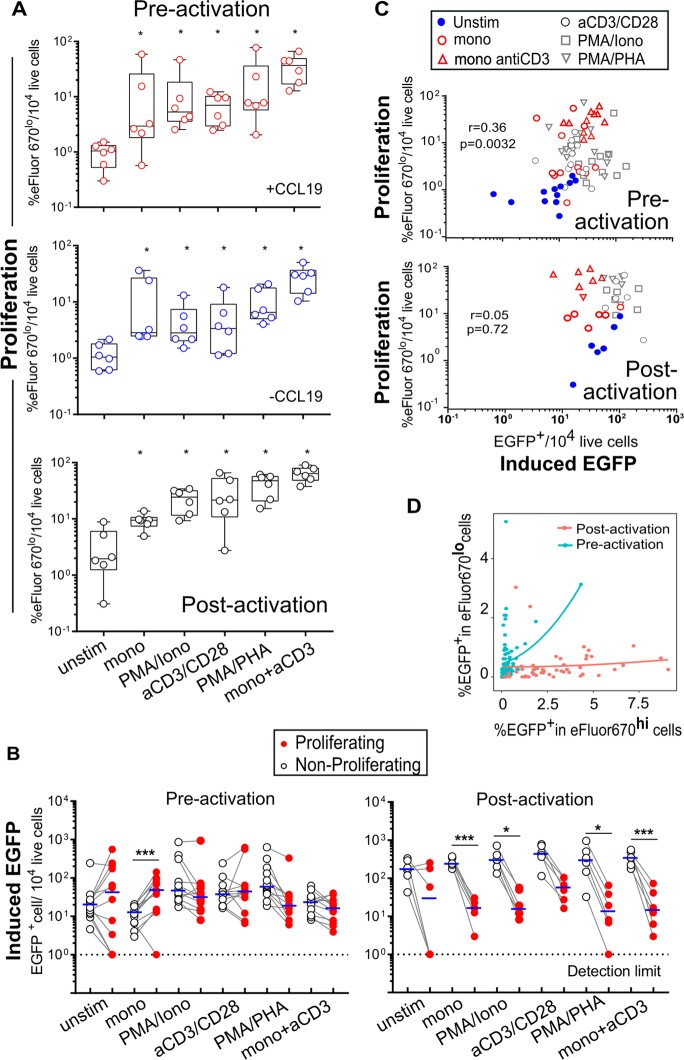
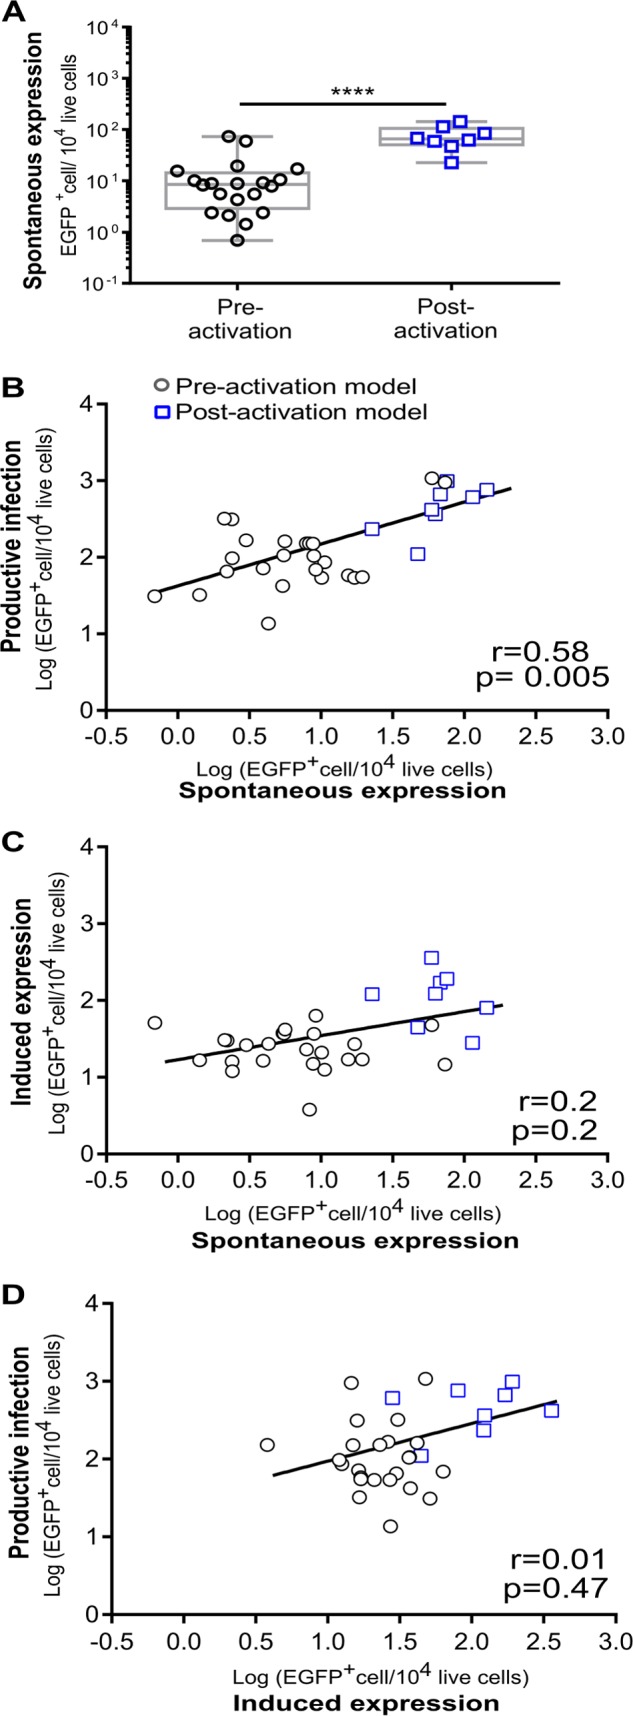
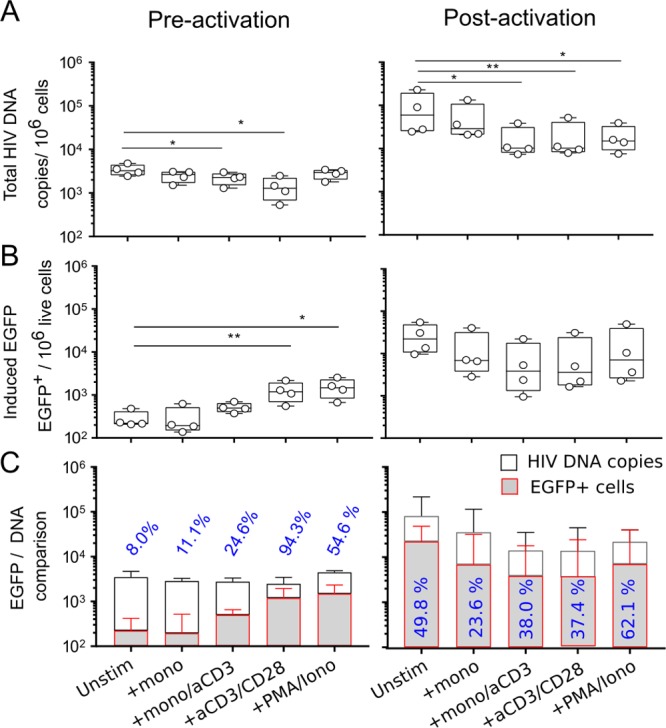
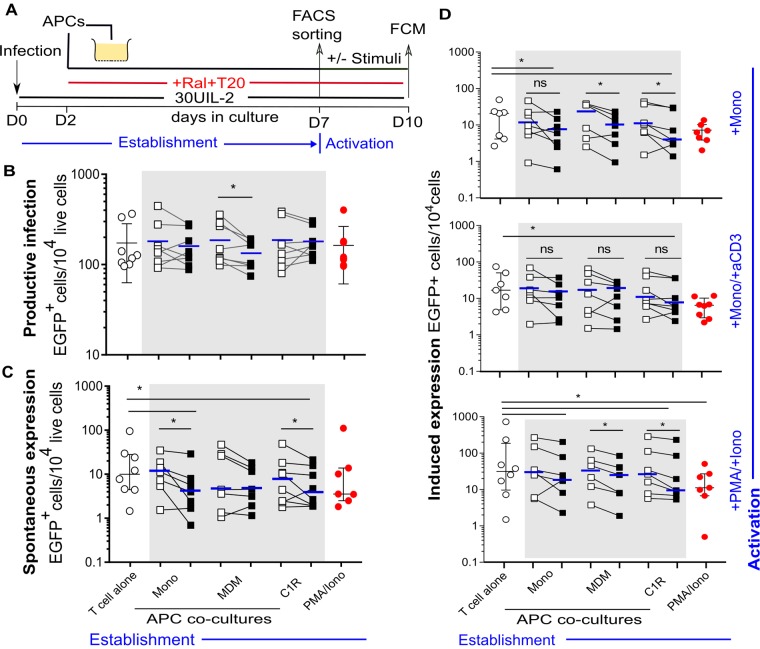
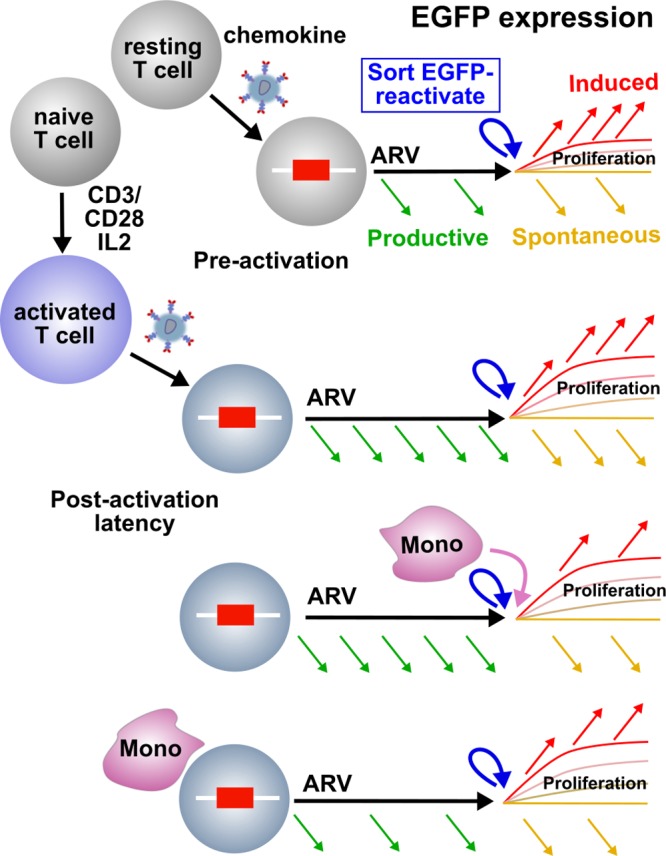
HIV infection requires lifelong antiretroviral therapy because of the persistence of latently infected CD4+ T cells. The induction of virus expression from latently infected cells occurs following T cell receptor (TCR) activation, but not all latently infected cells respond to TCR stimulation. We compared two models of latently infected cells using an enhanced green fluorescent protein (EGFP) reporter virus to infect CCL19-treated resting CD4+ (rCD4+) T cells (preactivation latency) or activated CD4+ T cells that returned to a resting state (postactivation latency). We isolated latently infected cells by sorting for EGFP-negative (EGFP-) cells after infection. These cells were cultured with antivirals and stimulated with anti-CD3/anti-CD28, mitogens, and latency-reversing agents (LRAs) and cocultured with monocytes and anti-CD3. Spontaneous EGFP expression was more frequent in postactivation than in preactivation latency. Stimulation of latently infected cells with monocytes/anti-CD3 resulted in an increase in EGFP expression compared to that for unstimulated controls using the preactivation latency model but led to a reduction in EGFP expression in the postactivation latency model. The reduced EGFP expression was not associated with reductions in the levels of viral DNA or T cell proliferation but depended on direct contact between monocytes and T cells. Monocytes added to the postactivation latency model during the establishment of latency reduced spontaneous virus expression, suggesting that monocyte-T cell interactions at an early time point postinfection can maintain HIV latency. This direct comparison of pre- and postactivation latency suggests that effective strategies needed to reverse latency will depend on how latency is established.IMPORTANCE One strategy being evaluated to eliminate latently infected cells that persist in HIV-infected individuals on antiretroviral therapy (ART) is to activate HIV expression or production with the goal of inducing virus-mediated cytolysis or immune-mediated clearance of infected cells. The gold standard for the activation of latent virus is T cell receptor stimulation with anti-CD3/anti-CD28. However, this stimulus activates only a small proportion of latently infected cells. We show clear differences in the responses of latently infected cells to activating stimuli based on how latent infection is established, an observation that may potentially explain the persistence of noninduced intact proviruses in HIV-infected individuals on ART.

Keywords: T cells; human immunodeficiency virus; latency; monocytes.


Figures

FIG 1
FIG 1
Establishment of pre- and postactivation latency in primary T cells in vitro. (A) Preactivation latency. Resting CD4+ T cells were isolated from PBMCs of healthy blood donors by negative selection using MACS, pretreated with CCL19 (100 nM) for 24 h, and infected with NL4.3-EGFP at an MOI of 0.5. Further rounds of infection were blocked by the addition of antiretrovirals at 2 days postinfection and maintained during culture. Cells expressing EGFP (EGFP+) were enumerated and removed by FCM sorting at day 5 postinfection. EGFP expression in EGFP cells was determined by FCM after activation in the presence of the antiretroviral. (B) Postactivation latency. Naive T cells were sorted from total CD4+ T cells by negative selection using CD45RO microbeads. Cells were activated with anti-CD3/anti-CD28 beads with anti-IL-4, anti-IL-12, and TGF-β. Beads were removed at day 3, and cells were expanded in 30 U IL-2 for 4 days. At day 7 postactivation, cells were infected with NL4.3-EGFP. Antiretrovirals were added to the cultures at 2 days postinfection and maintained during culture. At day 7 postinfection, EGFP-expressing cells were enumerated and removed by FCM sorting, and EGFP cells were activated with the same panel of stimuli used in the preactivation model. EGFP expression was measured at 3 days poststimulation by FCM. Ral, raltegravir; FACS, fluorescence-activated cell sorter.
FIG 2
FIG 2
HIV infection and virus reactivation in pre- and postactivation latency. (A) Flow cytometry gating and analysis used to measure EGFP expression in CD4+ T cells using the in vitro latency models. Live cells were defined by forward scatter (FSC) versus side scatter (SSC). Uninfected T cells were used to detect any background EGFP expression in our system. EGFP expression was measured against the PE channel. Plots show EGFP expression in mock-infected T cells (uninfected resting CD4+) with chemokine treatment (+CCL19) or mock-activated T cells (uninfected activated CD4+) and infected T cells (activated CD4+). (B) Plots representing EGFP expression following activation. Data are shown as percentages of EGFP in each plot in preactivation (+CCL19 or untreated CD4+ T cells) or postactivation latency. Data are representative of results for a matched sample in one experiment. (C) Frequency of productive infection in infected CD4+ T cells measured by EGFP expression at 5 days postinfection in the preactivation models (CCL19 treated [+] [red open circles] and untreated [−] [blue open circles]) and at day 7 in the postactivation model (black open circles). (D to F) Induced EGFP expression was measured following stimulation of sorted EGFP cells in preactivation latency with CCL19 (D) or without CCL19 (E) and in postactivation latency (F), using monocytes (mono), monocytes and anti-CD3 (20 μg/ml) (mono+aCD3), PHA (10 μg/ml) and PMA (50 ng/ml) (PMA/PHA), or PMA and ionomycin (500 ng/ml) (PMA/Iono) as well as plate-bound anti-CD3 (20 μg/ml) and anti-CD28 (3.6 μg/ml) (aCD3/aCD28) stimulation or culturing with antiretrovirals only (Unstim). EGFP expression was measured 72 h after coculture. Each dot represents data for a single donor, and the box plots show 25th and 75th percentiles, medians, and ranges. *, P ≤ 0.05; **, P ≤ 0.01 (as determined by a Wilcoxon matched-pairs signed-rank test).
FIG 3
FIG 3
EGFP expression following the addition of irradiated allogeneic monocytes. EGFP cells were sorted and cocultured with allogeneic monocytes with or without soluble anti-CD3 (+, anti-CD3 [20 μg/ml]) in the presence of antiretrovirals. Monocytes were irradiated (+irr) (closed symbols) or nonirradiated (−irr) (open symbols) and added to latently infected EGFP T cells. EGFP expression was measured at 72 h. (A to C) CCL19-treated (A) or untreated (B) cells and cells during postactivation latency (C). Each symbol represents data for a single donor. *, P ≤ 0.05; ns, not significant (as determined by a Wilcoxon matched-pairs signed-rank test). Blue lines indicate the median. (D) Comparison of the frequencies of induced EGFP expression following stimulation with soluble anti-CD3 with or without monocytes and anti-CD3/anti-CD28 beads (with or without monocytes) in the postactivation model. Sorted EGFP cells were cocultured with soluble anti-CD3 (20 μg/ml) or with anti-CD3/anti-CD28 beads (1:1 ratio) with and without monocytes in the presence of antiretrovirals. Induced EGFP expression was measured at 72 h. Each point represents data for a single donor. *, P ≤ 0.05; **, P ≤ 0.01 (as determined by a Wilcoxon matched-pairs signed-rank test). The median is indicated with a blue line.
FIG 4
FIG 4
Cellular proliferation and virus expression from sorted EGFP cells following stimulation. (A) Levels of cell proliferation following treatment with different stimuli. The sorted EGFP T cells in the preactivation models (CCL19 treated [+] [open red circles] and untreated [−] [open blue circles]) and postactivation models were stained with proliferation dye (eFluor670) and then cocultured with allogeneic monocytes, with and without anti-CD3, plate-bound anti-CD/anti-CD28, or PMA-PHA and PMA-ionomycin, or with an antiretroviral alone (unstim). At 72 h postactivation, cellular proliferation was measured by FCM. Each point represents data for an individual donor; the box plots show 25th and 75th percentiles, medians, and ranges. *, P ≤ 0.05 (as determined by a Wilcoxon matched-pairs signed-rank test). (B) EGFP expression in nonproliferating (eFluor670hi) and proliferating (eFluor670lo) cells under each stimulation condition. Each point represents data for a single donor. *, P ≤ 0.05; ***, P ≤ 0.001 (as determined by a Wilcoxon matched-pairs signed-rank test). The median is shown as a blue line. (C) Correlation between EGFP expression and cell proliferation in pre- and postactivation latency, determined by using Spearman's rank test. (D) Correlation between the frequency of EGFP expression in nonproliferating (eFluor670hi) and proliferating (eFluor670lo) cells in both models. Data from all cultures were pooled, and the level of EGFP expression in nonproliferating (eFlour670hi) cells was plotted against the level of EGFP expression in proliferating (eFluor670lo) cells in both models.
FIG 5
FIG 5
Postsort spontaneous EGFP expression is associated with higher-level productive infection. (A) The level of spontaneous EGFP expression from infected cells was measured 72 h after coculture of sorted EGFP cells with antiretrovirals only. Each point represents data for an individual donor; the box plots show 25th and 75th percentiles, medians, and ranges. ****, P ≤ 0.0001 (as determined by a Mann-Whitney test). (B) Correlation between EGFP+ productively infected T cells and EGFP expression from sorted EGFP cells (spontaneous expression) 72 h after stimulation with monocytes, monocytes–anti-CD3 (20 μg/ml), PHA (10 μg/ml)–PMA (50 ng/ml), PMA–ionomycin (500 ng/ml), plate-coated anti-CD3 (20 μg/ml)/anti-CD28 (3.6 μg/ml), or antiretrovirals only. (C) Comparison of induced EGFP expression after stimulation and spontaneous expression (unstimulated expression). (D) Correlation between EGFP+ productively infected cells and induced EGFP expression. Each point represents data for a single donor; correlations were determined by Spearman's rank test.
FIG 6
FIG 6
Stimulation increases EGFP expression from T cells containing HIV DNA in preactivation latency. Sorted EGFP cells from pre- and postactivation latency were cocultured with and without stimuli in the presence of antiretrovirals. (A) Total HIV DNA was measured 72 h after stimulation by using real-time PCR targeting gag 5′ long terminal repeat (LTR) primers. (B) The number of EGFP-expressing cells was measured by FCM. Each dot represents data for an individual donor, and the box plots show 25th and 75th percentiles, medians, and ranges. *, P ≤ 0.05; **, P ≤ 0.01 (as determined by paired Student's t test). (C) Overlay bar graphs showing the number of EGFP-expressing cells compared to total HIV DNA/latent infection. The proportion (percentage) is indicated by the numerical ratio of EGFP-expressing cells per total latent infection. Bar graphs show medians and interquartile ranges.
FIG 7
FIG 7
Coculturing of APCs with activated infected T cells during establishment of latency inhibits subsequent inducible EGFP expression. (A) Infected T cells in postactivation latency were cocultured with APCs directly or in the bottom reservoir of a transwell system from day 2 postinfection. Antiretrovirals were added at the same time, and cells were cultured for 5 days. At day 7 postinfection, the EGFP cells were sorted and cultured with or without stimulation. EGFP expression was measured by FCM. (B) Numbers of productively infected EGFP-expressing cells from APC-treated cultures with transwells (open squares) or without transwells (closed squares) and activation-induced expression compared to the number of productively expressing cells among T cells alone (open circles) and PMA-ionomycin-treated T cells (closed circles). The median is shown as a blue line. *, P ≤ 0.05 (as determined by a Wilcoxon matched-pairs signed-rank test). Each dot represents data for an individual donor. APC cocultures during establishment of latency are shown by gray shading. (C) Numbers of spontaneous EGFP-expressing cells from T cells alone, APC cocultures, and mitogen-activated T cell cultures. The median is shown as a blue line. *, P ≤ 0.05 (as determined by a Wilcoxon matched-pairs signed-rank test). APC cocultures during establishment of latency are shown by gray shading. (D) Numbers of induced EGFP-expressing cells following stimulation with monocytes, monocytes and anti-CD3 (20 μg/ml), and PMA (50 ng/ml)–ionomycin (500 ng/ml) compared to the level of EGFP expression following the same stimulation in cultures with CD4+ T cells alone or mitogen-treated T cells. Each point represents data for a single donor. The median is shown as a blue line. *, P ≤ 0.05 (as determined by a Wilcoxon matched-pairs signed-rank test). APC cocultures during the establishment of latency are shown by gray shading.
FIG 8
FIG 8
Model of inducible and spontaneous EGFP expression in pre- and postactivation latency. Resting CD4+ T cells were directly infected with an EGFP reporter virus, or naive T cells from the same donors were infected after TCR stimulation and the generation of memory T cells. Infected T cells were maintained with antiretrovirals from day 2 postinfection. EGFP-expressing cells were quantitated as productive infection at days 5 to 7 postinfection, and sorted EGFP cells were recultured with and without an activating stimulus. In preactivation latency, there were low levels of productive and spontaneous expression and high levels of induced expression. High frequencies of productive and spontaneous EGFP expression were found in postactivation latency, while spontaneous and induced expression levels were similar. Monocytes inhibited EGFP expression when present during the activation of sorted EGFP cells but also reduced spontaneous and induced expression when cultured during the initial establishment of latency.

Similar articles

Cited by

References

    1. Chun TW, Stuyver L, Mizell SB, Ehler LA, Mican JA, Baseler M, Lloyd AL, Nowak MA, Fauci AS. 1997. Presence of an inducible HIV-1 latent reservoir during highly active antiretroviral therapy. Proc Natl Acad Sci U S A 94:13193–13197. - PMC - PubMed
    1. Finzi D, Hermankova M, Pierson T, Carruth LM, Buck C, Chaisson RE, Quinn TC, Chadwick K, Margolick J, Brookmeyer R, Gallant J, Markowitz M, Ho DD, Richman DD, Siliciano RF. 1997. Identification of a reservoir for HIV-1 in patients on highly active antiretroviral therapy. Science 278:1295–1300. doi: 10.1126/science.278.5341.1295. - DOI - PubMed
    1. Shan L, Deng K, Gao H, Xing S, Capoferri AA, Durand CM, Rabi SA, Laird GM, Kim M, Hosmane NN. 2017. Transcriptional reprogramming during effector-to-memory transition renders CD4+ T cells permissive for latent HIV-1 infection. Immunity 47:766–775. doi: 10.1016/j.immuni.2017.09.014. - DOI - PMC - PubMed
    1. Buzon MJ, Sun H, Li C, Shaw A, Seiss K, Ouyang Z, Martin-Gayo E, Leng J, Henrich TJ, Li JZ, Pereyra F, Zurakowski R, Walker BD, Rosenberg ES, Yu XG, Lichterfeld M. 2014. HIV-1 persistence in CD4+ T cells with stem cell-like properties. Nat Med 20:139–142. doi: 10.1038/nm.3445. - DOI - PMC - PubMed
    1. Chomont N, El-Far M, Ancuta P, Trautmann L, Procopio FA, Yassine-Diab B, Boucher G, Boulassel M-R, Ghattas G, Brenchley JM, Schacker TW, Hill BJ, Douek DC, Routy J-P, Haddad EK, Sekaly R-P. 2009. HIV reservoir size and persistence are driven by T cell survival and homeostatic proliferation. Nat Med 15:893–900. doi: 10.1038/nm.1972. - DOI - PMC - PubMed

Publication types

Substances