. 2018 Apr 11;8(1):5793.
doi: 10.1038/s41598-018-24198-1.

A novel two-score system for interferon status segregates autoimmune diseases and correlates with clinical features

Affiliations

A novel two-score system for interferon status segregates autoimmune diseases and correlates with clinical features

Y M El-Sherbiny et al. Sci Rep. .

Erratum in

Abstract

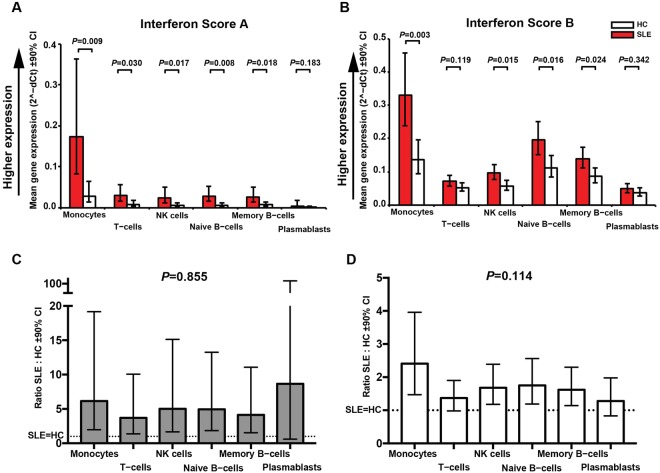
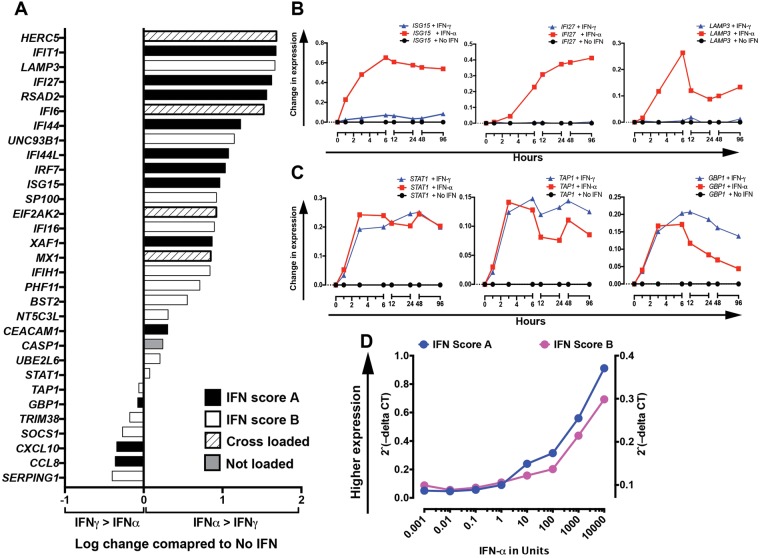
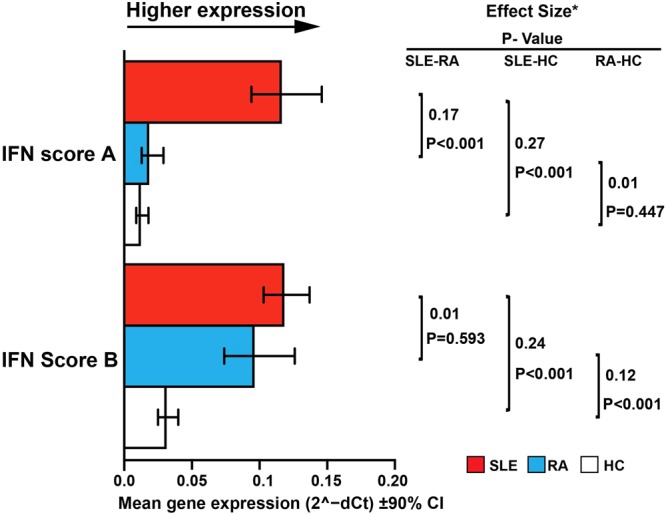
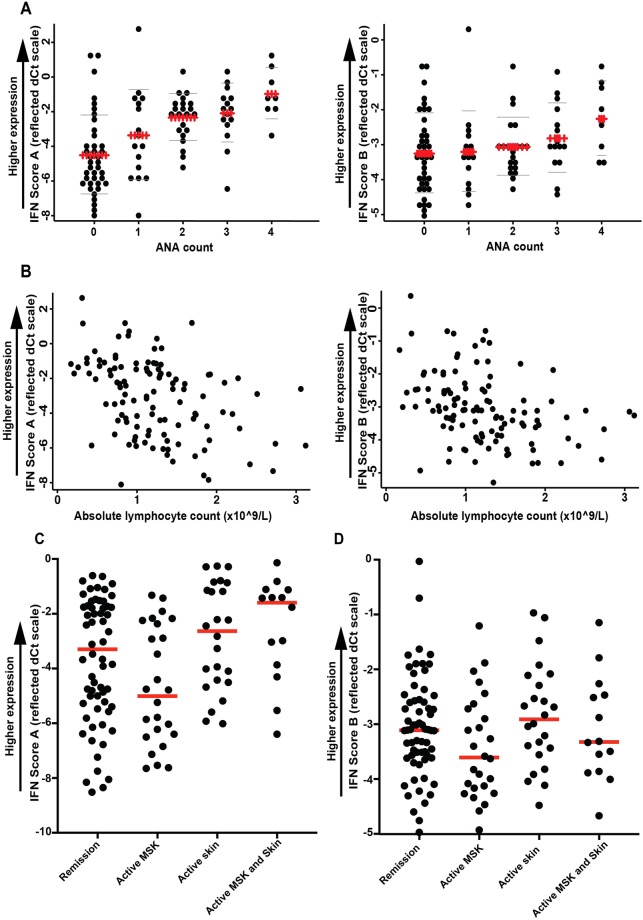
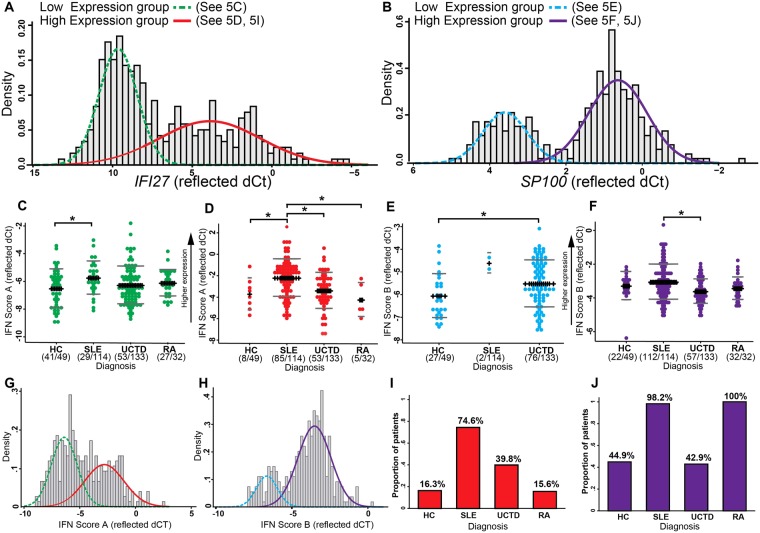
Measurement of type I interferon (IFN-I) has potential to diagnose and stratify autoimmune diseases, but existing results have been inconsistent. Interferon-stimulated-gene (ISG) based methods may be affected by the modularity of the ISG transcriptome, cell-specific expression, response to IFN-subtypes and bimodality of expression. We developed and clinically validated a 2-score system (IFN-Score-A and -B) using Factor Analysis of 31 ISGs measured by TaqMan selected from 3-IFN-annotated modules. We evaluated these scores using in-vitro IFN stimulation as well as in sorted cells then clinically validated in a cohort of 328 autoimmune disease patients and healthy controls. ISGs varied in response to IFN-subtypes and both scores varied between cell subsets. IFN-Score-A differentiated Systemic Lupus Erythematosus (SLE) from both Rheumatoid Arthritis (RA) and Healthy Controls (HC) (both p < 0.001), while IFN-Score-B differentiated SLE and RA from HC (both p < 0.001). In SLE, both scores were associated with cutaneous and hematological (all p < 0.05) but not musculoskeletal disease activity. Comparing with bimodal (IFN-high/low) classification, significant differences in IFN-scores were found between diagnostic groups within the IFN-high group. Our continuous 2-score system is more clinically relevant than a simple bimodal classification of IFN status. This system should allow improvement in diagnosis, stratification, and therapy in IFN-mediated autoimmunity.


Conflict of interest statement

The authors declare no competing interests.

Figures

Figure 1
Figure 1
Comparison of expression of IFN Score A and IFN Score B between sorted immune cell subsets Age-adjusted level of expression (2-dCT) of IFN Score A (Fig. 1A) and IFN Score B (Fig. 1B) in patients with SLE (red) and HC (white) for each cell subsets identified and sorted by flow cytometry of PBMCs. Figures 1C and D show ratio of expression (SLE:HC) for IFN Score A and Score-B respectively. A substantive increase in expression was observed for both scores in each subset. For both scores expression was greatest in monocytes. Dotted lines represent SLE = HC; details in Table S4.
Figure 2
Figure 2
In vitro stimulation and expression of ISGs Expression of selected ISGs was measured following in vitro stimulation of B cells using either IFN-α or IFN-γ. Activated B cells were exposed to media alone or IFN-α or IFN-γ for between 1 and 96 hours before analysis of gene expression profile. (A) Shows log of ratio of increase in expression 6 hours after IFN-α vs. IFN-γ each compared to no stimulation. Results are mean of 3 healthy donors. Values greater than 0 indicate greater increase in expression with IFN-α than IFN-γ. Values below 0 indicate greater increase in expression with IFN-γ than IFN-α. (B) Shows change in expression of 3 ISGs that predominantly respond to IFN-α. (C) Shows change in expression for 3 ISGs, which do not demonstrate selective response to IFN-α in B cells. (D) For dose-response, unsorted PBMCs were stimulated with increasing doses of IFN-α. RNA was extracted from unsorted PBMCs and used to measure expression of Interferon Score-A and Interferon Score-B.
Figure 3
Figure 3
Comparison of gene expression IFN scores against diagnosis. Age-adjusted differences between patients with SLE (red) and patients with active RA (DAS28 > 3.2; blue) or HC (white) in (A) IFN Scores. Effect sizes (partial eta squared) indicate which of the variables differed to the greatest extent between the different groups. We considered effect size 0.01 to be small, 0.06 to be medium and 0.14 to be large.
Figure 4
Figure 4
Association of IFN scores with other clinical immunology parameters Associations between each IFN score with (A) the number of ANA present, and (B) absolute lymphocyte count (observed data only). In panel A, ‘ + ’ = mean, ‘−‘ = mean ± 1 SD. ANA count refers to number of anti-extractable nuclear antigen (ENA) antibodies; including: Anti- Sm, RNP, Ro (SS-A), La (SS-B), Jo-1, Scl-70. (C) Shows Score A for patients with no disease activity (n = 66), active disease in the mucocutaneous system only (BILAG A or B, n = 24), active disease in the musculoskeletal system only (BILAG A or B, n = 26), or activity in both systems at the same time (n = 14). (D) Shows IFN Score B for the same patient groups.
Figure 5
Figure 5
Bimodality of IFN score genes. Analysis of bimodality was performed using samples from all SLE, RA, UCTD and HC individuals (n = 328). A, B, G, H show histograms of reflected dCt values overlaid with estimated density functions for 2 separate normal distributions (solid line = ‘high’ expression; dashed line = ‘low’ expression) identified using finite mixture modelling of (A) IFI27; (B) SP100; (G) Score A; (H) Score B. In common with previous studies we observed a bimodal distribution of IFN activity as measured by each IFN score (G and H). We used IFI27 (A) and SP100 (B) as the most bimodal gene within Score A and B respectively to classify patients into low and high expression groups. (CF) Show the level of IFN Score (reflected dCT) for each group of individuals within the high and low expression groups. These results show that SLE patients in the high expression group had a significantly higher level of Score A than RA and UCTD patients or HC individuals in the high expression group (*P < 0.1). (I) and (J) show the proportions of individuals classified within the high expression group for each diagnosis; notably 16.3% and 44.9% of HC were classified within the high group.

References

    1. Deng Y, Tsao BP. Genetic susceptibility to systemic lupus erythematosus in the genomic era. Nature reviews. Rheumatology. 2010;6:683–692. doi: 10.1038/nrrheum.2010.176. - DOI - PMC - PubMed
    1. Psarras, A., Emery, P. & Vital, E. M. Type I interferon-mediated autoimmune diseases: pathogenesis, diagnosis and targeted therapy. Rheumatology (Oxford), 10.1093/rheumatology/kew431 (2017). - PubMed
    1. Conigliaro P, et al. The type I IFN system in rheumatoid arthritis. Autoimmunity. 2010;43:220–225. doi: 10.3109/08916930903510914. - DOI - PubMed
    1. de Jong TD, et al. The type I interferon signature in leukocyte subsets from peripheral blood of patients with early arthritis: a major contribution by granulocytes. Arthritis Res Ther. 2016;18:165. doi: 10.1186/s13075-016-1065-3. - DOI - PMC - PubMed
    1. Chiche L, Jourde-Chiche N, Pascual V, Chaussabel D. Current perspectives on systems immunology approaches to rheumatic diseases. Arthritis Rheum. 2013;65:1407–1417. doi: 10.1002/art.37909. - DOI - PubMed

Publication types

MeSH terms