. 2018 Apr;556(7701):326-331.
doi: 10.1038/s41586-018-0027-0. Epub 2018 Apr 11.

Functional circuit architecture underlying parental behaviour

Affiliations

Functional circuit architecture underlying parental behaviour

Johannes Kohl et al. Nature. 2018 Apr.

Abstract

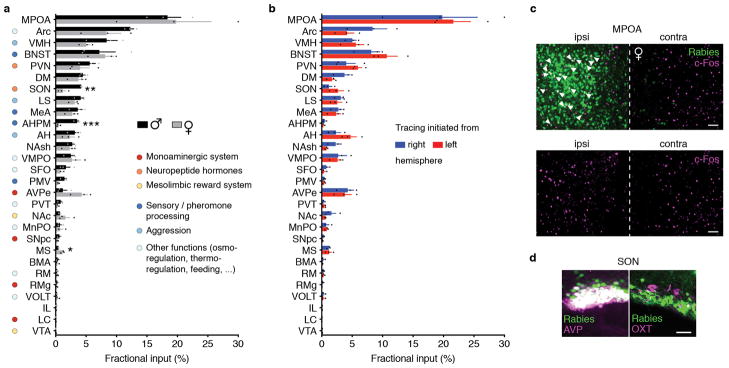
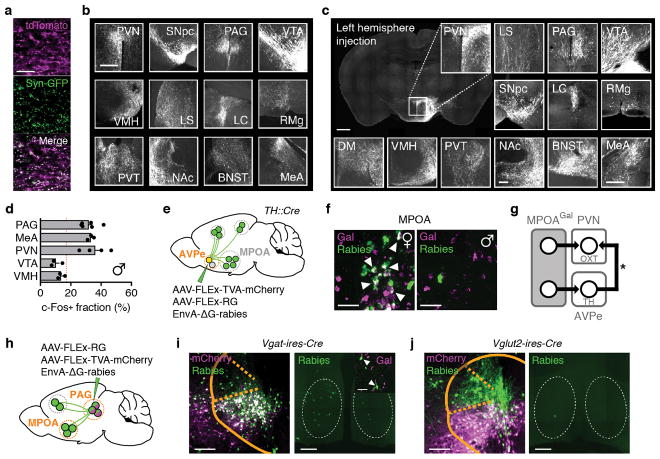
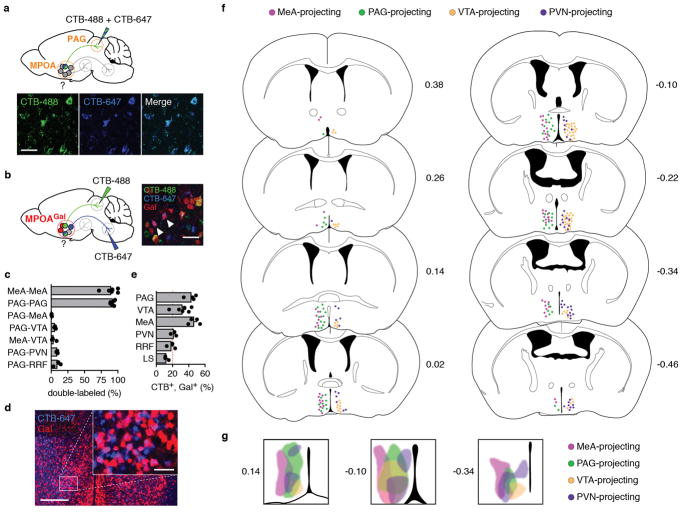
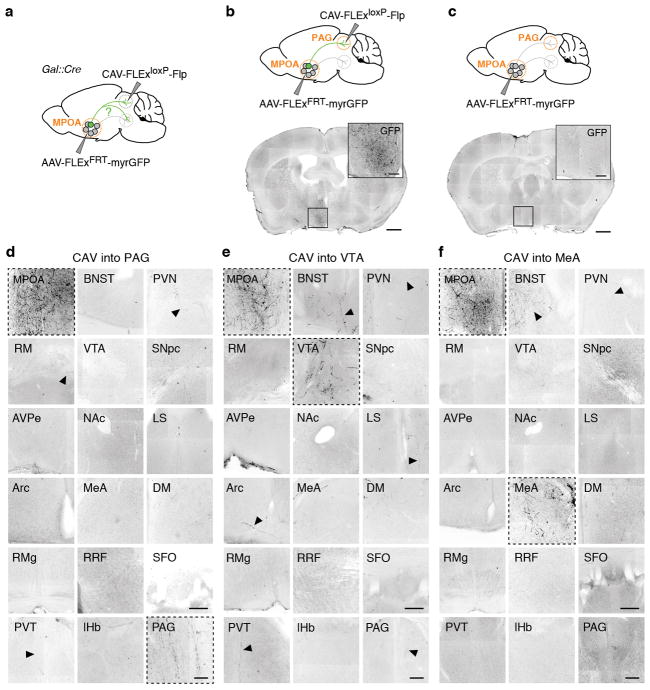
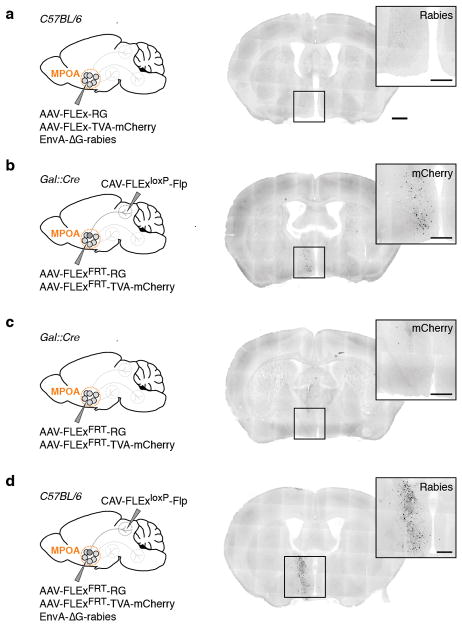
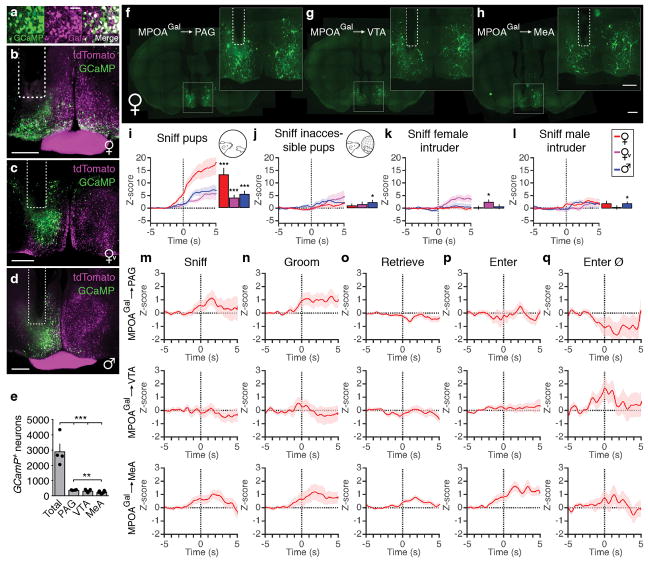
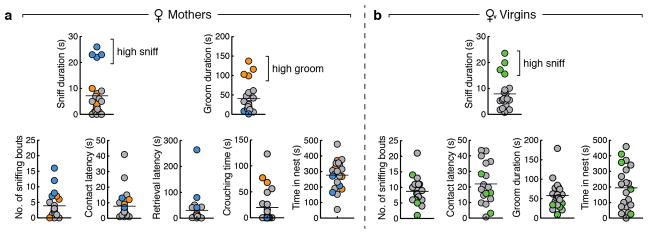
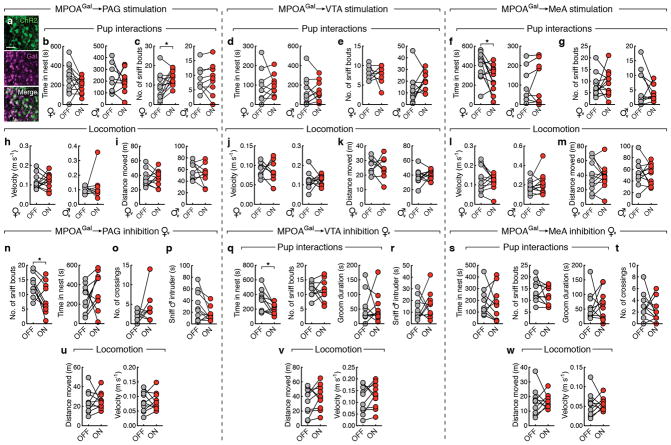
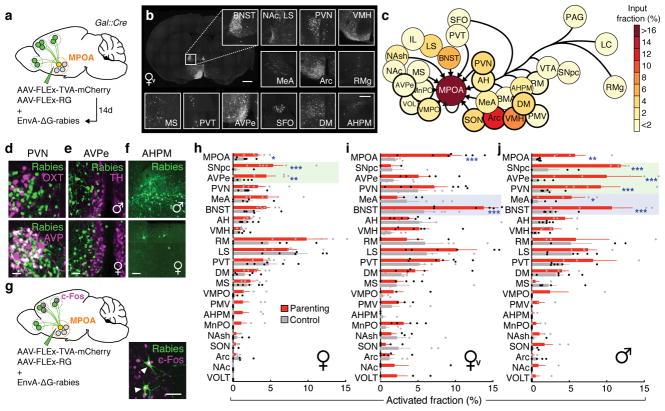
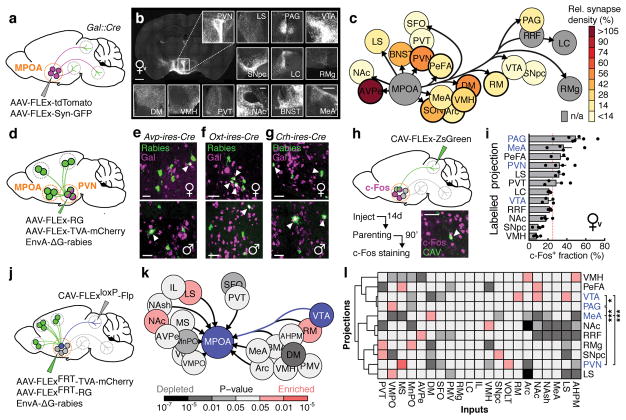
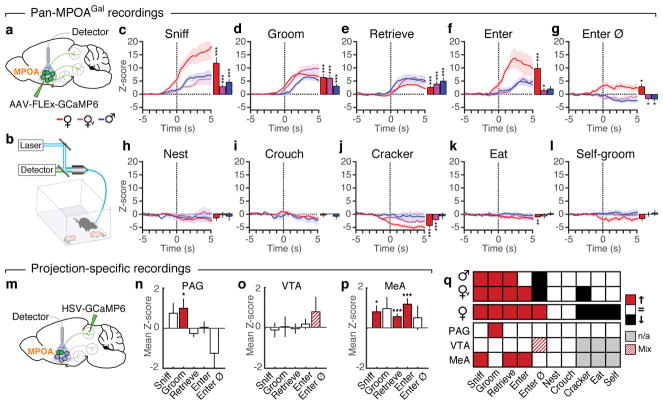
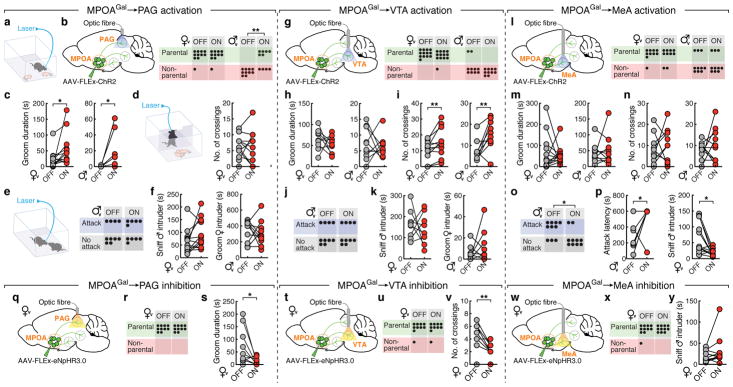
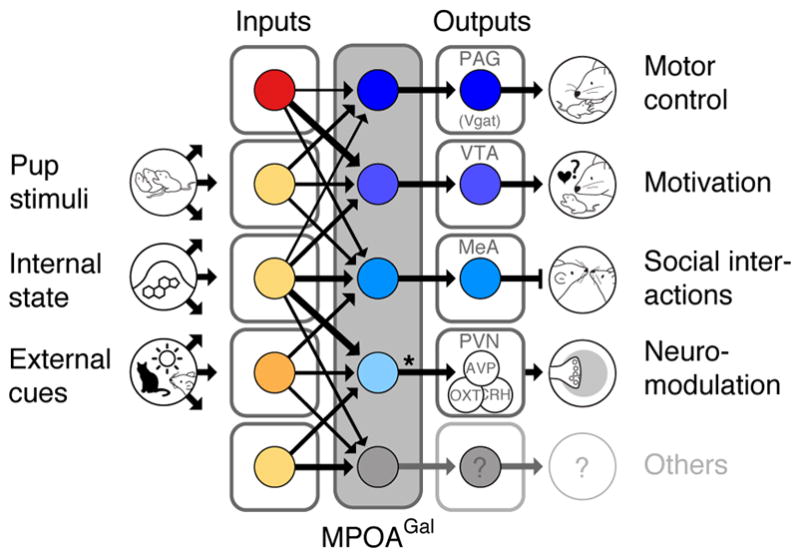
Parenting is essential for the survival and wellbeing of mammalian offspring. However, we lack a circuit-level understanding of how distinct components of this behaviour are coordinated. Here we investigate how galanin-expressing neurons in the medial preoptic area (MPOAGal) of the hypothalamus coordinate motor, motivational, hormonal and social aspects of parenting in mice. These neurons integrate inputs from a large number of brain areas and the activation of these inputs depends on the animal's sex and reproductive state. Subsets of MPOAGal neurons form discrete pools that are defined by their projection sites. While the MPOAGal population is active during all episodes of parental behaviour, individual pools are tuned to characteristic aspects of parenting. Optogenetic manipulation of MPOAGal projections mirrors this specificity, affecting discrete parenting components. This functional organization, reminiscent of the control of motor sequences by pools of spinal cord neurons, provides a new model for how discrete elements of a social behaviour are generated at the circuit level.


Conflict of interest statement

Author Information

The authors declare no competing financial interests.

Figures

Extended Data Figure 1
Extended Data Figure 1. Putative functional roles of brain areas providing monosynaptic inputs into MPOAGal neurons
a, Comparison between MPOAGal input fractions in virgin males (n = 3) and females (n = 3) after rabies tracing (see Fig. 2d). Sexually dimorphic inputs are highlighted. Two-tailed t-tests, SON: **P = 0.0041, AHPM: ***P = 0.0007, MS: *P = 0.0133. b, Comparison between MPOAGal input fractions after rabies tracing was initiated from the right (n = 3) or left (n = 3) hemisphere in virgin females. No significant differences were found (P > 0.05; two-tailed paired t-test). c, Comparison between rabies-injected (ipsilateral, ipsi) and non-injected (contralateral, contra) MPOA of a mother after parental behaviour. Activated (c-Fos+) rabies+ neurons are shown (upper, arrowheads). c-Fos+ neuron numbers are not significantly different between hemispheres (lower, P = 0.43, 95% CI [−4.176, 1.843]; two-tailed paired t-test; n = 6). d, MPOAGal neurons receive monosynaptic inputs from magnocellular SONAVP neurons (mothers, 72.7 ± 9.3% overlap, n = 3; virgin females, 77.4 ± 4.3%, n = 3; fathers, 83.3 ± 3.3%, n = 3) but rarely from SONOXT neurons (mothers, 4.6 ± 4.2% overlap, n = 2; virgin females, 4.5 ± 1.0%, n = 2; fathers, 2.8 ± 1.8%, n = 2). Scale bars, c, 100 μm; d, 50 μm. Data are mean ± s.e.m.
Extended Data Figure 2
Extended Data Figure 2. MPOAGal projections in males and downstream connectivity
a, Synaptophysin-GFP (Syn-GFP) labelling of presynaptic sites in MPOAGal projections. b, Representative MPOAGal projections from a virgin male, identified by tdTomato fluorescence. c, Representative MPOAGal projections, identified by tdTomato fluorescence, after viral injection into the left MPOA. d, c-Fos+ fractions of virally labelled MPOAGal projections in fathers (n = 6, 3, 4, 3, 3, respectively, from top). Red line depicts the population average (see ref. 3). Data are mean ± s.e.m. e, Trans-synaptic retrograde rabies tracing from AVPeTH neurons. f, MPOAGal neurons presynaptic to AVPeTH neurons in females (left, arrowheads, 21.4% Gal+, 47/220 neurons, n = 3) and males (right, 16.7% Gal+, 4/24 neurons, n = 2). g, Direct and indirect MPOAGal→PVNOXT connectivity. Asterisk, AVPeTH neurons form excitatory synapses with PVNOXT in females. h, Conditional monosynaptic retrograde tracing initiated from PAG. i, j, Injection sites with mCherry+ starter neurons in PAG of Vgat-ires-Cre (i, left) or Vglut2-ires-Cre (j, left) mice. Presynaptic, rabies+/Gal+ neurons are detected in MPOA when tracing is initiated from PAGVgat (i, right, arrowheads), but not PAGVglut2 (j, right), neurons. Scale bars, a, 50 μm; b, 250 μm; c, left, 500 and inset, 250 μm; f, 50 μm; i, j, left, 200 μm and right, 250 μm; i, insert, 50 μm.
Extended Data Figure 3
Extended Data Figure 3. MPOAGal projections correspond to largely non-overlapping neuronal subpopulations
a, Control injection of a 1:1 mixture of CTB-488 and CTB-647 into PAG results in highly overlapping neuron populations in the MPOA (quantification, see c). b, Strategy to determine collaterals between pairwise injected MPOAGal projections in Gal::Cre+/−; loxP-Stop-loxP-tdTomato+/− mice. An example with two double-labelled MPOAGal neurons is shown after injection of CTB-488 into PAG and CTB-647 into VTA (right, arrowheads). c, Quantification of data in a, b. Data are mean ± s.e.m. (n = 6, 6, 3, 3, 3, 3, 3, respectively, from top). d, Representative image from MPOA of Gal::Cre+/−; loxP-Stop-loxP-tdTomato+/− mouse after injection of CTB-647 into PAG. Note high overlap between Gal+ and CTB+ neurons. e, Frequency of Gal+ neurons in individual, CTB-labelled MPOA projections (n = 4, 6, 4, 3, 3, 3, respectively, from top). Red line depicts expected labelling frequency, based on proportion of Gal+ MPOA neurons (~20%, ref. 3). Data in c, e are mean ± s.e.m. f, Distribution of cell bodies corresponding to specific MPOAGal projections. Individual MPOAGal projection areas in Gal::Cre virgin females were injected with Cre-dependent CAV2-FLEx-ZsGreen (see Fig. 2h). Only labelling patterns on the ipsilateral, injected side are shown and only two projection-specific subpopulations per side are displayed for clarity. Distance from Bregma is shown in mm. Mouse brain images in this figure have been reproduced with permission from Elsevier. g, Zones occupied by MPOAGal cell bodies projecting to MeA, PAG, VTA and PVN in anterior (left), central (middle) and posterior (right) MPOA. Distance from Bregma is shown in mm. Scale bars, a, b, 50 μm; d, 250 μm and inset, 50 μm.
Extended Data Figure 4
Extended Data Figure 4. MPOAGal projections barely collateralize
a, Strategy to detect brain-wide axon collaterals of specific MPOAGal projections. b, Dense labelling of MPOAGal neurons after injection of retrograde tracer CAV into PAG and reporter AAV into MPOA. c, Absence of MPOAGal labelling in negative control without injection of CAV. d–f, Only minor axon collaterals are detectable from MPOAGal neurons projecting to PAG (n = 2) (d), VTA (n = 3) (e) or MeA (n = 2) (f). Note MPOA→MeA fibre tract in BNST in (f). Signal was enhanced using anti-GFP immunostaining (Methods). Scale bars, b, c, 400 μm and insets, 100 μm; d–f, 150 μm.
Extended Data Figure 5
Extended Data Figure 5. Negative controls for monosynaptic retrograde tracing
a, Absence of rabies+ background labelling in the MPOA of AAV- and rabies-injected C57BL/6 control mice (n = 2). b, Labelling of MPOAGal neurons after injection of CAV into PAG and starter AAVs into MPOA of Gal::Cre mice (261 ± 19 neurons, n = 4). c, Near-absence of labelling in AAV-only negative control (11 ± 2 neurons, n = 2). d, Background rabies+ neurons were present in the following brain areas of CAV-, AAV- and rabies-injected C57BL/6 control mice (n = 3): MPOA, BNST, AH, PVN and SON. These areas were therefore excluded from analysis (see Figure 2k, l and Methods). Scale bars, a–d, 400 μm and insets, 150 μm.
Extended Data Figure 6
Extended Data Figure 6. Histology of photometry recording experiments and tuning of MPOAGal neurons in other behavioural contexts
a, Specific GCaMP6m expression in MPOAGal neurons (90.9 ± 4.3% overlap, n = 3, mothers). b–d, Implantation sites of optical fibres in the MPOA of Gal::Cre+/−; loxP-Stop-loxP-tdTomato+/− mother (b), virgin female (c) and father (d). e, Quantification of GCaMP+ neuron numbers in MPOA after AAV injection (‘Total’, n = 4) and after injection of HSV into individual projections (n = 5 each). Data for mothers are shown. Data are mean ± s.e.m. Two-tailed t-tests, Total vs. PAG, VTA, MeA: ***P < 0.001, PAG vs. MeA: **P = 0.0033. f–h, Expression of GCaMP6m in MPOAGal neurons after bilateral infection of axon terminals in PAG (f), VTA (g) or MeA (h) with Cre-dependent, GCaMP6m-expressing HSV. Insets show fibre implantation sites. i, j, Averaged recording traces from MPOAGal neuron activity during sniffing of accessible pups (i) or inaccessible pups enclosed in a wire mesh tea ball (j) in mothers (n = 4), virgin females (n = 3) and fathers (n = 5). k, l, Averaged recording traces from MPOAGal neuron activity during sniffing of female (k) or male (l) intruder in mothers (n = 4), virgin females (n = 3) and fathers (n = 5). Two-tailed t-tests, i: ***P < 0.0001, ***P < 0.0001, P = 0.0001, j: *P = 0.0380, k: *P = 0.0219, l: *P = 0.0272. m–q, Averaged recording traces from MPOAGal neurons projecting to PAG (left, n = 10), VTA (middle, n = 12) or MeA (right, n = 8) during episodes of maternal behaviour. All traces and bar plots are mean ± s.e.m. Scale bars, a, 50 μm; b–d, 400 μm; f–h, 1 mm and insets, 500 μm.
Extended Data Figure 7
Extended Data Figure 7. Distribution of parental behaviours in mothers and virgin females
Distribution of parental behaviours during 10 min pup interaction assays in mothers (a, n = 23) and virgin females (b, n = 20). In a, individuals exhibiting high pup sniffing are indicated in blue across plots, and individuals exhibiting high pup grooming are indicated in orange. In b, individuals exhibiting high pup sniffing are indicated in green. Note that y axis ranges are identical between a and b. Lines depict mean.
Extended Data Figure 8
Extended Data Figure 8. Behavioural specificity of MPOAGal projection stimulation
a, Channelrhodopsin-2 (ChR2) expression in MPOAGal neurons (97.7 ± 0.2% overlap, virgin female, n = 2). b–g, Effect of activating PAG- (b, c), VTA- (d, e) or MeA- (f, g) projections on time spent in nest in females and males (b, n = 13, 10; d, n = 9, 10; f, n = 10, 10) and number of pup-directed sniffing bouts (c, n = 13, 10; e, n = 9, 10; g, n = 10, 10). h–m, Effect of activating PAG- (h, i), VTA- (j, k) or MeA- (l, m) projections on locomotion velocity (h, n = 13, 10; j, n = 8, 10; l, n = 10, 10) and moved distance (i, k, m). n, q, s, Effect of inhibiting PAG- (n, n = 10), VTA- (q, n = 10) or MeA- (s, n = 11) projections on pup interactions. o, t, Effect of inhibiting PAG- (o, n = 10) or MeA- (t, n = 11) projections on number of barrier crosses. p, r, Effect of inhibiting PAG- (p, n = 10) or MeA- (r, n = 11) projections on chemoinvestigation of a male intruder. u–w, Effect of inhibiting PAG- (u), VTA- (v) or MeA- (w) projections on locomotion velocity and moved distance (n = 10, 10, 11, respectively). Two-tailed paired t-tests, c: *P = 0.0135, f: *P = 0.03, n: *P = 0.0413, q: *P = 0.0264. Scale bar in a, 50 μm.
Figure 1
Figure 1. MPOAGal inputs are activated during parental behaviour in a sex- and reproductive state-specific manner
a, Monosynaptic retrograde tracing from MPOAGal neurons. b, Input areas with rabies+ neurons. c, Overview of inputs into MPOAGal neurons. Hypothalamic input areas in bold. d, MPOAGal neurons receive monosynaptic inputs from magnocellular PVNAVP (37.6 ± 4.1% overlap, n = 3) but rarely PVNOXT (2.6 ± 0.6%, n = 3) neurons. e, Presynaptic neurons in AVPe are TH in males (1.9% TH+, n = 2) and females (1.8% TH+, n = 3). f, Presynaptic neurons in AHPM. g, Identification of activated MPOAGal inputs and example of c-Fos+ presynaptic neurons. h–j, Activated input fractions in mothers (h), virgin females (i) and fathers (j) (each n = 6, controls n = 6). Green boxes, parent-specific activation, blue boxes, father- and virgin female-specific activation. Two-tailed t-tests (corrected for multiple comparisons, Methods), h: ***P < 0.0001, **P = 0.0267, *P = 0.0196, i: ***P < 0.0001, j: ***P < 0.0001, **P = 0.0035, *P = 0.0104. Data in h–j are mean ± s.e.m. n = number of animals in all figures. Scale bars, b, left, 500 μm, inset, 250 μm; d–g, 50 μm. Abbreviations, see Extended Data Table 1.
Figure 2
Figure 2. Identification of parenting-activated MPOAGal projections and input-output logic of the MPOAGal circuit
a, Visualisation of MPOAGal projections. b, MPOAGal projections identified by tdTomato fluorescence. c, Relative synaptic density in MPOAGal projection targets (n = 4, Methods). Grey regions could not be quantified due to tissue autofluorescence. Hypothalamic target areas in bold. d, Monosynaptic retrograde tracing from PVN. e–g, MPOAGal neurons presynaptic to (e) PVNAVP (female 15/364 Gal+, n = 3; male 46/180 Gal+, n = 3) to (f) PVNOXT (female 26/71 Gal+, n = 3; male 7/51 Gal+, n = 3) and to (g) PVNCRH neurons (female 19/72 Gal+, n = 3; male 22/45 Gal+, n = 3). Significantly more MPOA neurons presynaptic to PVNAVP and PVNCRH were Gal+ in males than in females (P < 0.0001, P = 0.0170, two-tailed Fisher’s exact test) whereas more MPOA neurons presynaptic to PVNOXT were Gal+ in females than in males (P = 0.0068). h, Labelling strategy for MPOAGal projections; example of retrogradely labelled c-Fos+ neuron in the MPOA. i, Activated fraction of MPOAGal neurons projecting to parenting-relevant brain areas (n = 7, 4, 3, 4, 3, 4, 3, 4, 3, 4, 4, 4, from top). Data are mean ± s.e.m. Red line, population average (ref. 3). Projections chosen for further functional studies are highlighted. j, Strategy for monosynaptic retrograde tracing from projection-defined MPOAGal subpopulations. k, l, Map of monosynaptic inputs into VTA-projecting MPOAGal neurons (k) and matrix displaying inputs into projection-defined MPOAGal subpopulations (l, Methods; n = 5, 3, 4, 4, 4, 4, 5, 5, 4, 4, 3, from top). Tukey post-hoc test assessed whether candidate projections (blue) receive quantitatively different inputs; VTA vs. PAG: *P = 0.0205, PAG vs. PVN: ***P = 0.0002, all other comparisons: ***P < 0.0001. Scale bars, b, left, 500 and inset, 250 μm; e–g, h, 50 μm.
Figure 3
Figure 3. Distinct projection-defined MPOAGal neuronal pools are tuned to specific aspects of parental behaviour
a, b, Fibre photometry recording strategy (a) and setup (b). c–i, Averaged recording traces from MPOAGal population activity during pup sniffing (c), -grooming (d), -retrieval (e), entering nest with pups (f), entering empty nest (g), nest building (h) and crouching (i). Mean peak activity (Z-scores) shown in mothers (n = 4), virgin females (n = 3) and fathers (n = 5). j–l, Averaged recording traces and mean peak activity during control behaviours. m, Strategy for recording projection-defined MPOAGal subpopulations. n–p, Mean peak activation for PAG- (n, n = 10), VTA- (o, n = 12) and MeA- (p, n = 8) projections during parenting. q, Tuning matrix for pan-MPOAGal (upper) and projection-specific (lower) recordings. Two-tailed t-tests (Methods), c: ***P < 0.0001, ***P < 0.0001, P = 0.0001, d: ***P < 0.0001, e: ***P < 0.0001, ***P = 0.0008, 0.0004, f: ***P < 0.0001, *P = 0.0247, g: *P = 0.0185, 0.0365, 0.0105, j: ***P = 0.0002, ***P < 0.0001, k: **P = 0.0059, n: *P = 0.0362, p: *P = 0.0102, ***P < 0.0001, ***P = 0.0001. Data are mean ± s.e.m.
Figure 4
Figure 4. MPOAGal projections mediate discrete aspects of parental behaviour
a, Setup for optogenetic manipulations. b, g, l, Activation of MPOAGal projections (left); pup-directed behaviour in virgin females and males without (‘OFF’) or with (‘ON’) activation of PAG- (b), VTA- (g) and MeA- (l) projections. c, h, m, Effect of activating PAG- (c), VTA- (h) or MeA- (m) projections on pup grooming (virgin females, n = 13, 9, 10; males, n = 9, 10, 10). d, i, n, Motivation assay (d) and effect of activating PAG- (d), VTA- (i) or MeA- (n) projections on barrier crossing (virgin females, n = 13, 10, 10; males, n = 13, 10). e, j, o, Intruder assay (e) and effect of activating PAG- (e), VTA- (j) or MeA- (o) projections on male-male aggression. f, k, Effect of MPOAGal→PAG (f) or MPOAGal→VTA (k) activation on male- (n = 12, 9) or female-directed (n = 10, 10) behaviour. p, Effect of MPOAGal→MeA activation on male-directed attack latency (n = 10) and chemoinvestigation (n = 10). q, t, w, Inhibition of MPOAGal projections. r, u, x, Pup-directed behaviour in virgin females without (‘OFF’) or with (‘ON’) inhibition of PAG- (r, n = 10), VTA- (u, n = 10) and MeA- (x, n = 11) projections. s, Effect of MPOAGal→PAG inhibition on pup grooming (n = 10). v, Effect of MPOAGal→VTA inhibition on barrier crossing (n = 10). y, Effect of MPOAGal→MeA inhibition male-directed chemoinvestigation (n = 11). Chi-square (b, e, g, j, l, o, r, u, x) or two-tailed paired t-tests (c, d, f, h, i, k, m, n, p, s, v, y), b: **P = 0.0034, c: *P = 0.0273, 0.0374, i: **P = 0.0089, 0.0056, o: *P = 0.0246, p: *P = 0.033, 0.0109, s: *P = 0.0396, v: **P = 0.0038.
Figure 5
Figure 5. Functional architecture of the MPOAGal circuit
Broad, state- and sex-specifically activated inputs converge onto largely non-overlapping, projection-defined MPOAGal subpopulations that elicit specific aspects of parental behaviour. Asterisk, MPOAGal→PVN connections are sexually dimorphic (see Fig. 2e–g).

Comment in

References

    1. Dulac C, O’Connell LA, Wu Z. Neural control of maternal and paternal behaviors. Science. 2014;345:765–770. doi: 10.1126/science.1253291. - DOI - PMC - PubMed
    1. Numan M, Insel TR. The neurobiology of parental behavior. Springer; 2011.
    1. Wu Z, Autry AE, Bergan JF, Watabe-Uchida M, Dulac CG. Galanin neurons in the medial preoptic area govern parental behaviour. Nature. 2014;509:325–330. doi: 10.1038/nature13307. - DOI - PMC - PubMed
    1. Wickersham IR, et al. Monosynaptic restriction of transsynaptic tracing from single, genetically targeted neurons. Neuron. 2007;53:639–647. doi: 10.1016/j.neuron.2007.01.033. - DOI - PMC - PubMed
    1. Marlin BJ, Mitre M, D’Amour JA, Chao MV, Froemke RC. Oxytocin enables maternal behaviour by balancing cortical inhibition. Nature. 2015;520:499–504. doi: 10.1038/nature14402. - DOI - PMC - PubMed

Publication types

MeSH terms