. 2018 Apr;556(7701):339-344.
doi: 10.1038/s41586-018-0030-5. Epub 2018 Apr 11.

Genome evolution across 1,011 Saccharomyces cerevisiae isolates

Affiliations

Genome evolution across 1,011 Saccharomyces cerevisiae isolates

Jackson Peter et al. Nature. 2018 Apr.

Abstract

Large-scale population genomic surveys are essential to explore the phenotypic diversity of natural populations. Here we report the whole-genome sequencing and phenotyping of 1,011 Saccharomyces cerevisiae isolates, which together provide an accurate evolutionary picture of the genomic variants that shape the species-wide phenotypic landscape of this yeast. Genomic analyses support a single 'out-of-China' origin for this species, followed by several independent domestication events. Although domesticated isolates exhibit high variation in ploidy, aneuploidy and genome content, genome evolution in wild isolates is mainly driven by the accumulation of single nucleotide polymorphisms. A common feature is the extensive loss of heterozygosity, which represents an essential source of inter-individual variation in this mainly asexual species. Most of the single nucleotide polymorphisms, including experimentally identified functional polymorphisms, are present at very low frequencies. The largest numbers of variants identified by genome-wide association are copy-number changes, which have a greater phenotypic effect than do single nucleotide polymorphisms. This resource will guide future population genomics and genotype-phenotype studies in this classic model system.


Conflict of interest statement

The authors declare no competing interests.

Figures
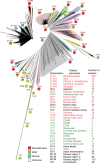
Fig. 1
Fig. 1. Neighbour-joining tree built using the biallelic SNPs.
We identified 26 clades (numbered clockwise from 1 to 26) and three mosaic groups (M1–M3). The pie charts represent the ecological origins of the clade: domesticated (red), wild (green) and human (cyan). The colour of the clade name indicates its assignment: domesticated (red) and wild (green). The top left inset represents a magnification of the wine/European clade with four major subclades highlighted.
Fig. 2
Fig. 2. Chinese origin of S. cerevisiae.
Maximum-likelihood rooted tree of the Saccharomyces complex, based on the alignment of 2,018 concatenated conserved genes. Heat maps display the distance from the last common ancestor of S. cerevisiae (Sc)–S. paradoxus (Sp) (white–blue), and the number of introgressed S. paradoxus ORFs (white–red). The map shows the geographical origins of the strains.
Fig. 3
Fig. 3. Ploidy and aneuploidy natural variation.
a, Distribution of ploidy and fraction of heterozygous isolates. b, Violin plot of growth fitness trait by ploidy. Diploid isolates are globally fitter than individuals with other ploidy levels. Number of trait values for 1n isolates = 4,585; for 2n isolates = 26,249; for  3n isolates = 1,610; and for  4n isolates = 1,330. c, Distribution of aneuploid chromosomes per individual. d, Violin plot of growth fitness trait of aneuploid (n = 6,510) and euploid (n = 20,719) isolates shows a significant difference in fitness trait between the two categories. All P values were calculated using a two-sided Mann–Whitney–Wilcoxon test. Centre lines, median; boxes, interquartile range (IQR); whiskers, 1.5 × IQR. Data points beyond the whiskers are outliers.
Fig. 4
Fig. 4. The S. cerevisiae pangenome.
a, Copy number distribution for core and variable ORFs. Variable ORFs have a greater frequency of both hemizygous and multiallelic genes. b, Logarithmic-scale distribution of isolates carrying loss-of-function mutations for core (n = 4,931) and variable ORFs (n = 1,111). The core genome is characterized by far fewer loss-of-function mutations compared to variable ORFs (P value = 6.45 × 10−78, two-sided Mann–Whitney–Wilcoxon test). Centre lines, median; boxes, IQR; whiskers, 1.5 × IQR. Data points beyond the whiskers are outliers. c, Different types of variable ORFs have marked differences in distribution.
Fig. 5
Fig. 5. Landscape of loss-of-heterozygosity events.
Density of the regions under LOH across the 16 nuclear chromosomes (I–XVI) within our population. Each colour corresponds to a chromosome, and centromere locations are represented by dotted lines.
Fig. 6
Fig. 6. Genotype–phenotype relationship in S. cerevisiae.
a, Narrow-sense heritability (blue) and phenotypic variance explained (yellow) for phenotypes with associated variants. b, Association scores of the detected genetic variants across the 16 chromosomes and the non-reference ORFs. c, Variance explained by CNVs and SNPs associated with traits. Association scores and variance explained are higher for CNVs compared to SNPs (P value = 0.00579, two-sided Mann–Whitney–Wilcoxon test). Centre lines, median; boxes, IQR; whiskers, 1.5 × IQR. Data points beyond the whiskers are outliers.

References

    1. Botstein D, Fink GR. Yeast: an experimental organism for 21st century biology. Genetics. 2011;189:695–704. doi: 10.1534/genetics.111.130765. - DOI - PMC - PubMed
    1. Goffeau A, et al. Life with 6000 genes. Science. 1996;274:546–567. doi: 10.1126/science.274.5287.546. - DOI - PubMed
    1. Schacherer J, Shapiro JA, Ruderfer DM, Kruglyak L. Comprehensive polymorphism survey elucidates population structure of Saccharomyces cerevisiae. Nature. 2009;458:342–345. doi: 10.1038/nature07670. - DOI - PMC - PubMed
    1. Liti G, et al. Population genomics of domestic and wild yeasts. Nature. 2009;458:337–341. doi: 10.1038/nature07743. - DOI - PMC - PubMed
    1. Peter J, Schacherer J. Population genomics of yeasts: towards a comprehensive view across a broad evolutionary scale. Yeast. 2016;33:73–81. doi: 10.1002/yea.3142. - DOI - PubMed

Publication types

MeSH terms