. 2018 Apr;556(7701):332-338.
doi: 10.1038/s41586-018-0023-4. Epub 2018 Apr 11.

Innate immune memory in the brain shapes neurological disease hallmarks

Affiliations

Innate immune memory in the brain shapes neurological disease hallmarks

Ann-Christin Wendeln et al. Nature. 2018 Apr.

Abstract

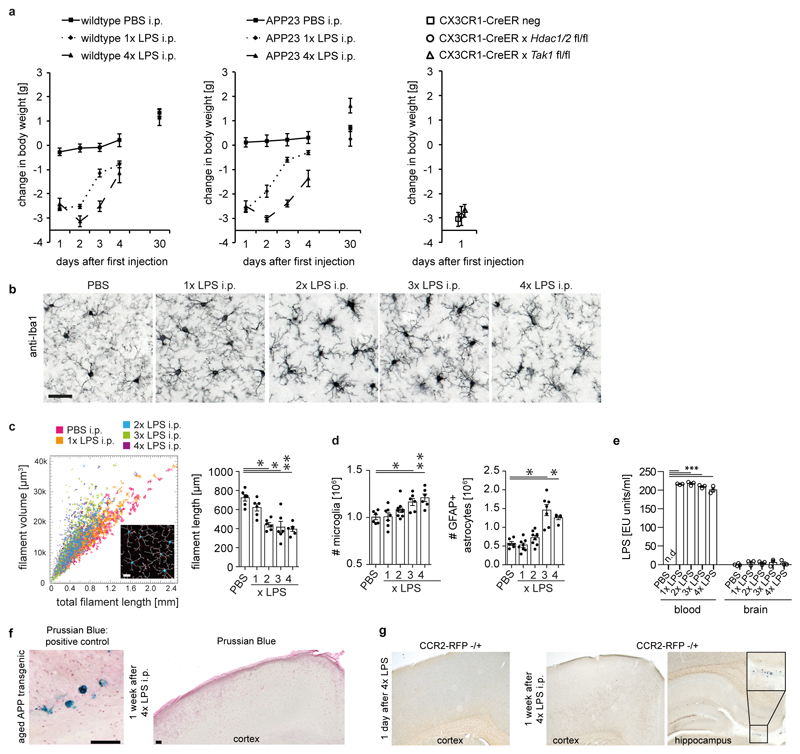
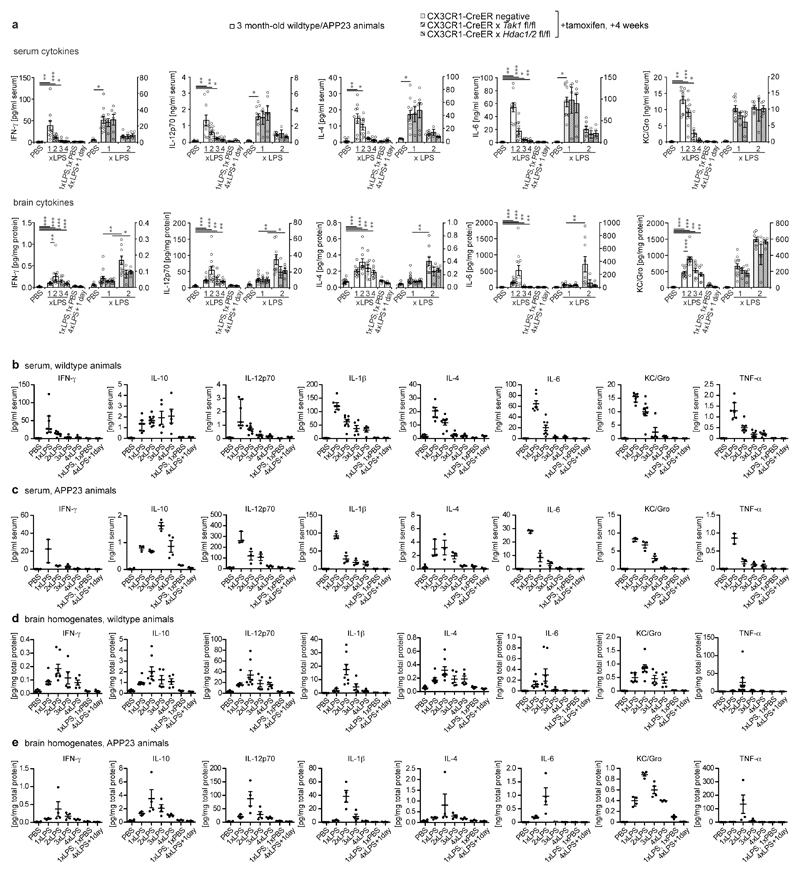
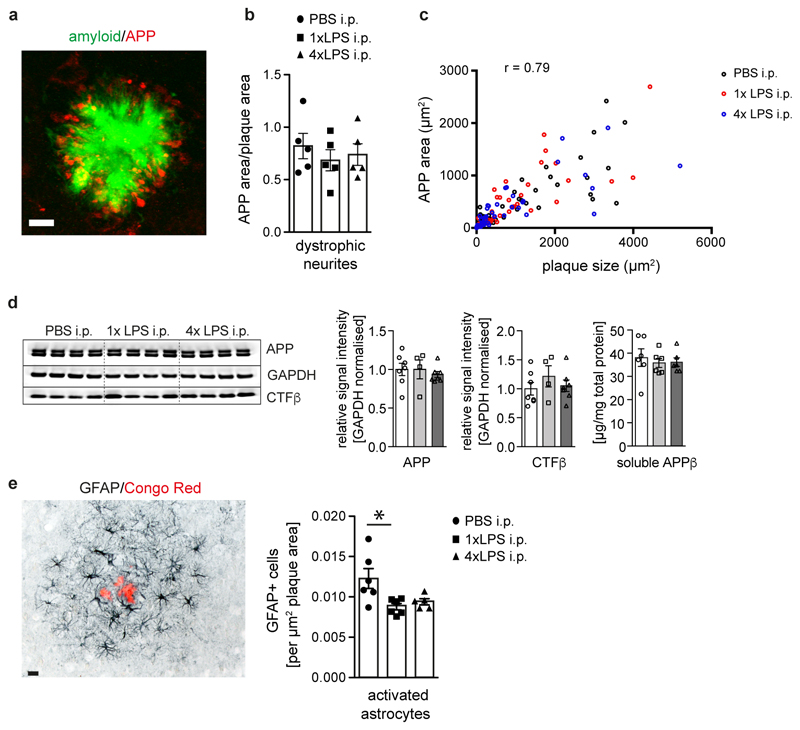
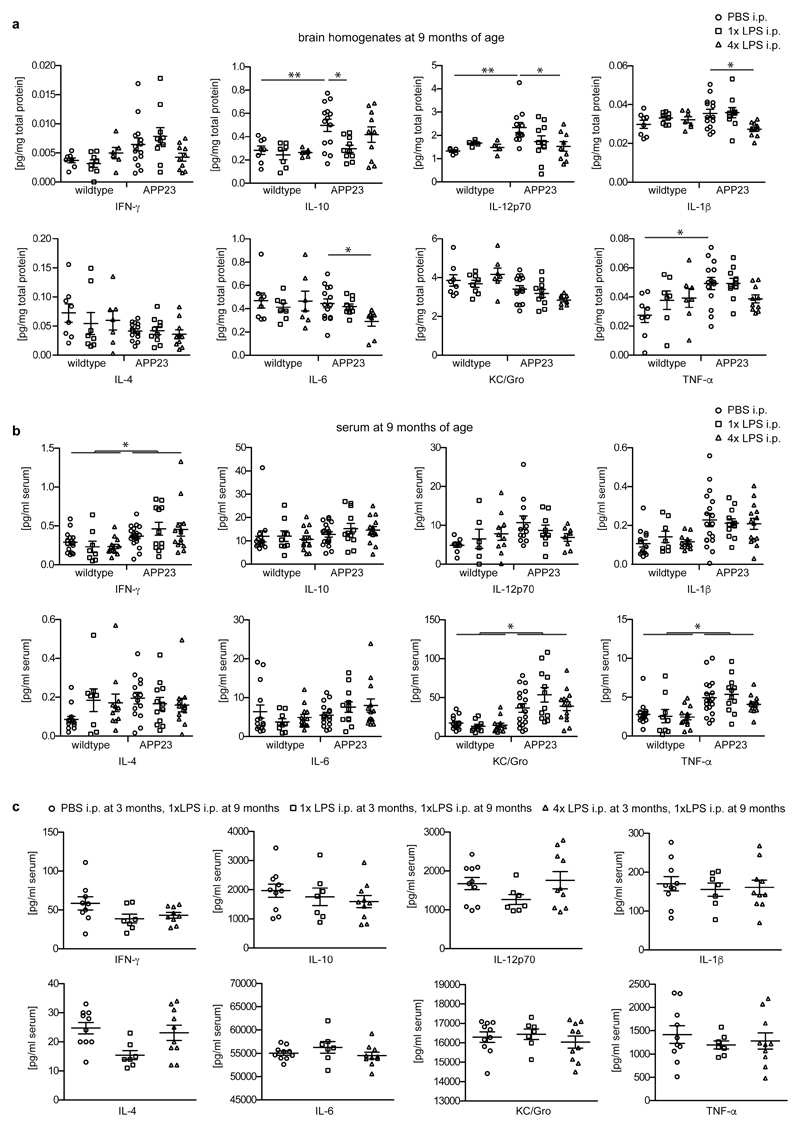
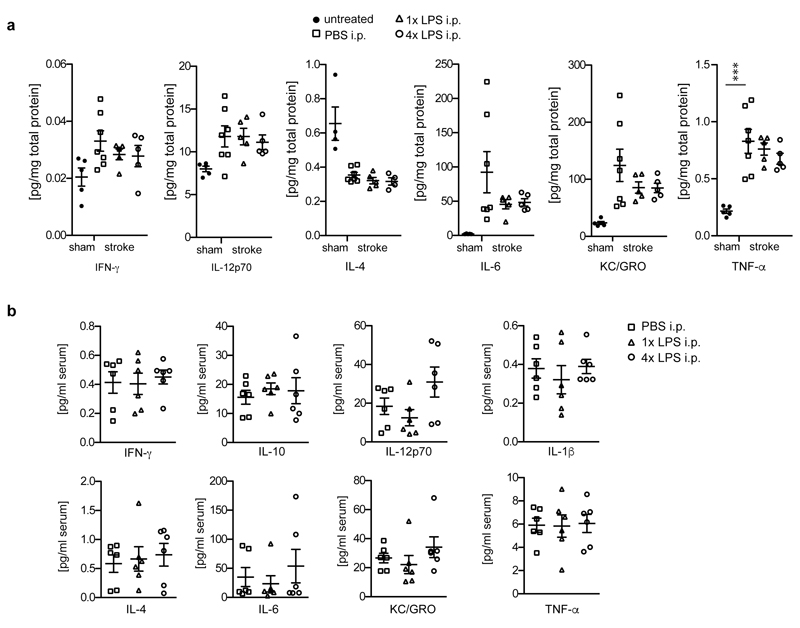
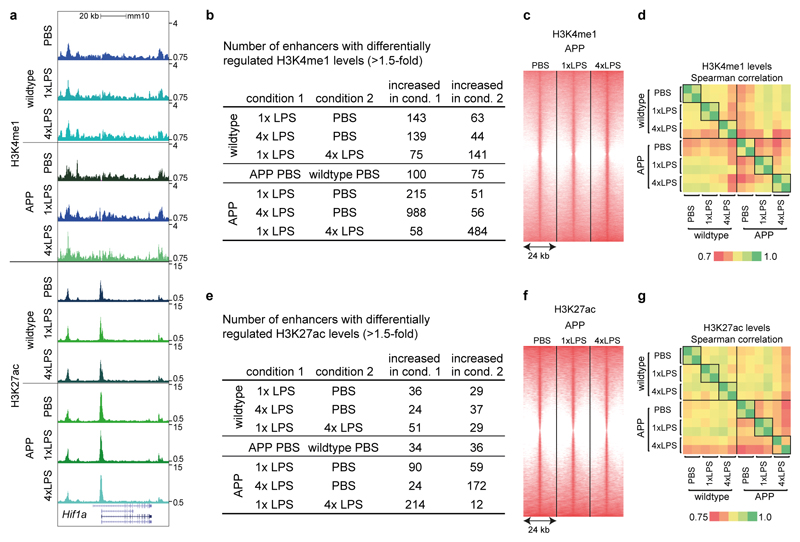
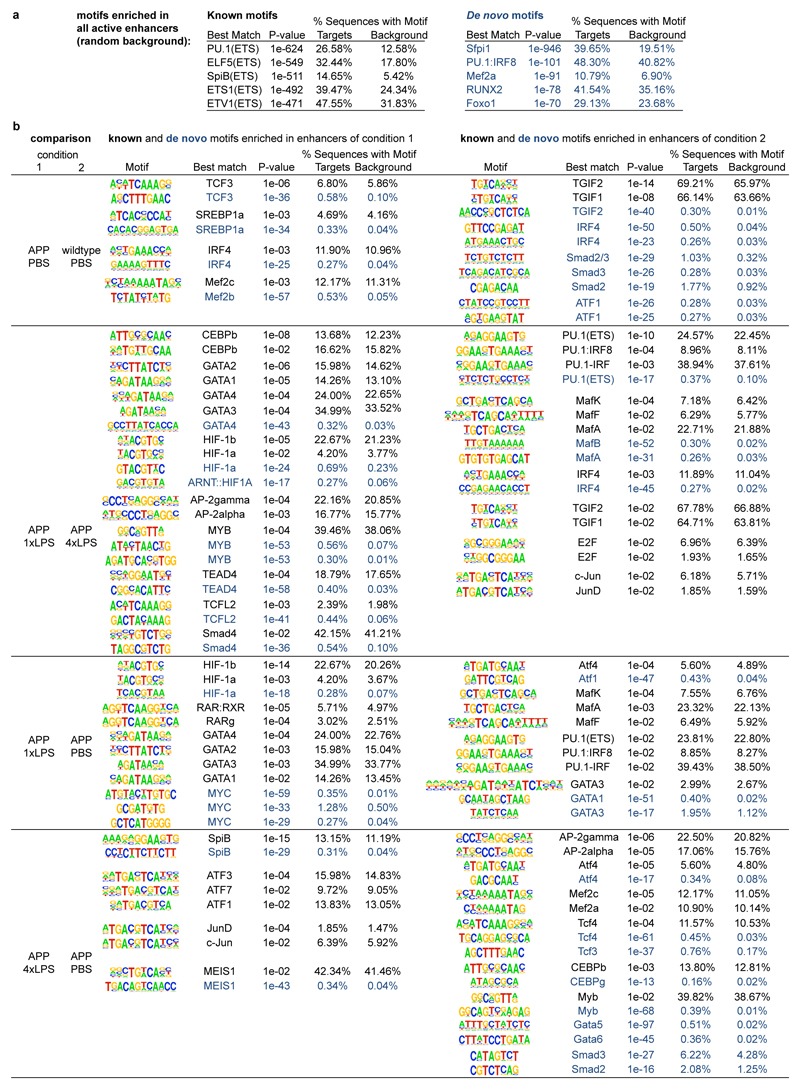
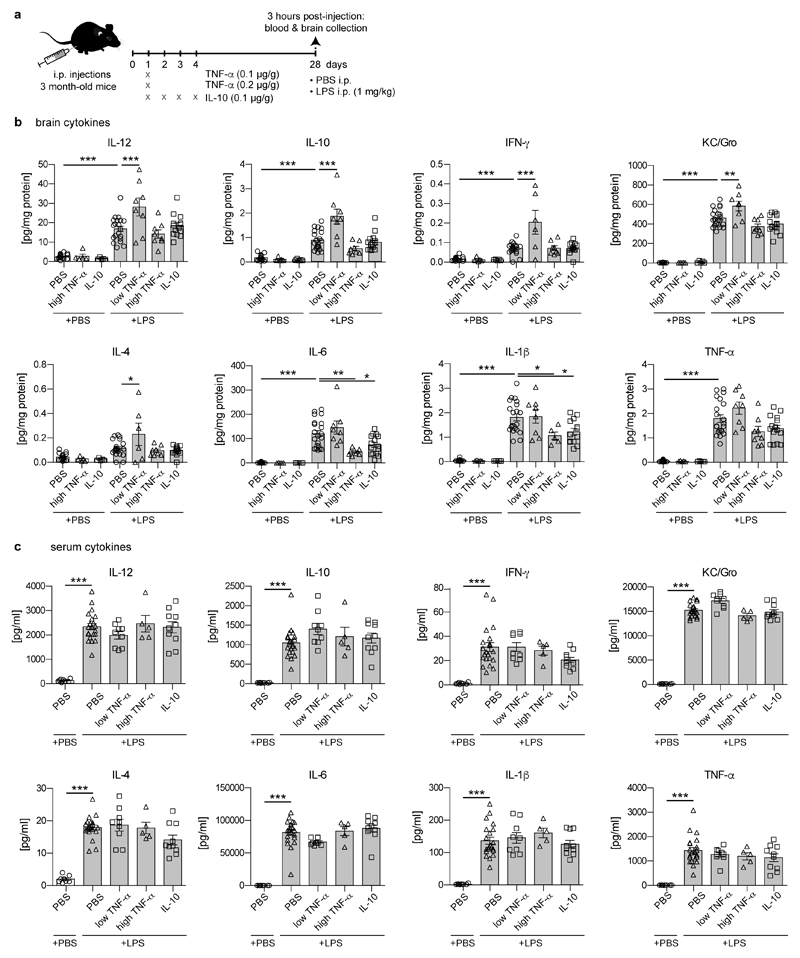
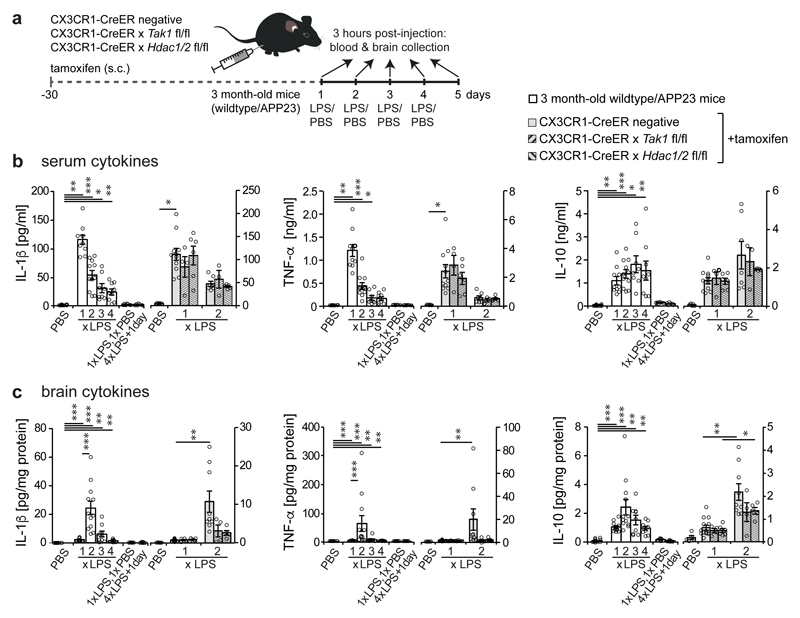
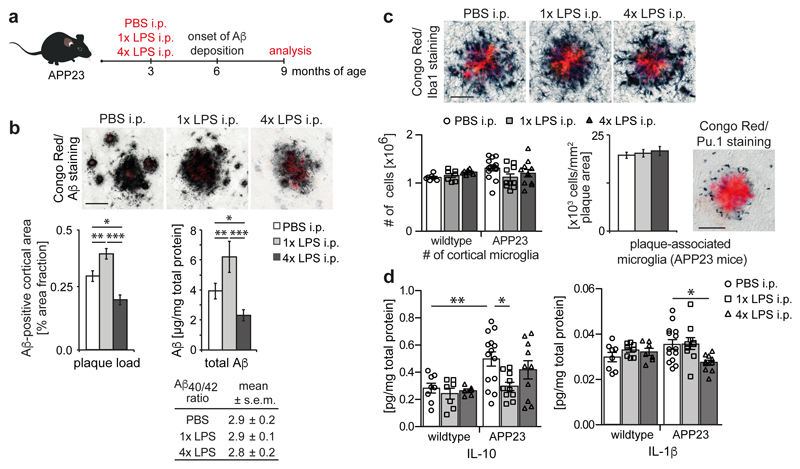
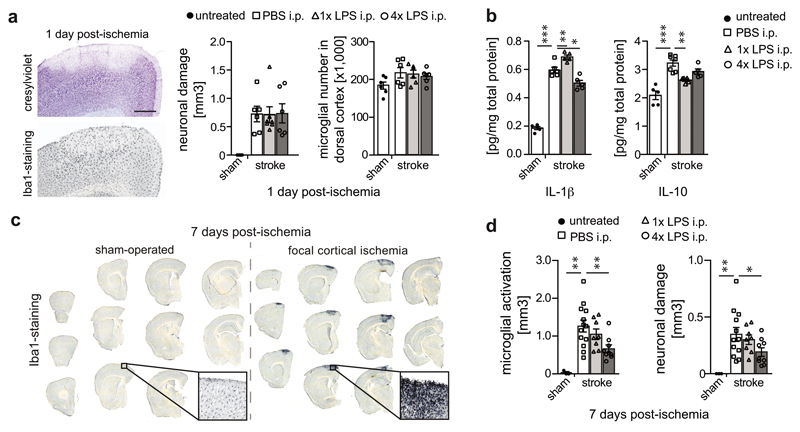
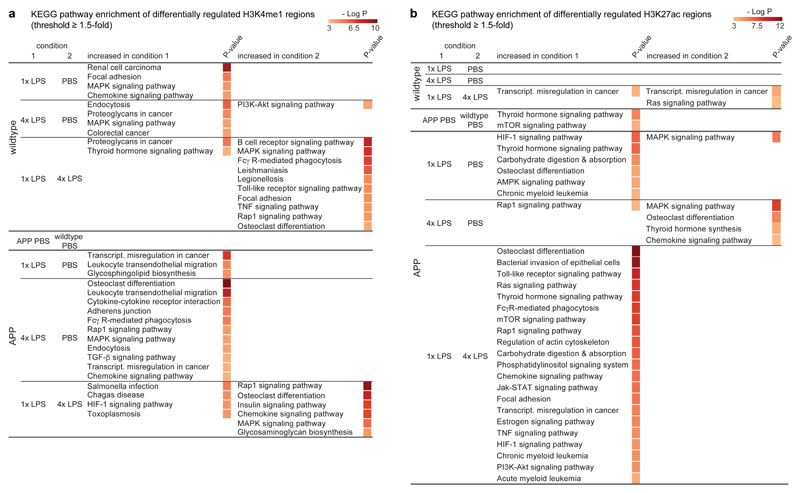
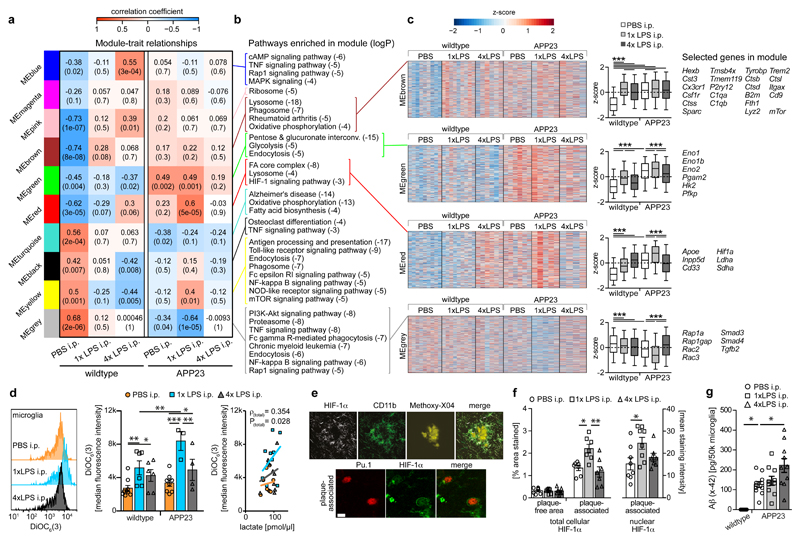
Innate immune memory is a vital mechanism of myeloid cell plasticity that occurs in response to environmental stimuli and alters subsequent immune responses. Two types of immunological imprinting can be distinguished-training and tolerance. These are epigenetically mediated and enhance or suppress subsequent inflammation, respectively. Whether immune memory occurs in tissue-resident macrophages in vivo and how it may affect pathology remains largely unknown. Here we demonstrate that peripherally applied inflammatory stimuli induce acute immune training and tolerance in the brain and lead to differential epigenetic reprogramming of brain-resident macrophages (microglia) that persists for at least six months. Strikingly, in a mouse model of Alzheimer's pathology, immune training exacerbates cerebral β-amyloidosis and immune tolerance alleviates it; similarly, peripheral immune stimulation modifies pathological features after stroke. Our results identify immune memory in the brain as an important modifier of neuropathology.


Conflict of interest statement

Author Information:

The authors have no competing financial interests.

Figures

Extended Data Figure 1
Extended Data Figure 1. Acute responses to LPS injections.
a, Weight changes after injection of lipopolysaccharides (LPS) (wildtype animals: n=11,11,11,11,4 for PBS, n=9,9,9,8,7 for 1xLPS, n=10,10,10,10,7 for 4xLPS; APP animals: n=14,14,14,14,7 for PBS, n=8,8,8,5,5 for 1xLPS; n=10,10,10,10,10 for 4xLPS; Cre animals n=5,5,4). b/c, Morphological changes in microglia (n=6,6,6,6,6 animals). Scale bar: 50 µm. d, Numbers of microglia and activated (GFAP+) astrocytes (microglia n=6,7,8,6,6 animals, astrocytes n=6,8,9,7,5 animals). e, Blood and brain levels of LPS after daily injections with 500 µg/kg bodyweight (n=4,3,3,3,3 animals). f, Assessment of iron entry from the blood (detected by Prussian Blue staining) shows positive staining in an aged (>25 months) APP transgenic animal, but not after repeated intraperitoneal LPS injections (n=3 mice analysed). g, In mice expressing red fluorescent protein (RFP) under the 'type 2 CC chemokine receptor’ (Ccr2) promoter, no entry of CCR2-expressing blood monocytes is detected after repeated LPS injection (staining for RFP; insert shows RFP-positive monocytes in the choroid plexus; n=3 mice analysed). Scale bar: 100 µm. Data are means±s.e.m. */**/*** P <0.05/0.01/ 0.001 for one-way ANOVA with Tukey correction.
Extended Data Figure 2
Extended Data Figure 2. Cytokine response after acute LPS injections.
a, Additional cytokines (cp. Fig.1) analysed in the serum (top) and brain (bottom) 3h after each daily intraperitoneal lipopolysaccharide (LPS) injection on four consecutive days in 3-month-old mice (control animals received PBS injections; n=16,11,12,9,9,7,7 | 5,13,4,6,9,4,5 mice for groups from left to right). b/c, Cytokine response in the blood only in wildtype (b, n=6,7,8,5,5,3,3 animals) or APP23 (c, n=10,3,3,3,4,3,3 animals) mice. d/e, Cytokine response in the brain only in wildtype (d, n=6,7,8,5,5,3,3 animals) or APP23 (e, n=10,4,4,4,4,4,4 animals) mice. Data are means± s.e.m. */**/*** P <0.05/0.01/ 0.001 for independent-samples median test with correction for multiple comparisons.
Extended Data Figure 3
Extended Data Figure 3. APP levels and processing, neuritic dystrophy and astrocyte activation in 9-month-old APP23 animals.
a/b, Micrograph of fluorescent staining for amyloid plaque (Methoxy-X04; green) and amyloid precursor protein (APP; red) shows neuritic dystrophy surrounding the amyloid deposit, which is unchanged by LPS treatments (b; n=5,5,5 animals). c, Overall Pearson’s correlation of plaque size with neuritic dystrophy (‘APP area’; n=49,39,42 plaques for PBS/1xLPS/4xLPS groups). d, Western Blotting analysis (for gel source data, see Supplementary Figure 1) of brain homogenates for amyloid precursor protein (APP) and C-terminal fragment-β (CTFβ; n=7,4,7 animals), and soluble APPβ ELISA (n=6,6,6 animals). e, Micrograph of activated astrocytes (glial fibrillar acidic protein: GFAP) surrounding an amyloid plaque (Congo Red) and quantification of the number of plaque-associated GFAP-positive astrocytes (n=6,6,5 animals). Scale bar: 10 µm in (a), 20 µm in (e). Data are means±s.e.m. * P <0.05 for one-way ANOVA with Tukey correction.
Extended Data Figure 4
Extended Data Figure 4. Cytokine levels in 9-month-old animals
a, Cytokine measurements in brain homogenates of 9-month-old wildtype (n=8,8,7 animals) and APP23 (n=14,10,10 animals) mice treated i.p. with 1x or 4xLPS at 3 months of age. b, Cytokine measurements in the serum of 9-month-old wildtype (WT; n=14,9,13 animals) and APP23 (APP; n=18,12,14 animals) mice after i.p. stimulation with 1x or 4xLPS at 3 months of age. c, Cytokine measurements in the serum of wildtype animals stimulated i.p. with 1x or 4xLPS at 3 months of age and re-stimulated with an additional LPS injection (500 µg/kg) at 9 months of age (n=10,7,10 animals). Data are means±s.e.m. */** P <0.05/0.01 for two-way ANOVA with Tukey correction. In (b) a significant main effect for genotype is indicated by bars spanning all conditions of the same genotype.
Extended Data Figure 5
Extended Data Figure 5. Cytokine levels after brain ischemia and in blood of 4-month-old animals.
Three-month-old animals were i.p. injected with 1x or 4xLPS and incubated for 4 weeks before receiving a stroke. a, Cytokine measurements in brain homogenates 24h after stroke (n=5,7,5,5 animals). b, Cytokine measurements in the serum (n=6,6,6 animals). Data are means±s.e.m. *** P<0.001 for one-way ANOVA with Tukey correction.
Extended Data Figure 6
Extended Data Figure 6. Microglial sorting strategy.
Microglia were sorted as CD11bhigh and CD45low cells (population P4) from 9-month-old APP23 animals or wildtype littermates following i.p. injections of 1x or 4xLPS at 3 months of age.
Extended Data Figure 7
Extended Data Figure 7. Analysis of microglial enhancers.
Microglial enhancers were analysed in 9-month-old wildtype and APP23 (APP) mice treated intraperitoneally with 1x or 4xLPS at 3 months of age. a, Exemplary UCSC browser images of genomic region around the Hif1a gene (normalised to input and library dimension). b, Numbers of regions with differentially regulated H3K4me1 levels. c, Heatmaps of H3K4me1 regions (centred on H3K27ac peaks). d, Pairwise correlations between the two replicates of H3K4me1 read densities in differentially regulated regions. e-g, Analyses of H3K27ac levels analogous to (b-d) for H3K4me1. n=2 replicates (8-10 animals/replicate); differential enhancers showed a cumulative Poisson P-value <0.0001; Benjamini-Hochberg correction was applied for pathway enrichment.
Extended Data Figure 8
Extended Data Figure 8. Transcription factor motif analysis of active enhancer regions.
Motif analysis was performed for selected conditions to identify transcription factors involved in the differential activation of enhancers (using putative enhancer regions present in both replicates within 500 bp around enhancer peaks). a, For all active enhancers, motif analysis was performed using the union H3K27ac peak file and standard background (random genomic sequence). b, Pairwise comparisons between conditions, using the first condition’s H3K27ac peak file as input and the second condition’s peak file as background. As motif enrichment was often relatively low, the analysis was focussed on transcription factor (families), whose motifs occurred at least twice in ‘known’ (black) and ‘de-novo’ motifs (blue). Motifs are identified by HOMER software using hypergeometric testing (no adjustment for multiple comparisons was made).
Extended Data Figure 9
Extended Data Figure 9. Peripherally applied cytokines induce immune memory in the brain.
a, Experimental design. b, Cytokine responses in the brain, four weeks after peripheral cytokine application (n=17,5,5,21,8,8,15 animals). Note that TNF-α dose-dependently enhances (low dose) or decreases (high dose) certain cytokines. Similar to high dose TNF-α, certain cytokines are also reduced by peripheral application of IL-10 four weeks earlier. c, Cytokine responses in the periphery are unaffected (n=8,21,9,5,10 animals). Data are means±s.e.m. */**/*** P<0.05/0.01/0.001 for one-way ANOVA with Tukey correction.
Figure 1
Figure 1. Peripheral immune stimulation evokes immune memory in microglia.
a, Experimental approach. b, White bars: Peripheral cytokine levels in wildtype/APP23 animals following lipopolysaccharide (LPS) injections. Note that tolerance is induced with repeated injections. c, Brain cytokine levels: 2xLPS amplifies IL-1β/TNF-α release, demonstrating immune training; tolerance occurs with 3x/4xLPS. Cytokines return to baseline within 24h (1xLPS,1xPBS/4xLPS+1day). Grey bars: Microglia-specific knockout of Tak1 or Hdac1/2 selectively prevents immune training in the brain. In (b/c) n=16,11,12,9,9,7,7 | 5,13,4,6,9,4,5 from left to right. */**/***P <0.05/ 0.01/0.001 for independent-samples median test with correction for multiple comparisons. Data are means±s.e.m.
Figure 2
Figure 2. Cerebral β-amyloidosis is altered after peripheral immune stimulation.
a, Experimental design. b, Analysis of cortical amyloid-β plaque load (n=22,10,10 animals) and protein levels (n=14,10,10 animals). c, Analysis of total cortical and plaque-associated microglia (n=7,7,7,14,10,10 animals) and d, cytokine levels of IL-10 and IL-1β in wildtype and APP23 mice (n=8,8,7 and n=14,10,10 animals). Scale bar: 50 µm. */**/***P <0.05/0.01/ 0.001 for one-way (b) and two-way ANOVA (c/d) with Tukey correction. Data are means ± s.e.m.
Figure 3
Figure 3. Stroke pathology is altered after peripheral immune stimulation.
Pathological features of brain ischemia induced one month after intraperitoneal injection with 1x or 4xLPS. a, Neuronal damage (cresylviolet, n=6,6,7,6 animals), microglial numbers (Iba1-positive, n=6,6,6 animals) and b, cytokine profiles one day post-ischemia (n=5,7,5,5 animals). c, Overview of microglial activation in the infarct and d, quantification of neuronal damage and microglial activation seven days post-ischemia (n=3,13,8,9 animals). Scale bar: 500 µm. */**/*** P <0.05/0.01/ 0.001 for one-way ANOVA with Tukey correction. Data are means ± s.e.m.
Figure 4
Figure 4. The microglial enhancer repertoire 6 months after immune stimulation.
Pathway enrichment of enhancers (with Benjamini-Hochberg correction) with differentially regulated H3K4me1 (a) and H3K27ac (b) levels (based on nearest gene; cumulative Poisson P-value <0.0001). n=2 replicates (8-10 animals/replicate).
Figure 5
Figure 5. Microglial gene expression and function 6 months after immune stimulation.
a, Weighted gene correlation network analysis (top: correlation coefficient; bottom: P-value; n=9,9,6,6,5,4 animals). b, Selected KEGG pathways enriched in modules. c, Heatmaps of genes within modules, z-scores (boxplot whiskers: 5-95th percentile; n=1601,990,949,3543 genes in modules) and selected genes. d, Microglial mitochondrial membrane potential (left/middle; n=9,6,6,8,3,4 animals) and Pearson’s correlation with lactate release (right; n=11,10,10 animals). e, Staining for top: HIF-1α, microglia (CD11b) and amyloid plaques (Methoxy-X04) and bottom: HIF-1α and microglial nuclei (Pu.1; single confocal plane) in brain sections from 9-month-old animals. Scale bars: 20/5 µm (top/bottom). f, Total cellular (n=7,7,7 animals) and nuclear (n=8,8,7 animals) HIF-1α staining intensity. g, Microglial Aβ content (n=5,11,10,10 animals). */**/*** P<0.05/0.01/0.001 for one-way ANOVA with Tukey correction. Data are means±s.e.m.

Comment in

  • Immune memory in the brain.
    Nott A, Glass CK. Nott A, et al. Nature. 2018 Apr;556(7701):312-313. doi: 10.1038/d41586-018-03800-6. Nature. 2018. PMID: 29662132 No abstract available.
  • Microglial memory.
    Bird L. Bird L. Nat Rev Immunol. 2018 Jun;18(6):358-359. doi: 10.1038/s41577-018-0015-5. Nat Rev Immunol. 2018. PMID: 29713017 No abstract available.
  • Trained Microglia Trigger Memory Loss.
    Lelios I, Greter M. Lelios I, et al. Immunity. 2018 May 15;48(5):849-851. doi: 10.1016/j.immuni.2018.04.033. Immunity. 2018. PMID: 29768172
  • Training neuropathology.
    Stower H. Stower H. Nat Med. 2018 Jun;24(6):702. doi: 10.1038/s41591-018-0076-9. Nat Med. 2018. PMID: 29875460 No abstract available.

References

    1. Netea MG, Latz E, Mills KHG, O'Neill LAJ. Innate immune memory: a paradigm shift in understanding host defense. Nature Immunology. 2015;16:675–679. - PubMed
    1. Netea MG, et al. Trained immunity: A program of innate immune memory in health and disease. Science. 2016;352 aaf1098. - PMC - PubMed
    1. Saeed S, et al. Epigenetic programming of monocyte-to-macrophage differentiation and trained innate immunity. Science. 2014;345 1251086. - PMC - PubMed
    1. Cheng SC, et al. mTOR- and HIF-1 -mediated aerobic glycolysis as metabolic basis for trained immunity. Science. 2014;345 1250684–1250684. - PMC - PubMed
    1. Biswas SK, Lopez-Collazo E. Endotoxin tolerance: new mechanisms, molecules and clinical significance. Trends in Immunology. 2009;30:475–487. - PubMed

Publication types

MeSH terms