. 2018 Mar 28:9:405.
doi: 10.3389/fpls.2018.00405. eCollection 2018.

Mutation in Rice Abscisic Acid2 Results in Cell Death, Enhanced Disease-Resistance, Altered Seed Dormancy and Development

Affiliations

Mutation in Rice Abscisic Acid2 Results in Cell Death, Enhanced Disease-Resistance, Altered Seed Dormancy and Development

Yongxiang Liao et al. Front Plant Sci. .

Abstract

Lesion mimic mutants display spontaneous cell death, and thus are valuable for understanding the molecular mechanism of cell death and disease resistance. Although a lot of such mutants have been characterized in rice, the relationship between lesion formation and abscisic acid (ABA) synthesis pathway is not reported. In the present study, we identified a rice mutant, lesion mimic mutant 9150 (lmm9150), exhibiting spontaneous cell death, pre-harvest sprouting, enhanced growth, and resistance to rice bacterial and blast diseases. Cell death in the mutant was accompanied with excessive accumulation of H2O2. Enhanced disease resistance was associated with cell death and upregulation of defense-related genes. Map-based cloning identified a G-to-A point mutation resulting in a D-to-N substitution at the amino acid position 110 of OsABA2 (LOC_Os03g59610) in lmm9150. Knock-out of OsABA2 through CRISPR/Cas9 led to phenotypes similar to those of lmm9150. Consistent with the function of OsABA2 in ABA biosynthesis, ABA level in the lmm9150 mutant was significantly reduced. Moreover, exogenous application of ABA could rescue all the mutant phenotypes of lmm9150. Taken together, our data linked ABA deficiency to cell death and provided insight into the role of ABA in rice disease resistance.

Keywords: ABA/GA ratio; Oryza sativa L.; abscisic acid; defense responses; gibberellin; lesion mimic mutant; pre-harvest sprouting; xanthoxin dehydrogenase.


Figures

FIGURE 1
FIGURE 1
Phenotypic characterizations of lmm9150 mutant. (A) Comparison of four leaves between wild type (WT) and lmm9150 mutant shows the lesion mimic spots of lmm9150 at seedling stage. The numbers 1, 2, 3, and 4 represent the first top leaf, the second top leaf, the third top leaf, and the fourth top leaf, respectively. (B) The lmm9150 displays pre-harvest sprouting at yellow mature stage in the paddy field. (C–E) Quantification analyses on pre-harvest sprouting rates (C), plant height (D), and flag leaf length (E), respectively. Data were obtained from 10 main panicles of plants (C), 10 plants (D), and 10 flag leaves of main panicles (E). Statistical analysis was performed using Student’s t-test, ∗∗ indicates P < 0.01. Scale bar: 2 cm in (A,B).
FIGURE 2
FIGURE 2
Observation of cell death in wild type (WT) and lmm9150 mutant. (A–C) Representative leaf sections of WT and lmm9150 mutant (MT) show lesions (A), dead cells revealed by trypan blue staining (B), and H2O2 accumulation revealed by 3,3′-diaminobenzidine (DAB) staining (C) in the mutant, respectively. The lmm9150 mutant and WT leaf samples were collected at 30 days after sowing. Scale bar: 1 cm.
FIGURE 3
FIGURE 3
Comparison of the chlorophylls content between wild type (WT) and lmm9150 mutant. (A,B) The content of Chlorophyll a (chl a) and chlorophyll b (chl b) shows reduction in lmm9150 in comparison with WT. Mean and SD were obtained from three measurements. Statistical analysis was performed using Student’s t-test, and ∗∗ represents P < 0.05 and P < 0.01, respectively.
FIGURE 4
FIGURE 4
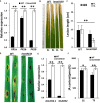
Determination of wild type (WT) and lmm9150 plants resistance to bacterial blight and rice blast diseases. (A) Quantitative reverse-transcription PCR (qRT-PCR) data show the relative expression levels of pathogenesis-related (PR) genes in lmm9150 and WT. Mean and SD were obtained from three measurements. (B,C) The disease lesion leaves of WT and lmm9150 mutant were inoculated with Xanthomonas oryzae pv. oryzae (Xoo) strain, 8428, at 15 days post-inoculation. The image (C) shows that the disease lesions of WT are longer than that of lmm9150 and the flag leaf disease lesions of lmm9150 are longer than that of the second leaf of mutant. FL: the flag leaf; SL: the second leaf. Data were obtained from 20 leaves of main panicles. (D) The disease lesions of leaves of WT and lmm9150 mutant were inoculated 5 days post-inoculation with Magnaporthe oryzae (M. oryzae) strain, ZhongI. The experiments were repeated twice with similar results. (E) Quantitative reverse-transcription PCR (qRT-PCR) data show the relative expression levels of jasmonic acid (JA) biosynthesis-related genes in lmm9150 and WT. (F) Comparison of JA content in leaf of WT and lmm9150 mutant. The content of hormone was tested by enzyme-linked immunosorbent assay (ELISA) method. Mean and SD were obtained from three measurements (E,F). The housekeeping gene Ubiquitin5 (Ubq5) was used as control. Statistical analysis was performed using Student’s t-test, and ∗∗ indicate P < 0.05 and P < 0.01, respectively. Scale bar: 1 cm in (D).
FIGURE 5
FIGURE 5
Positional cloning of OsABA2. (A) The OsABA2 gene is located on chromosome 3 between InDel marker I403.1 and SSR marker RM7389. (B) The OsABA2 gene is delimited to the region between I403.3 and RM3684 using 164 F2 mutant individuals. (C) The gene structure of OsABA2. Two exons and one intron are indicated by green rectangles and black lines, respectively; a G-to-A base substitution at the 1487th base was detected in the second exon (red arrow) leading to the change of Aspartic acid (Asp) to Asparagine (Asn) at the 110th amino acid.
FIGURE 6
FIGURE 6
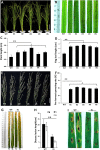
Phenotypic characterizations of T1 knockout lines. (A) The plant of the wild type (WT) and 5 T1 knockout lines. The mutations of #1, #3, #4, and #5 knockout lines are deletions. The mutation of #2 knockout line is insertion. (B) 5 knockout lines displays lesion mimic spots on leaves at tillering stage. (C) Comparison of plant height between WT and 5 knockout lines. (D) Comparison of flag leaf length between WT and 5 knockout lines. (E) The panicles for 30 days after flowering were collected and cultivated 3 days, at 28°C. All knockout lines display pre-harvest spouting. (F) Comparison of the pre-harvest sprouting rates between WT and 5 knockout lines 30 days after flowering under natural condition. (G,H) The disease lesion of leaves of WT and #3 knockout line were inoculated with Xanthomonas oryzae pv. oryzae (Xoo) strain, P6, at 15 days post-inoculation. KL: knockout lines; FL: the flag leaf; SL: the second leaf. Data were obtained from 10 plants (C), 10 flag leaves of main panicles (D), 15 main panicles (F), and 20 leaves of main panicles (H). (I) The disease lesions of leaves of WT and #3 knockout line was inoculated 5 days post-inoculation with Magnaporthe oryzae (M. oryzae) strain, ZhongI. The experiments were repeated twice with similar results. Scale bar: 15 cm in (A), 5 cm in (E), 1 cm in (I). Statistical analysis was performed using Student’s t-test, ∗∗ indicates P < 0.01.
FIGURE 7
FIGURE 7
Comparison of xanthoxin dehydrogenase (XanDH) activity and abscisic acid (ABA) contents between wild type (WT) and lmm9150 mutant. (A) Changes of XanDH activity in the leaf of WT and the lmm9150 mutant. SS: seedling stage; TS: tillering stage; MS: mature stage. (B–D) Comparison of ABA contents in the leaves (B), seeds (C), and stems (D) between WT and the lmm9150 mutant at different developmental stages. Hormone content was tested using enzyme-linked immunosorbent assay (ELISA) method. MRS: milk ripe stage; DS: dough stage; YMS: yellow mature stage. (E) The ratio of ABA/GA content in seed of WT and the lmm9150 mutant 30 days after flowering. (F) The germination rate of lmm9150 mutant and WT 30 days after flowering. Mean and SD were obtained from three replicates. Statistical analysis was performed using Student’s t-test, and ∗∗ indicates P < 0.05 and P < 0.01, respectively.
FIGURE 8
FIGURE 8
Analysis of relationship between abscisic acid (ABA) and plant development in lmm9150 mutant. (A–D) Phenotypic changes in the leaf blades of wild type (WT) and lmm9150 after ABA-treatment. The lmm9150 shows lesion mimic spots without ABA-treatment (A,B) and phenotype of the lmm9150 mutant is similar to WT when lmm9150 was treated with 100 μmol/L ABA for 15 days (C,D). The numbers 1–4 represent the first top leaf, the second top leaf, the third top leaf, and the fourth top leaf, respectively. (E–H) Change of plant height of lmm9150 mutant and WT 20 days after ABA-treatment at seedling stage. Images show that the plant height of lmm9150 and WT after water treatment (E,F) and ABA-treatment (G,H), respectively. The experiments were repeated twice with similar results (A–D,E,G). Data were obtained from 10 seedlings (F,H). (I) Comparison of seed germination rate in WT and lmm9150 mutant with 10 μmol/L ABA. Mean was obtained from three replicates. Statistical analysis was performed using Student’s t-test, ∗∗ indicate P < 0.01.

Similar articles

Cited by

References

    1. Agrawal G. K., Yamazaki M., Kobayashi M., Hirochika R., Miyao A., Hirochika H. (2001). Screening of the rice viviparous mutants generated by endogenous retrotransposon Tos17 insertion. Tagging of a zeaxanthin epoxidase gene and a novel OsTATC gene. Plant Physiol. 125 1248–1257. 10.1104/pp.125.3.1248 - DOI - PMC - PubMed
    1. Anderson J., Badruzsaufari E., Schenk P. M., Manners J. M., Desmond O. J., Ehlert C. (2004). Antagonistic interaction between abscisic acid and jasmonate-ethylene signaling pathways modulates defense gene expression and disease resistance in Arabidopsis. Plant Cell 16 3460–3479. 10.1105/tpc.104.025833 - DOI - PMC - PubMed
    1. Asselbergh B., Achuo A., Höfte M., Van Frederique G. (2008). Abscisic acid deficiency leads to rapid activation of tomato defense responses upon infection with Erwinia chrysanthemi. Mol. Plant Pathol. 9 11–24. 10.1111/J.1364-3703.2007.00437.X - DOI - PMC - PubMed
    1. Bari R., Jones J. G. (2009). Role of plant hormones in plant defence responses. Plant Mol. Biol. 69 473–488. 10.1007/s11103-008-9435-0 - DOI - PubMed
    1. Bethke P. C., Lonsdale J. E., Fath A., Jones R. L. (1999). Hormonally regulated programmed cell death in barley aleurone cells. Plant Cell 11 1033–1046. 10.2307/3870796 - DOI - PMC - PubMed