. 2018 Apr 10:10:48.
doi: 10.1186/s13148-018-0482-3. eCollection 2018.

Competing endogenous RNA expression profiling in pre-eclampsia identifies hsa_circ_0036877 as a potential novel blood biomarker for early pre-eclampsia

Affiliations

Competing endogenous RNA expression profiling in pre-eclampsia identifies hsa_circ_0036877 as a potential novel blood biomarker for early pre-eclampsia

Xiaopeng Hu et al. Clin Epigenetics. .

Abstract

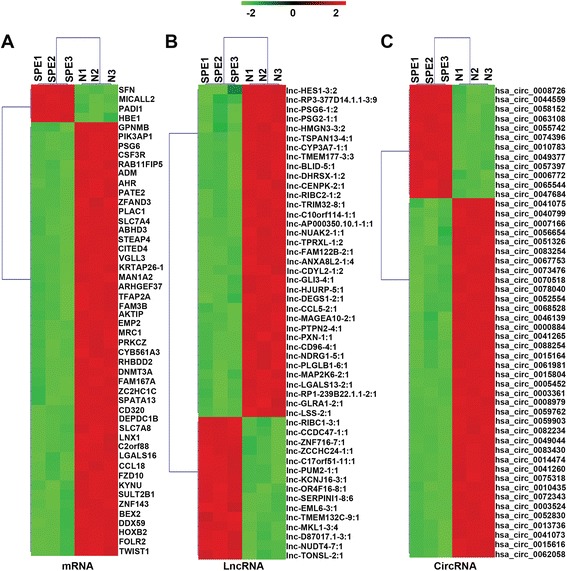
Background: The etiology and pathogenesis of pre-eclampsia (PE) is unclear, and there is no ideal early clinical biomarker for prediction of PE. The competing endogenous RNA (ceRNA) hypothesis is a new approach to uncover the molecular pathology of PE. The first aim of this study was to perform messenger RNA, long non-coding RNA, and circular RNA (circRNA) expression profiling of human normal and severe pre-eclampsia (SPE) placentas. circRNA, which has a stable structure, is a more suitable biomarker than other types of RNA. Therefore, the second aim of our study was to select some differentially expressed circRNAs in PE placentas as early clinical biomarkers of PE in blood circulation.

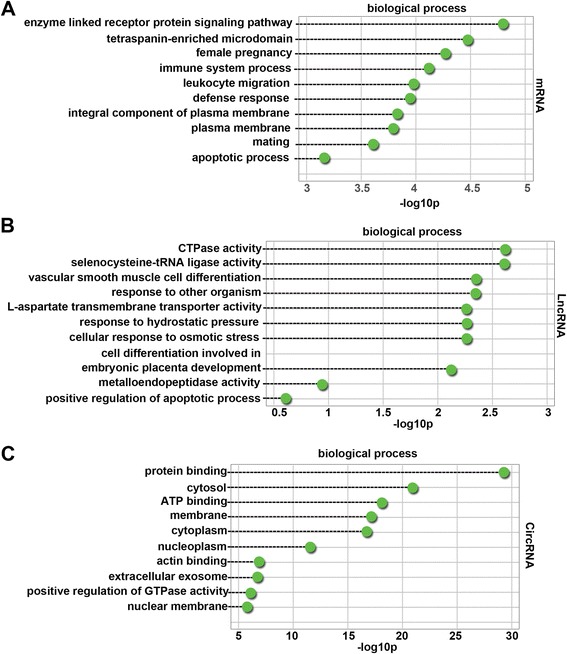
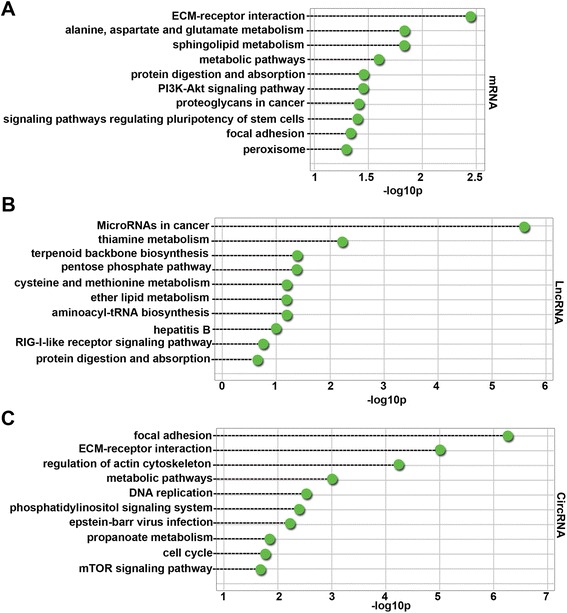
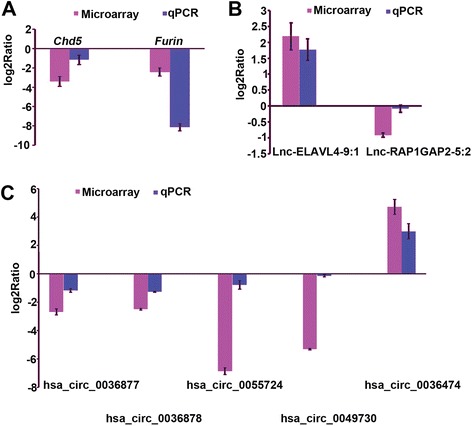
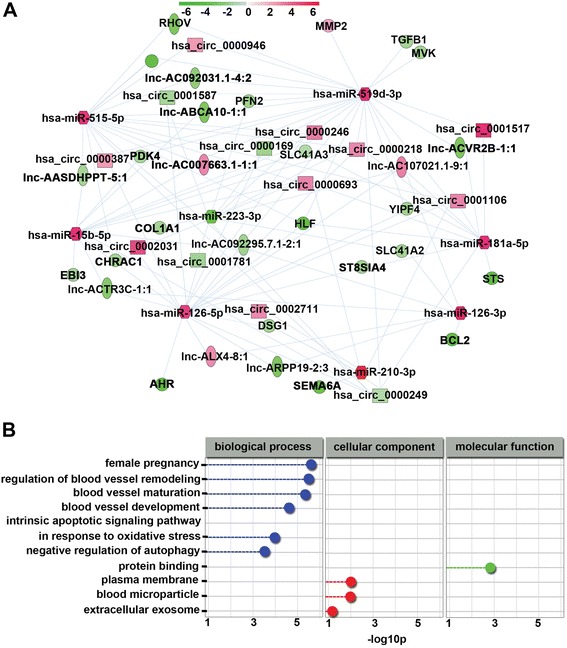
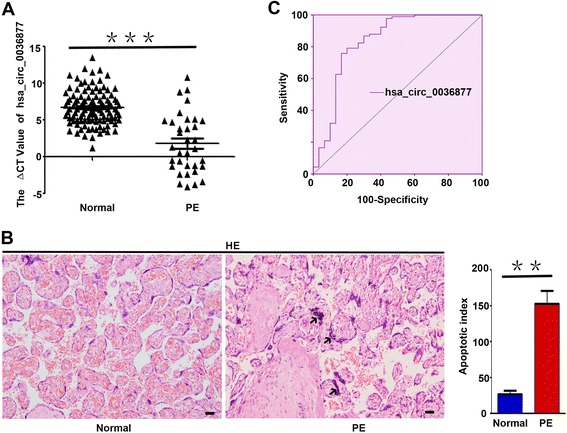
Results: Using microarray analysis, we investigated differentially expressed ceRNAs in human normal and SPE placentas. Bioinformatics, such as gene ontology, KEGG pathway, and ceRNA network analyses, were performed to evaluate the microarray data and gain further insights into the biological processes. RNAs (Chd5, Furin, lnc-ELAVL4-9:1, lnc-RAP1GAP2-5:2, hsa_circ_0036877, hsa_circ_0036878, hsa_circ_0055724, hsa_circ_0049730, and hsa_circ_0036474) were validated by quantitative real-time PCR (qRT-PCR). RNA immunoprecipitation (RIP) of AGO2 in htra-8 cells and qRT-PCR analysis of hsa_circ_0036877 expression in maternal whole peripheral blood samples of participants were then conducted to confirm that hsa_circ_0036877 is a ceRNA and potential novel blood biomarker for early PE, respectively.

Conclusion: Our study is the first systematic profiling of ceRNAs in placentas of PE patients and revealed the global ceRNA network integration in PE. Moreover, hsa_circ_0036877 can function as a ceRNA and serve as a potential novel blood biomarker for early PE.

Keywords: Biomarker; Pre-eclampsia; ceRNA profiling; circRNA.


Conflict of interest statement

The study was approved by the Research Ethic Committees at the International Peace Maternity and Child Health Hospital of China Welfare Institute, SJTUM, China.Not applicable.The authors declare that they have no competing interests.Springer Nature remains neutral with regard to jurisdictional claims in published maps and institutional affiliations.

Figures

Fig. 1
Fig. 1
Hierarchical clustering of mRNAs (a), lncRNAs (b), and circRNAs (c) in placenta samples between SPE and normal controls. Placenta samples were clustered based on the expression profiles of 50 twofold differentially expressed mRNAs, 50 twofold differentially expressed lncRNAs, and 50 twofold differentially expressed circRNAs. The color bar, which increases from green to red comparing SPE samples with matched normal controls, indicates mRNA, lncRNA, and circRNA expression levels
Fig. 2
Fig. 2
Top 10 categories of GO biological processes associated with differentially expressed mRNAs (a), lncRNAs (b), and circRNAs (c). Dashed lines represent the p values of the top 10 GO biological processes. The p values were calculated by hypergeometric tests and corrected by the Benjamini-Hochberg adjustment. p values are expressed as the negative logarithm (base 10)
Fig. 3
Fig. 3
Top 10 pathways significantly enriched in differentially expressed mRNAs (a), lncRNAs (b), and circRNAs (c). Dashed lines represent the p values of the significantly enriched top 10 GO pathways. The p values were calculated by hypergeometric tests and corrected by the Benjamini-Hochberg adjustment. p values are expressed as the negative logarithm (base 10)
Fig. 4
Fig. 4
mRNA (a), lncRNA (b), and circRNA (c) expression validated by qRT-PCR. Genes determined to be differentially expressed in all SPE patients by microarray analysis were validated by qRT-PCR. The height of the columns in the chart represents the log-transformed average fold change in expression across the two groups of patients for each of the validated genes. Bars represent standard errors
Fig. 5
Fig. 5
Global ceRNA network integration in PE. a A portion of the theoretical ceRNA network in PE according to the microarray analysis and report data was predicted. The color bar, which increases from green to red comparing SPE samples with matched normal controls, indicates mRNA, lncRNA, and circRNA expression levels. b GO biological processes of the above module were involved in the pathogenesis of PE. Blue nodes represent biological processes, red nodes represent cellular components, and green nodes represent molecular functions. p values were calculated by hypergeometric tests and corrected using the Benjamini-Hochberg adjustment. p values are expressed as negative logarithms (base 10)
Fig. 6
Fig. 6
Hsa_circ_0036877 can serve as a potential novel blood biomarker for early PE. a Expression of hsa_circ_0036877 in blood samples from 110 matched normal participants and 34 patients with PE at 24 weeks of gestation was detected by qRT-PCR. The expression of hsa_circ_0036877 in blood samples of PE (ΔCt mean ± s.e.m., 1.778 ± 0.6888) diagnosed after gestation based on ACOG was significantly higher than in normal controls (ΔCt mean ± s.e.m., 6.651 ± 0.2192). Higher ΔCt value indicated lower expression. Bars indicate means ± s.e.m. from independent experiments. ***p < 0.0001. b Compared with matched normal controls, significantly increased apoptosis of syncytial trophoblasts was found in the PE placenta. Right panel showed that the apoptosis index in normal and PE placenta was statisticed. Scale bar, 50 μm. **p < 0.001 c ROC curves showed that hsa_circ_0036877 can serve as a potential blood biomarker for prediction of PE. AUC, 0.846 (95% CI 0.754–0.938); sensitivity and specificity, 85.3 and 72.7%, respectively. The cutoff value was 5.13 (ΔCt value) (the optimal cutoff point was determined at the maximum of Youden index (YI)). The PPV of an ΔCt value of 5.13 or lower for a diagnosis of preeclampsia was 49.1%. An ΔCt value above 5.13 had a high NPV of 94.1%

Similar articles

Cited by

References

    1. Sibai B, Dekker G, Kupferminc M. Pre-eclampsia. Lancet. 2005;365(9461):785–799. doi: 10.1016/S0140-6736(05)71003-5. - DOI - PubMed
    1. Cote AM, Firoz T, Mattman A, Lam EM, von Dadelszen P, Magee LA. The 24-hour urine collection: gold standard or historical practice? Am J Obstet Gynecol. 2008;199(6):625. doi: 10.1016/j.ajog.2008.06.009. - DOI - PubMed
    1. Steegers EA, von Dadelszen P, Duvekot JJ, Pijnenborg R. Pre-eclampsia. Lancet. 2010;376(9741):631–644. doi: 10.1016/S0140-6736(10)60279-6. - DOI - PubMed
    1. Kadyrov M, Kingdom JCP, Huppertz B. Divergent trophoblast invasion and apoptosis in placental bed spiral arteries from pregnancies complicated by maternal anemia and early-onset preeclampsia/intrauterine growth restriction. Am J Obstet Gynecol. 2006;194(2):557–563. doi: 10.1016/j.ajog.2005.07.035. - DOI - PubMed
    1. Kumpel BM, Manoussaka MS. Placental immunology and maternal alloimmune responses. Vox Sang. 2012;102(1):2–12. doi: 10.1111/j.1423-0410.2011.01533.x. - DOI - PubMed

Publication types