. 2018 Mar 2;9(21):15437-15450.
doi: 10.18632/oncotarget.24602. eCollection 2018 Mar 20.

The glucocorticoid receptor in recipient cells keeps cytokine secretion in acute graft-versus-host disease at bay

Affiliations

The glucocorticoid receptor in recipient cells keeps cytokine secretion in acute graft-versus-host disease at bay

Tina Baake et al. Oncotarget. .

Abstract

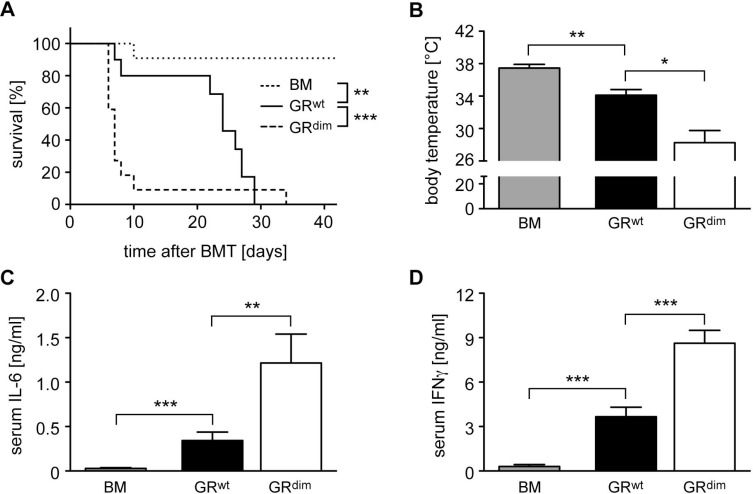
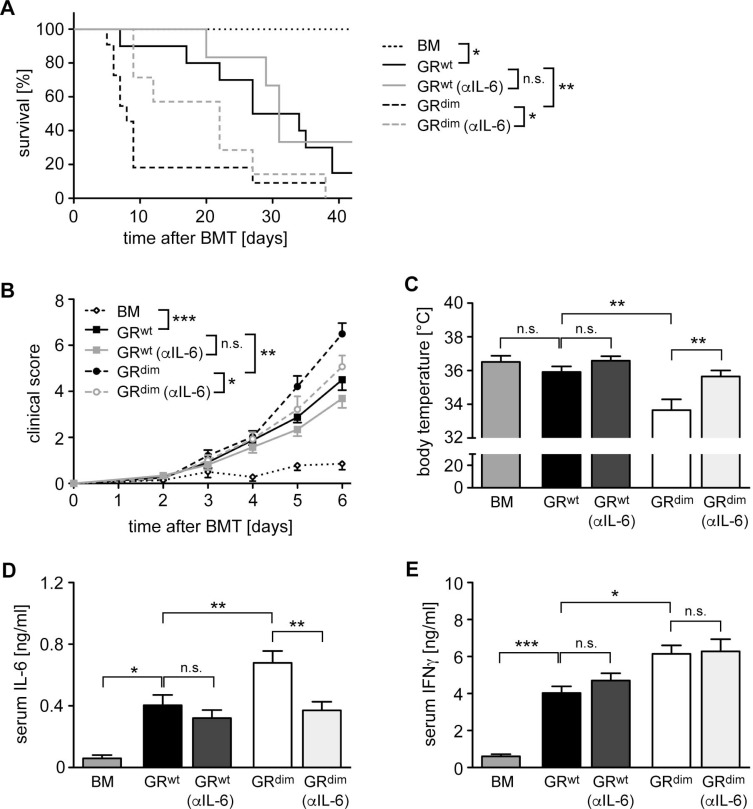
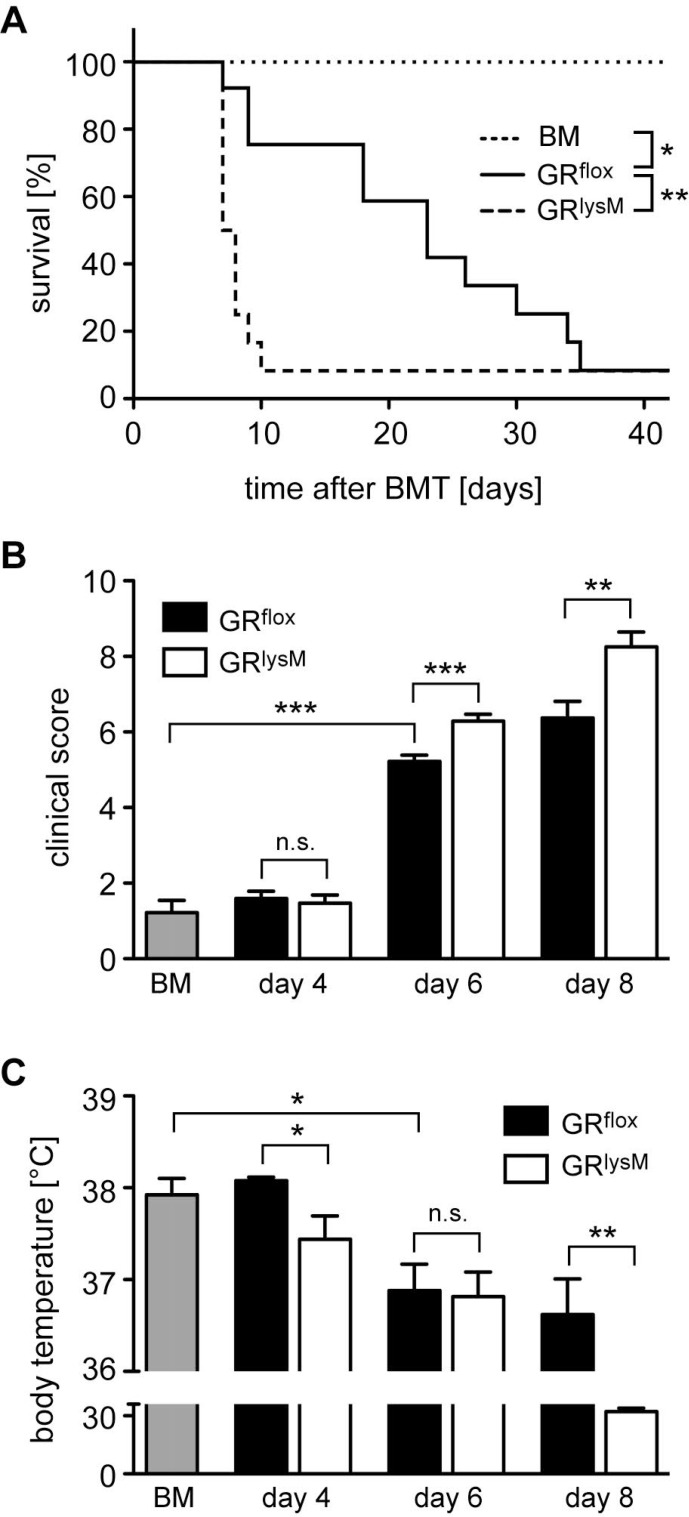
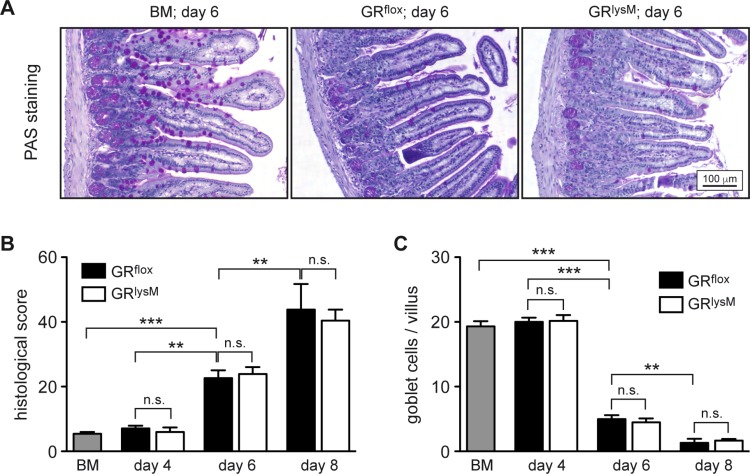
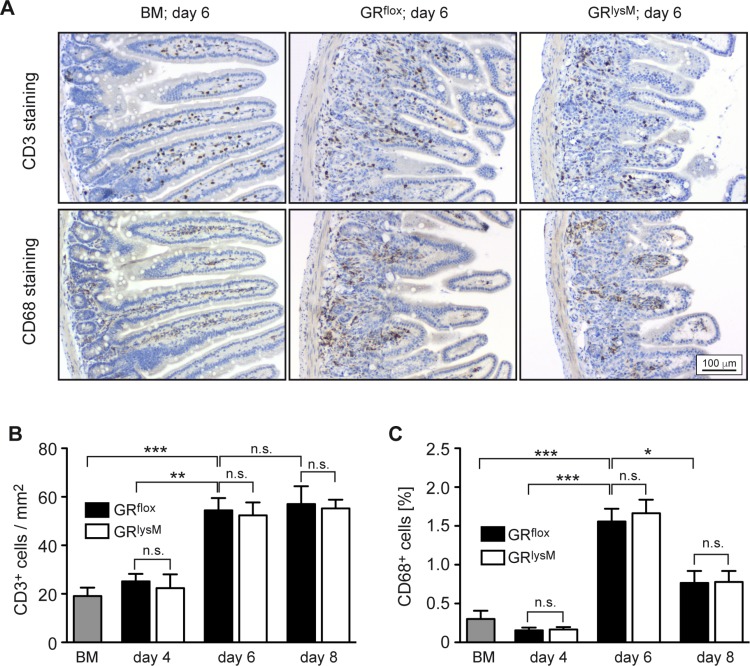
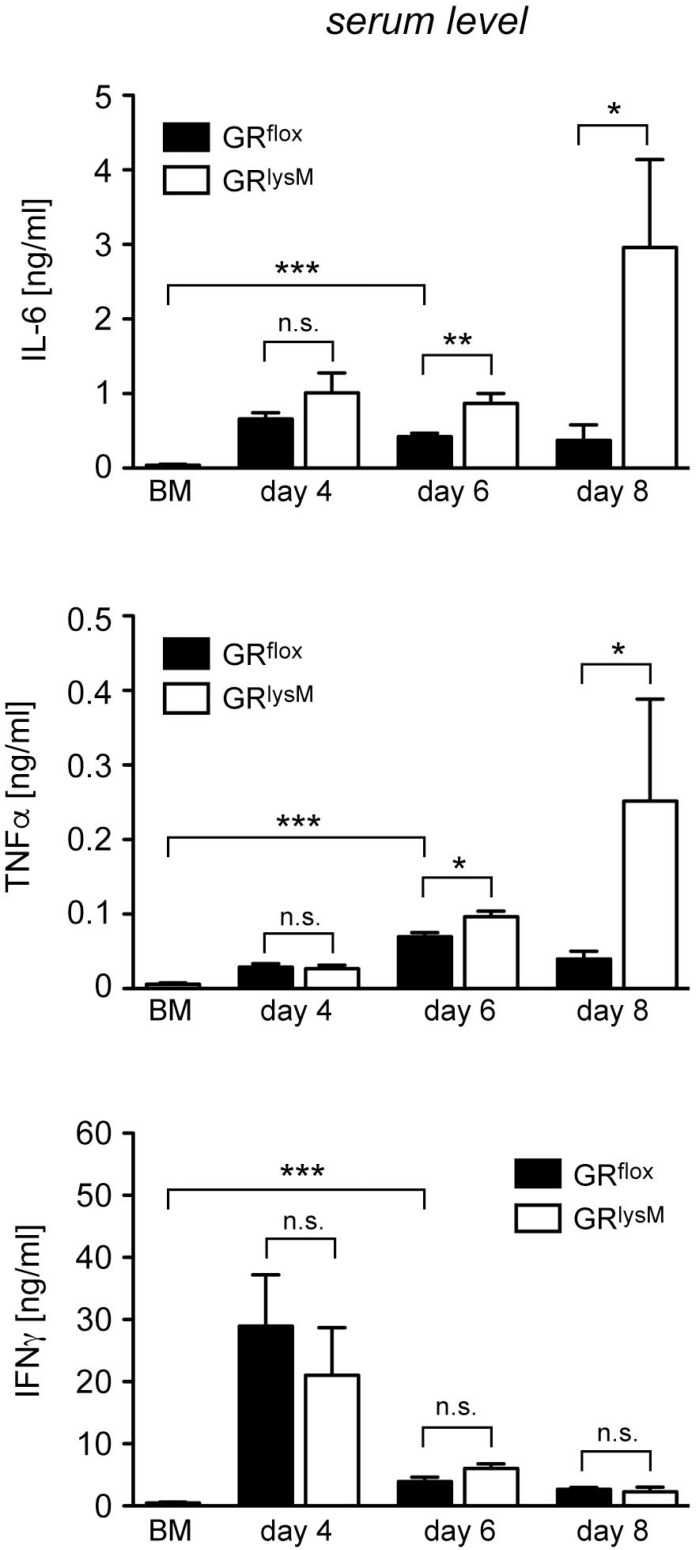
Graft-versus-host disease (GvHD) is a life-threatening complication of hematopoietic stem cell transplantation (HSCT), which is caused by allogeneic T cells recognizing molecules of the recipient as foreign. Endogenous glucocorticoids (GC) released from the adrenal gland are crucial in regulating such inflammatory diseases. Here we demonstrate that genetically engineered mice, that are largely unresponsive to GC, suffer from aggravated clinical symptoms and increased mortality after HSCT, effects that could be tempered by neutralization of IL-6. Interestingly, selective ablation of the GC receptor (GR) in recipient myeloid cells resulted in fulminant disease as well. While histopathological analysis of the jejunum failed to reveal any differences between sick mice of both genotypes, systemic IL-6 and TNFα secretion was strongly increased in transplanted mice lacking the GR in myeloid cells briefly before the majority of them succumbed to the disease. Collectively, our findings reveal an important role of the GR in recipient cells in limiting the cytokine storm caused by GvHD induction.

Keywords: GvHD; IL-6; cytokine storm; glucocorticoid receptor; myeloid cells.


Conflict of interest statement

CONFLICTS OF INTEREST The authors declare no conflicts of interest.

Figures

Figure 1
Figure 1. Mortality and clinical features of aGvHD in the GRdim model
GRwt and GRdim BALB/c mice were transplanted with BM and purified T cells from C57BL/6 wildtype mice; transfer of BM cells only served as a control. (A) Survival of mice was monitored for 42 days. N = 11 (BM), N = 10 (GRwt), N = 22 (GRdim); data pooled from multiple experiments. (B) Body temperature of mice was analyzed on day 6. N = 6 (BM), N = 7 (GRwt), N = 9 (GRdim); data pooled from multiple experiments. (C, D) Mice were sacrificed on day 6 and serum levels of IL-6 (C) and IFNγ (D) were analyzed by ELISA. N = 7 (BM), N = 9 (GRwt), N = 6 (GRdim) for IL-6; N = 7 (BM), N = 13 (GRwt), N = 15 (GRdim) for IFNγ; data pooled from multiple experiments. All values are depicted as the mean ± SEM. Survival curves were compared using the Gehan-Breslow-Wilcoxon test, statistical analyses of body temperature and cytokine levels were performed by Mann-Whitney U test (*p < 0.05; **p < 0.01; ***p < 0.001; n.s.: non-significant).
Figure 2
Figure 2. Impact of anti-IL-6 antibody treatment on mortality and clinical features of aGvHD in the GRdim model
GRwt and GRdim BALB/c mice were transplanted with BM and purified T cells from C57BL/6 wildtype mice. Some mice received an anti-IL-6 (αIL-6) antibody i.v. on day 2 (all panels) and day 6 (panel A); transfer of BM cells only served as a control. (A) Survival of mice was monitored for 42 days. N = 7 (BM), N = 10/6 (GRwt ± αIL-6), N = 11/7 (GRdim ± αIL-6); data pooled from multiple experiments. (B) Clinical scores of mice during the first 6 days after aGvHD induction (dead mice were considered with a score of 10). N = 7 (BM), N = 12/13 (GRwt ± αIL-6), N = 19/14 (GRdim ± αIL-6); data pooled from multiple experiments. (C) Body temperature of mice was analyzed on day 6. N = 7 (BM), N = 15/13 (GRwt ± αIL-6), N = 22/13 (GRdim ± αIL-6); data pooled from multiple experiments. (D, E) Mice were sacrificed on day 6 and serum levels of IL-6 (D) and IFNγ (E) were analyzed by ELISA. N = 7 (BM), N = 8/11 (GRwt ± αIL-6), N = 14/12 (GRdim ± αIL-6) for IL-6; N = 7 (BM), N = 8/12 (GRwt ± αIL-6), N = 16/12 (GRdim ± αIL-6) for IFNγ; data pooled from multiple experiments. All values are depicted as the mean ± SEM. Survival curves were compared using the Gehan-Breslow-Wilcoxon test, statistical analyses of body temperature and cytokine levels were performed by One-way ANOVA followed by Newman-Keuls multiple comparison test (*p < 0.05; **p < 0.01; ***p < 0.001; n.s.: non-significant).
Figure 3
Figure 3. Mortality and clinical features of aGvHD in the GRlysM model
GRflox and GRlysM BALB/c mice were transplanted with BM and purified T cells from C57BL/6 wildtype mice; transfer of BM cells only served as a control. (A) Survival of mice was monitored for 42 days. N = 6 (BM), N = 14 (GRflox), N = 13 (GRlysM); data pooled from multiple experiments. (B) Clinical scores were determined on day 4, 6 and 8 after aGvHD induction (dead mice were considered with a score of 10); analysis of BM controls was performed on day 6. N = 9 (BM), N = 31/31 (GRflox/GRlysM; day 4), N = 39/40 (GRflox/GRlysM; day 6), N = 19/20 (GRflox/GRlysM; day 8); data pooled from multiple experiments. (C) Body temperature was determined on day 4, 6 and 8 after aGvHD induction; analysis of BM controls was performed on day 6. N = 8 (BM), N = 5/5 (GRflox/GRlysM; day 4), N = 20/22 (GRflox/GRlysM; day 6), N = 5/7 (GRflox/GRlysM; day 8); data pooled from multiple experiments. All values are depicted as the mean ± SEM. Survival curves were compared using the Gehan-Breslow-Wilcoxon test, statistical analyses of clinical scores, body temperature and cytokine levels were performed by Mann-Whitney U test (*p < 0.05; **p < 0.01; ***p < 0.001; n.s.: non-significant).
Figure 4
Figure 4. Histological assessment of the jejunum in the early phase of aGvHD in the GRlysM model
GRflox and GRlysM BALB/c mice were transplanted with BM and purified T cells from C57BL/6 wildtype mice; transfer of BM cells only served as a control. Mice were sacrificed and analyzed on day 4, 6 and 8 after aGvHD induction; analysis of BM controls was performed on day 6. (A) Representative microphotographs of sections of the jejunum collected on day 6 from BM control and aGvHD mice stained by PAS reaction. Size bar: 100 µm. (B) Histological scores obtained by assessment of H&E stained jejunum sections from all experimental groups. N = 7 (BM), N = 5/5 (GRflox/GRlysM; day 4), N = 20/21 (GRflox/GRlysM; day 6), N = 6/7 (GRflox/GRlysM; day 8); data pooled from multiple experiments. (C) Goblet cell numbers per villus determined by PAS staining of jejunum sections from all experimental groups. N = 6 (BM), N = 5/5 (GRflox/GRlysM; day 4), N = 18/21 (GRflox/GRlysM; day 6), N = 5/8 (GRflox/GRlysM; day 8); data pooled from multiple experiments. All values are depicted as mean ± SEM. Statistical analyses were performed by Mann-Whitney U test (**p < 0.01; ***p < 0.001; n.s.: non-significant).
Figure 5
Figure 5. Immunohistochemical assessment of the jejunum in the early phase of aGvHD in the GRlysM model
GRflox and GRlysM BALB/c mice were transplanted with BM and purified T cells from C57BL/6 wildtype mice; transfer of BM cells only served as a control. Mice were sacrificed and analyzed on day 4, 6 and 8 after aGvHD induction; analysis of BM controls was performed on day 6. (A) Representative microphotographs of sections of the jejunum collected on day 6 from BM control and aGvHD mice and stained with antibodies recognizing CD3 (upper panel) or CD68 (lower panel). Size bar: 100 µm. (B) Numbers of CD3+ cells per mm2 were determined by computer-aided counting of stained cells in jejunum sections from all experimental groups using ImageJ software. N = 7 (BM), N = 5/5 (GRflox/GRlysM; day 4), N = 20/21 (GRflox/GRlysM; day 6), N = 6/7 (GRflox/GRlysM; day 8); data pooled from multiple experiments. (C) CD68+ cells were enumerated in jejunum sections from all experimental groups by measuring the percentage of stained area using ImageJ software. N = 6 (BM), N = 5/5 (GRflox/GRlysM; day 4), N = 20/20 (GRflox/GRlysM; day 6), N = 6/7 (GRflox/GRlysM; day 8); data pooled from multiple experiments. All values are depicted as mean ± SEM. Statistical analyses were performed by Mann-Whitney U test (*p < 0.05; **p < 0.01; ***p < 0.001; n.s.: non-significant).
Figure 6
Figure 6. Cytokine expression and secretion in the jejunum in the early phase of aGvHD in the GRlysM model
GRflox and GRlysM BALB/c mice were transplanted with BM and purified T cells from C57BL/6 wildtype mice; transfer of BM cells only served as a control. Mice were sacrificed and analyzed on day 4, 6 and 8 after aGvHD induction; analysis of BM controls was performed on day 6. (A) Relative mRNA levels of IL-6, TNFα and IFNγ in jejunum biopsies were determined by quantitative RT-PCR using HPRT for normalization. Gene expression in BM control mice was arbitrarily set to 1. N = 4 (BM), N = 5/5 (GRflox/GRlysM; day 4), N = 12/15 (GRflox/GRlysM; day 6), N = 5/7 (GRflox/GRlysM; day 8); data pooled from multiple experiments. (B) Jejunum biopsies were cultured for 24 hours in RPMI+ medium and IL-6, TNFα and IFNγ levels in the supernatant were determined by ELISA. N = 4 (BM), N = 5/5 (GRflox/GRlysM; day 4), N = 14/15 (GRflox/GRlysM; day 6), N = 6/8 (GRflox/GRlysM; day 8); data pooled from multiple experiments. All values are depicted as mean ± SEM. Statistical analyses were performed by Mann-Whitney U test (*p < 0.05; n.s.: **p < 0.01; n.s.: non-significant).
Figure 7
Figure 7. Cytokine serum levels in the early phase of aGvHD in the GRlysM model
GRflox and GRlysM BALB/c mice were transplanted with BM and purified T cells from C57BL/6 wildtype mice; transfer of BM cells only served as a control. Mice were sacrificed and analyzed on day 4, 6 and 8 after aGvHD induction; analysis of BM controls was performed on day 6. Serum levels of IL-6, TNFα and IFNγ were determined by ELISA and are depicted as mean values ± SEM. N = 12 (BM), N = 5/5 (GRflox/GRlysM; day 4), N = 27/28 (GRflox/GRlysM; day 6), N = 6/7 (GRflox/GRlysM; day 8); data pooled from multiple experiments. Statistical analyses were performed by Mann-Whitney U test (*p < 0.05; **p < 0.01; ***p < 0.001; n.s.: non-significant).

Similar articles

Cited by

References

    1. Ferrara JL, Levine JE, Reddy P, Holler E. Graft-versus-host disease. Lancet. 2009;373:1550–1561. - PMC - PubMed
    1. Shlomchik WD. Graft-versus-host disease. Nat Rev Immunol. 2007;7:340–352. - PubMed
    1. Shlomchik WD, Couzens MS, Tang CB, McNiff J, Robert ME, Liu J, Shlomchik MJ, Emerson SG. Prevention of graft versus host disease by inactivation of host antigen-presenting cells. Science. 1999;285:412–415. - PubMed
    1. Hill GR, Crawford JM, Cooke KR, Brinson YS, Pan L, Ferrara JL. Total body irradiation and acute graft-versus-host disease: the role of gastrointestinal damage and inflammatory cytokines. Blood. 1997;90:3204–3213. - PubMed
    1. Petersdorf EW, Longton GM, Anasetti C, Mickelson EM, McKinney SK, Smith AG, Martin PJ, Hansen JA. Association of HLA-C disparity with graft failure after marrow transplantation from unrelated donors. Blood. 1997;89:1818–1823. - PubMed

LinkOut - more resources