. 2018 Feb 28;9(21):15691-15704.
doi: 10.18632/oncotarget.24593. eCollection 2018 Mar 20.

Loss of neutrophil polarization in colon carcinoma liver metastases of mice with an inducible, liver-specific IGF-I deficiency

Affiliations

Loss of neutrophil polarization in colon carcinoma liver metastases of mice with an inducible, liver-specific IGF-I deficiency

Roni F Rayes et al. Oncotarget. .

Abstract

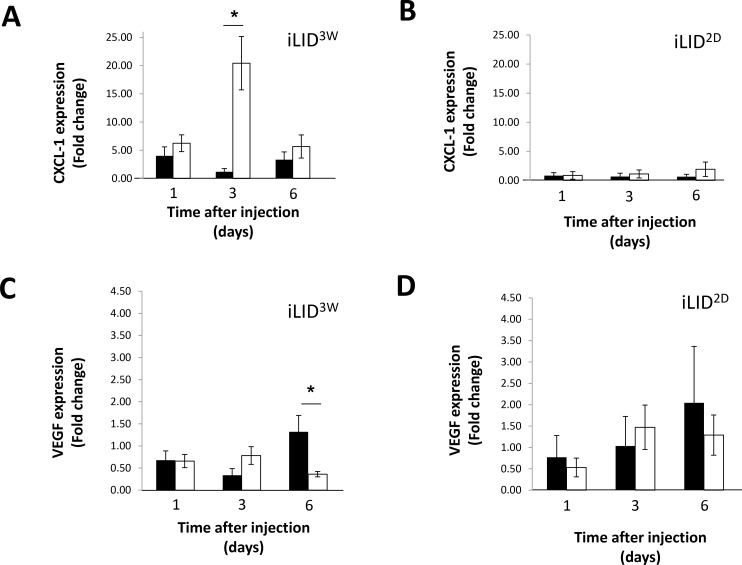
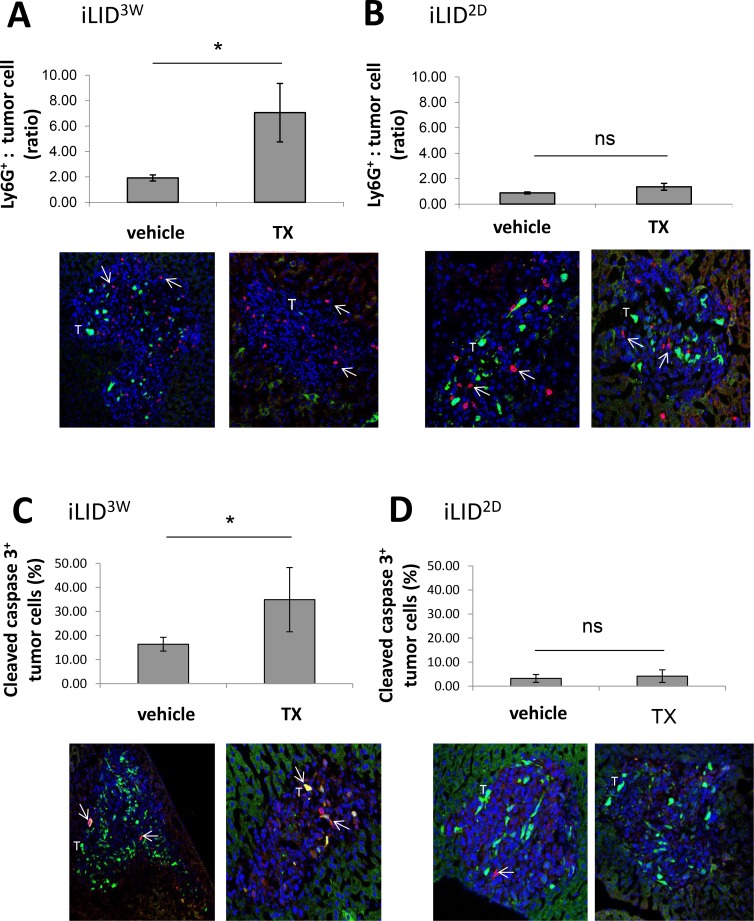
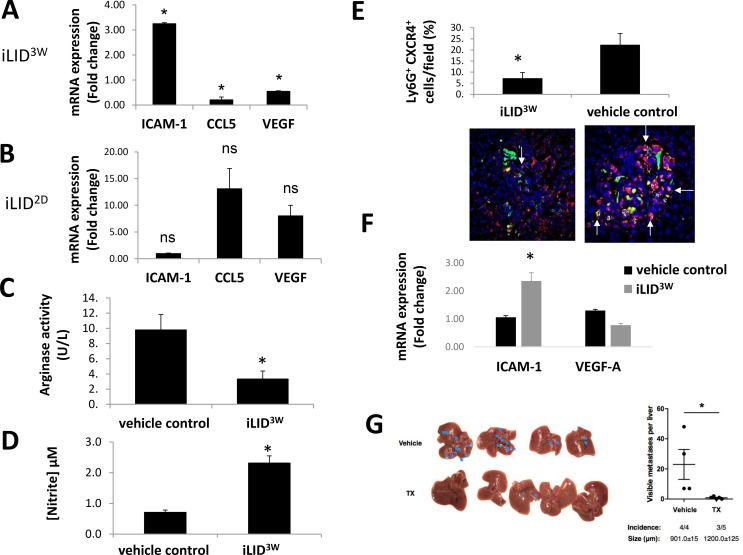
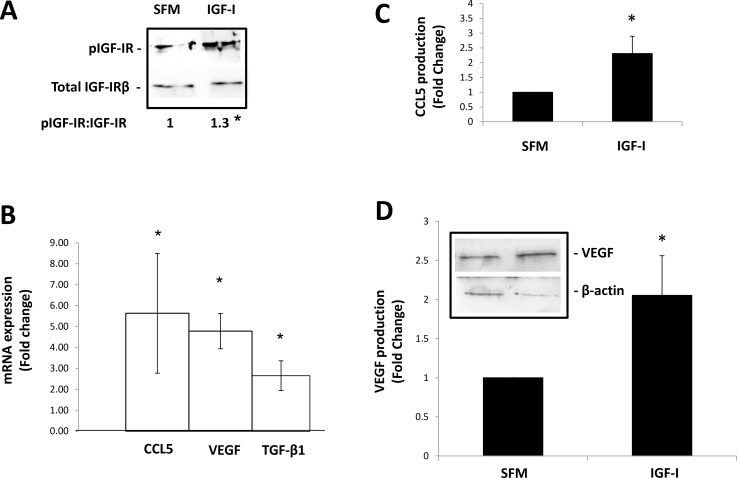
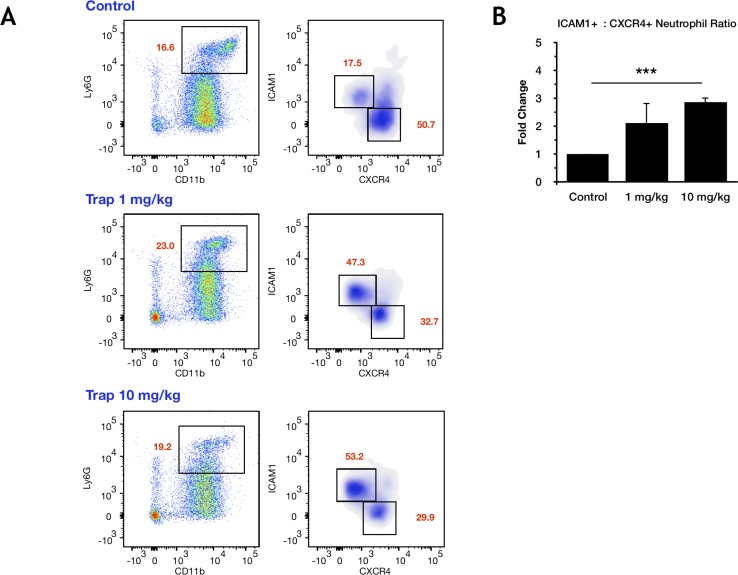
The growth of cancer metastases in the liver depends on a permissive interaction with the hepatic microenvironment and neutrophils can contribute to this interaction, either positively or negatively, depending on their phenotype. Here we investigated the role of IGF-I in the control of the tumor microenvironment in the liver, using mice with a conditional, liver-specific, IGF-I deficiency (iLID) induced by a single tamoxifen injection. In mice that had a sustained (3 weeks) IGF-I deficiency prior to the intrasplenic/portal inoculation of colon carcinoma MC-38 cells, we observed an increase in neutrophil accumulation in the liver relative to controls. However, unlike controls, these neutrophils did not acquire the (anti-inflammatory) tumor-promoting phenotype, as evidenced by retention of high ICAM-1 expression and nitric oxide production and low CXCR4, CCL5, and VEGF expression and arginase production, all characteristic of the (pro-inflammatory) phenotype. This coincided with an increase in apoptotic tumor cells and reduced metastasis. Neutrophils isolated from these mice also had reduced IGF-IR expression levels. These changes were not observed in iLID mice with a short-term (2 days) IGF-I depletion, despite a 70% reduction in their circulating IGF-I levels, indicating that a sustained IGF-I deficiency was necessary to alter the neutrophil phenotype. Similar results were obtained with the highly metastatic Lewis lung carcinoma subline H-59 cells and in mice injected with an IGF-Trap that blocks IGF-IR signaling by reducing ligand bioavailability. Our results implicate the IGF axis in neutrophil polarization and the induction of a pro-metastatic microenvironment in the liver.

Keywords: IGF-I; colorectal carcinoma; liver metastasis; neutrophil polarization; tumor microenvironment.


Conflict of interest statement

CONFLICTS OF INTEREST The authors have no conflict of interest to declare.

Figures

Figure 1
Figure 1. Altered chemokine/cytokine expression in tumor-injected mice with a sustained IGF-I deficiency
iLID mice were injected i.p. with TX or sunflower seed oil (vehicle) 3 weeks (A, C) or 2 days (B, D) prior to the injection of 2.5 × 10⁵ MC-38-GFP cells via the intrasplenic/portal route. Mice were sacrificed 1, 3 or 6 days post tumor injection and liver fragments used for RNA extraction and analysis. Shown are expression levels of CXCL-1 (A, B) and VEGF (C, D) in TX- (white bar) and vehicle- (black bar)-injected mice, each normalized to GAPDH. The data are expressed as fold change (±SE) relative to non-injected mice that were assigned a value of 1. They are based on 3 mice per group per time point; *p < 0.05.
Figure 2
Figure 2. Increased neutrophil accumulation and tumor cell apoptosis in IGF-I deficient mice
iLID mice were injected i.p. with TX or vehicle, 3 weeks (A, C) or 2 days (B, D) prior to the injection of 2.5 × 10⁵ MC-38-GFP cells via the intrasplenic/portal route. Mice were sacrificed 6 days post tumor injection and livers first perfused with PFA and then excised for subsequent immunohistochemical analysis. Shown in the bar graphs (A, B) are the mean numbers (±SE) of Ly6G+ cells counted in tumor infiltrated areas of the liver (top). They are based on 12 random fields (×10 objective), counted per condition and expressed as a ratio to the number of GFP+ MC-38 cells in each field. Representative images are shown on the bottom with DAPI in blue, GFP+ MC-38 cells (T) in green and Ly6G+ cells in red (arrows). Shown in (C, D) are results of quantification of MC-38 cells that expressed cleaved caspase 3, counted in 15 random fields (×10 objective) per condition and expressed as % (±SE) of the total number of tumor cells per field. Representative images are shown at the bottom with DAPI in blue, GFP+ MC-38 cells (T) in green and cleaved caspase 3-positive cells in red (arrow). n = 3. ns = not significant, *p < 0.05.
Figure 3
Figure 3. Reduced neutrophil polarization in mice with a sustained IGF-I deficiency
Mice were injected as described in the legend to Figure 2 and sacrificed 6 days later. (A–E). Immune cells were collected and CD11b+Ly6G+ cells isolated using FACS sorting. Shown in (A) and (B) are results of qPCR performed on RNA extracted from CD11b+Ly6G+ cells isolated from iLID3W (A) or iLID2D (B) mice. They are based on 3 separate experiments (7–10 mice per group per experiment) and normalized to GAPDH and expressed as a ratio to the respective vehicle treated control mice. Shown in (C) are results of the arginase assay performed on total lysates of isolated CD11b+Ly6G+ cells. They are based on 3 separate experiments (7–10 mice per group per experiment) and expressed as means (±SE). Shown in (D) are nitrate levels measured in conditioned media of CD11b+Ly6G+ cells isolated from the indicated mice and incubated at 37° C overnight. They are based on 3 separate experiments (7–10 mice per group per experiment) and expressed as means (±SE). Shown in (E) are results of immunohistochemistry performed on cryostat sections derived from MC-38 cells-injected mice. Representative images of double stained cells (white arrow) with antibodies to Ly6G (in yellow) and CXCR4 (in red) around tumor cells (green) are shown on the bottom with DAPI (in blue). Results in the bar graph (top) are based on quantification performed on 8–10 sections for 3 different mice per group (n = 3 mice) and expressed as percent (±SE) of Ly6G+ cells that also stained positively for CXCR4+. (F) iLID mice were injected i.p. with TX or vehicle, 3 weeks prior to the injection of 2.5 × 10⁵ MC-38 cells via the intrasplenic/portal route. Mice were sacrificed 6 days post tumor injection and hepatic immune cells isolated. CD11b+Ly6G+ cells were sorted by FACS and RNA extracted for RT-qPCR analysis. Data in the bar graph are expressed as mean fold change (±SE) relative to vehicle control, based on 3 separate experiments (5–7 mice per group). (G) iLID mice received a single i.p. injection of 0.3 mg TX or sunflower seed oil (vehicle) 3 weeks prior to the injection of 105 H-59 cells via the intrasplenic/portal route. Mice were sacrificed 14 days following tumor cell injection and metastases on the surfaces of the livers enumerated. Shown in the graph are the numbers of metastases seen on the individual livers in each group. Horizontal bars denote medians. The number of mice in each group that developed hepatic metastases is indicated on the bottom of each column. The average size of the metastases (±SD) is shown below each column. n = 4–5; ns = not significant, *p < 0.05. Representative livers from each group are shown on the left. Metastases are indicated by arrows.
Figure 4
Figure 4. A sustained IGF-I depletion reduces IGF-IR expression levels in neutrophils
ILID mice were injected with TX or vehicle 3 weeks (A) or 2 days (B) prior to the injection of 5 × 10⁴ MC-38 cells via the intrasplenic/portal route. Mice were sacrificed 6 days later and CD11b+Ly6G+ cells isolated and processed for qPCR (left) or flow cytometry (middle and right panels) using an anti IGF-IR antibody (diluted 1:100) and an Alexa Fluor 488 secondary antibody (diluted 1:200) for the latter. Shown are IGF-IR mRNA levels normalized to GAPDH (left panels), flow cytometry profiles (middle panels) and the percent IGF-IR+ neutrophils (right panels) expressed as means (±SE) of three experiments per condition (and 3 mice per experiment) relative to the respective, vehicle-injected mice that were assigned a value of 1. ns = not significant, *p < 0.05.
Figure 5
Figure 5. IGF-I can directly induce the expression of mRNA transcripts that define the tumor-promoting phenotype of neutrophils
CD11b+Ly6G+ cells were isolate from the bone marrow of C57BL/6 mice using FACS sorting and cultured in vitro in serum free media (SFM) containing (or not) 10 ng/ml IGF-I for either 5 minutes prior to cell lysis for Western blotting (A), 3–4 hours prior to RNA extraction and analysis by qPCR (B) or 7–8 hours prior to collection of conditioned media for analysis by ELISA or Western blotting (C, D). Shown in (A) is a representative immunoblot performed on cell lysate proteins (3 mice/experiment/condition) and (on the bottom) the ratios of pIGFIR:IGFIR based on 3 different experiments and normalized to β-actin that was used as a loading control. Shown in (B) are mean expression values of the indicated transcripts normalized to GAPDH and expressed as fold change relative to non-treated cells that were assigned a value of 1 (n = 3). Shown in (C) are results of ELISA and in (D) results of immunoblotting, both performed on conditioned media collected from cultured neutrophils. They are expressed as means of fold increase (±SE) relative to unstimulated cells that were assigned a value of 1. A representative immunoblot is shown in the inset (D). The values shown in the bar graph were normalized to β-actin levels in the total cell lysates obtained from the neutrophils that were used as source of conditioned media (n = 3). *p < 0.05.
Figure 6
Figure 6. Treatment with the IGF-TRAP reduces the proportion of N2-polarized tumor-infiltrating neutrophils in vivo
C57Bl/6 mice were injected with 2.5 × 10⁵ MC-38 cells via the intrasplenic/portal route. Treatment with 1 or 10 mg/kg IGF-TRAP was initiated one day later and continued on alternate days for a total of 3 injections per mouse. Animals were euthanized and immune cells collected 6 days post tumor injection. Shown in (A) are representative flow cytometric profiles of CD11b+Ly6GHigh neutrophils obtained from treated and untreated mice (3–6 mice per treatment arm, n = 3). The percent ICAM-1+ or CXCR4+ neutrophils are indicated in red. Shown in (B) are the means of fold change in the ratios of ICAM-1+:CXCR4+ neutrophils relative to control, non-treated mice (±SE) that were assigned a value of 1, based on the 3 experiments. ***p < 0.001.

Similar articles

Cited by

References

    1. Murray PJ, Allen JE, Biswas SK, Fisher EA, Gilroy DW, Goerdt S, Gordon S, Hamilton JA, Ivashkiv LB, Lawrence T, Locati M, Mantovani A, Martinez FO, et al. Macrophage activation and polarization: nomenclature and experimental guidelines. Immunity. 2014;41:14–20. - PMC - PubMed
    1. Schouppe E, De Baetselier P, Van Ginderachter JA, Sarukhan A. Instruction of myeloid cells by the tumor microenvironment: Open questions on the dynamics and plasticity of different tumor-associated myeloid cell populations. OncoImmunology. 2012;1:1135–1145. - PMC - PubMed
    1. Mills CD, Kincaid K, Alt JM, Heilman MJ, Hill AM. M-1/M-2 macrophages and the Th1/Th2 paradigm. J Immunol. 2000;164:6166–6173. - PubMed
    1. Mantovani A, Sozzani S, Locati M, Allavena P, Sica A. Macrophage polarization: tumor-associated macrophages as a paradigm for polarized M2 mononuclear phagocytes. Trends Immunol. 2002;23:549–555. - PubMed
    1. Martinez FO, Gordon S. The M1 and M2 paradigm of macrophage activation: time for reassessment. F1000prime Rep. 2014;6:13. - PMC - PubMed

LinkOut - more resources